Grafana Prometheus Node-Exporter cAdvisor - Docker Monitoring Stack
Boot the stack with docker compose (or make up):
docker-compose up -dEnsure all containers are running:
docker-compose psThe output should looke like this:
    Name                   Command                  State               Ports
--------------------------------------------------------------------------------------
cadvisor        /usr/bin/cadvisor -logtostderr   Up (healthy)   8080/tcp
grafana         /run.sh                          Up             0.0.0.0:3000->3000/tcp
node-exporter   /bin/node_exporter --path. ...   Up             9100/tcp
prometheus      /bin/prometheus --config.f ...   Up             0.0.0.0:9090->9090/tcp
alertmanager    /bin/alertmanager --config ...   Up             0.0.0.0:9093->9093/tcp
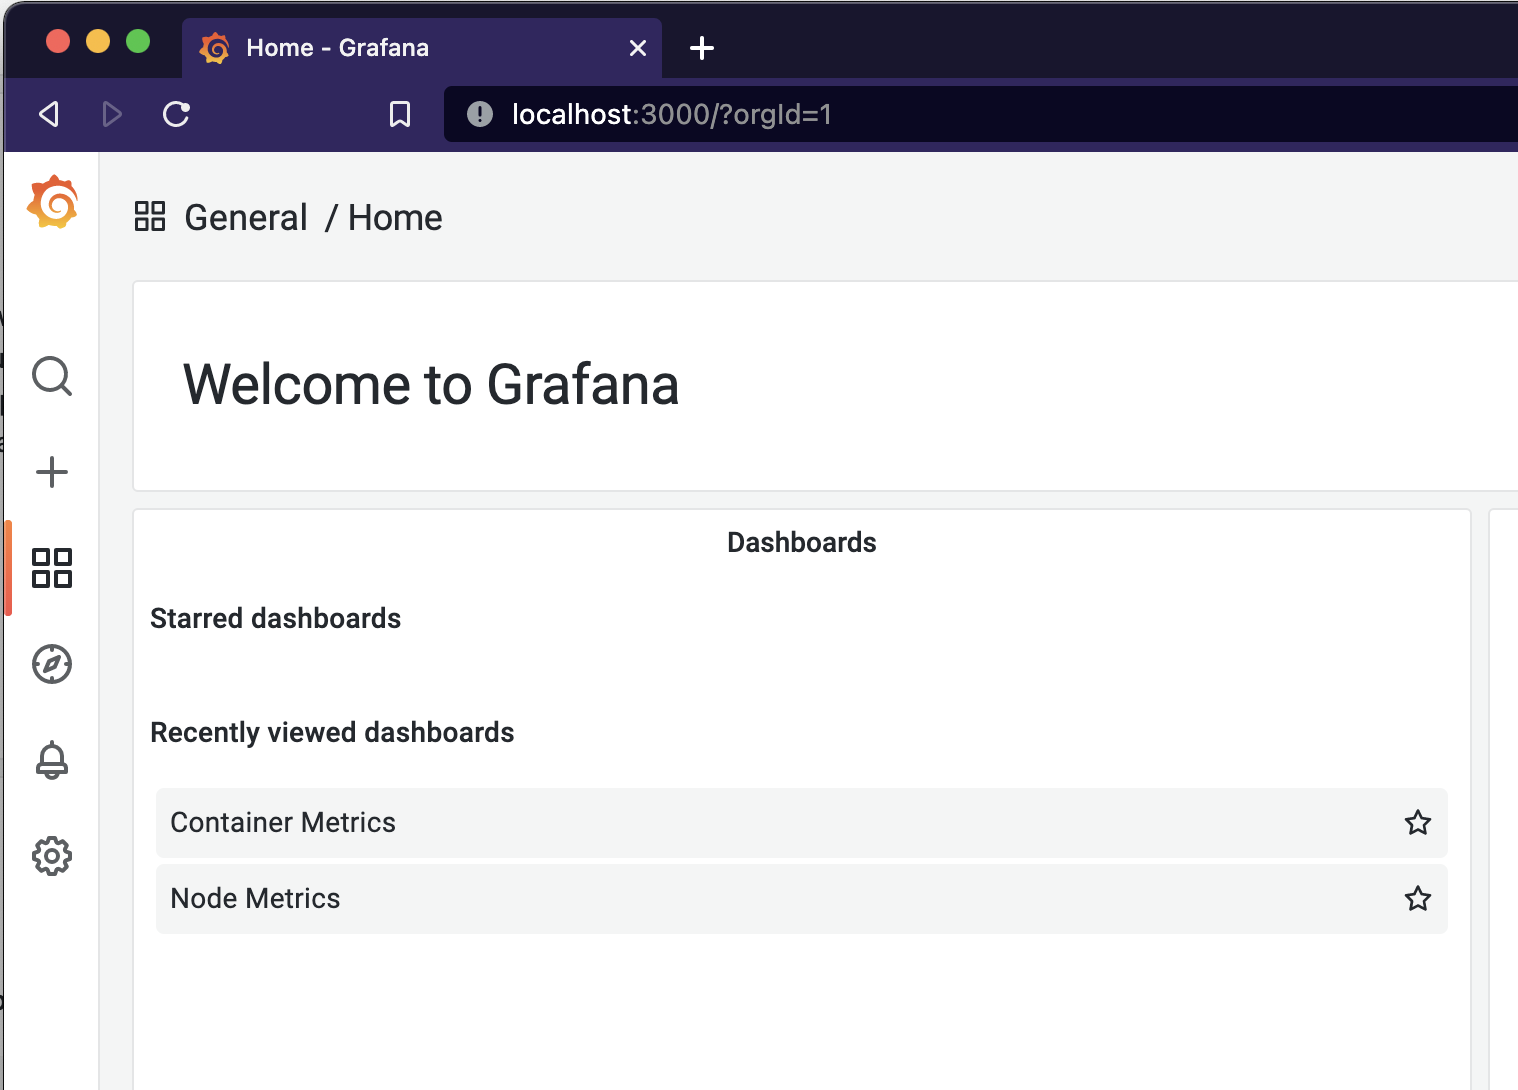
Access grafana on Grafana Home (or make open) and you should see the two dashboards that was provisioned:
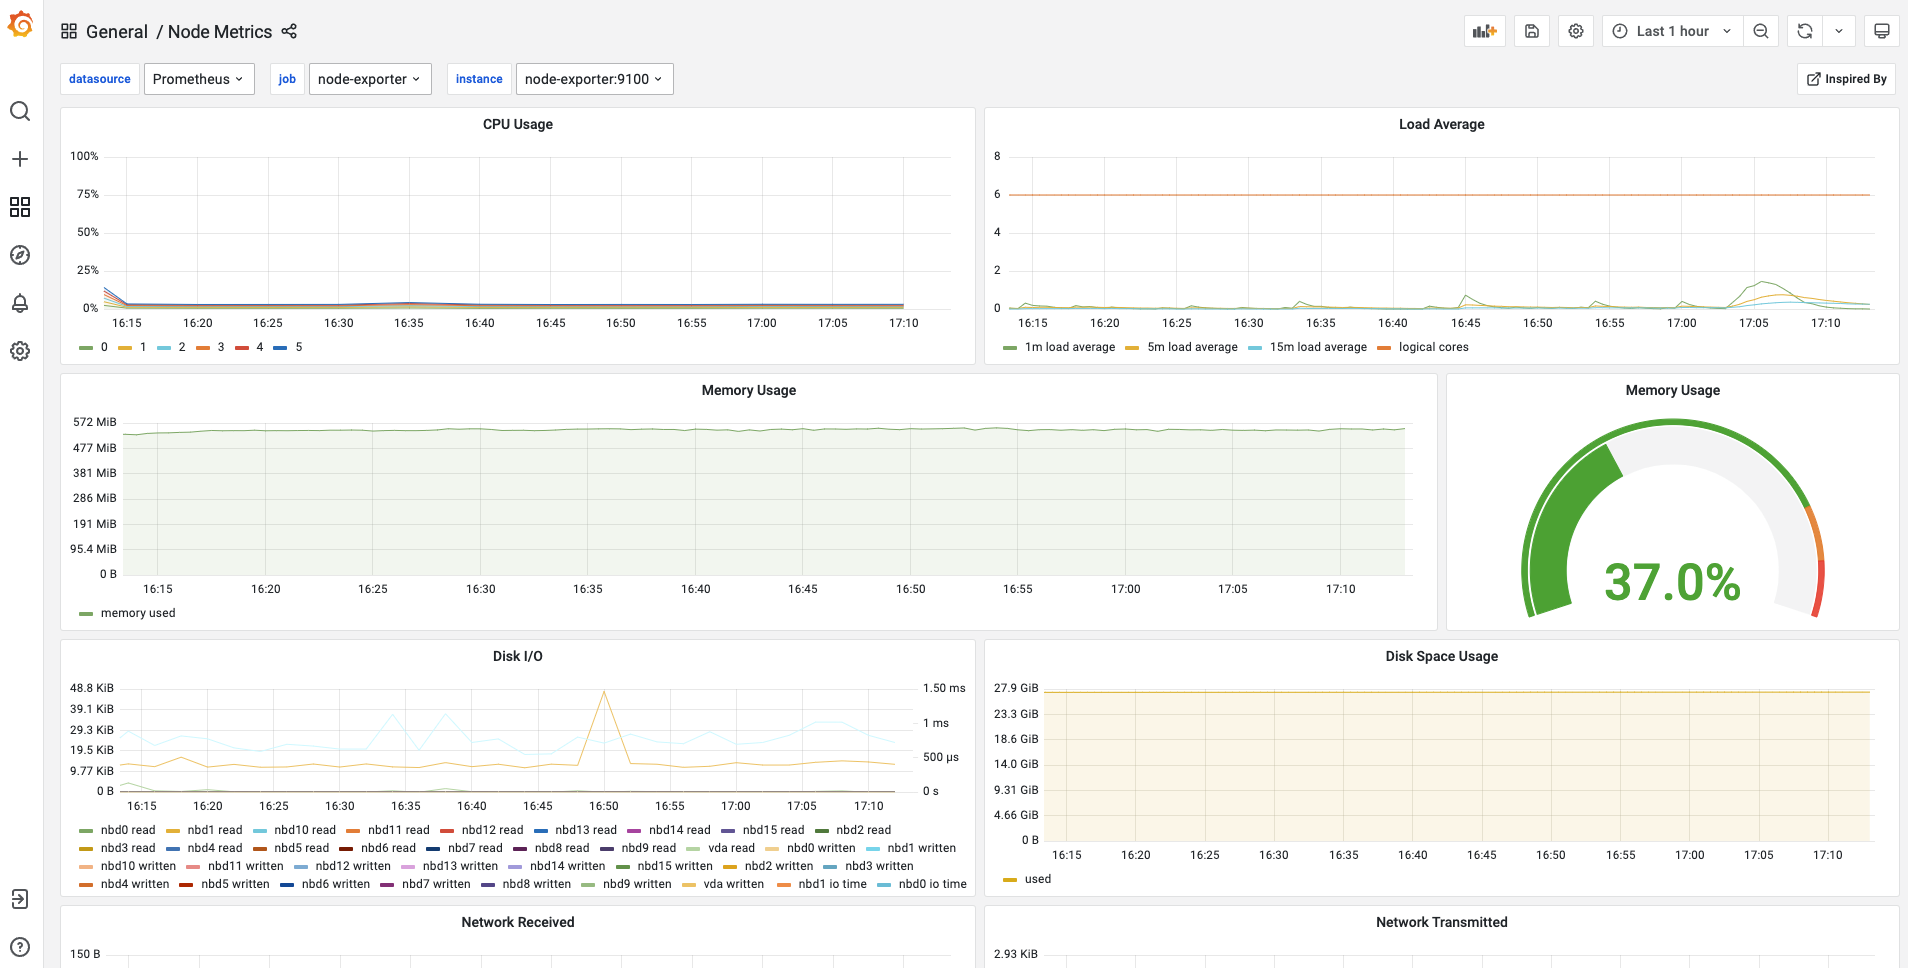
Once you select the nodes dashboard, it should look something like this:
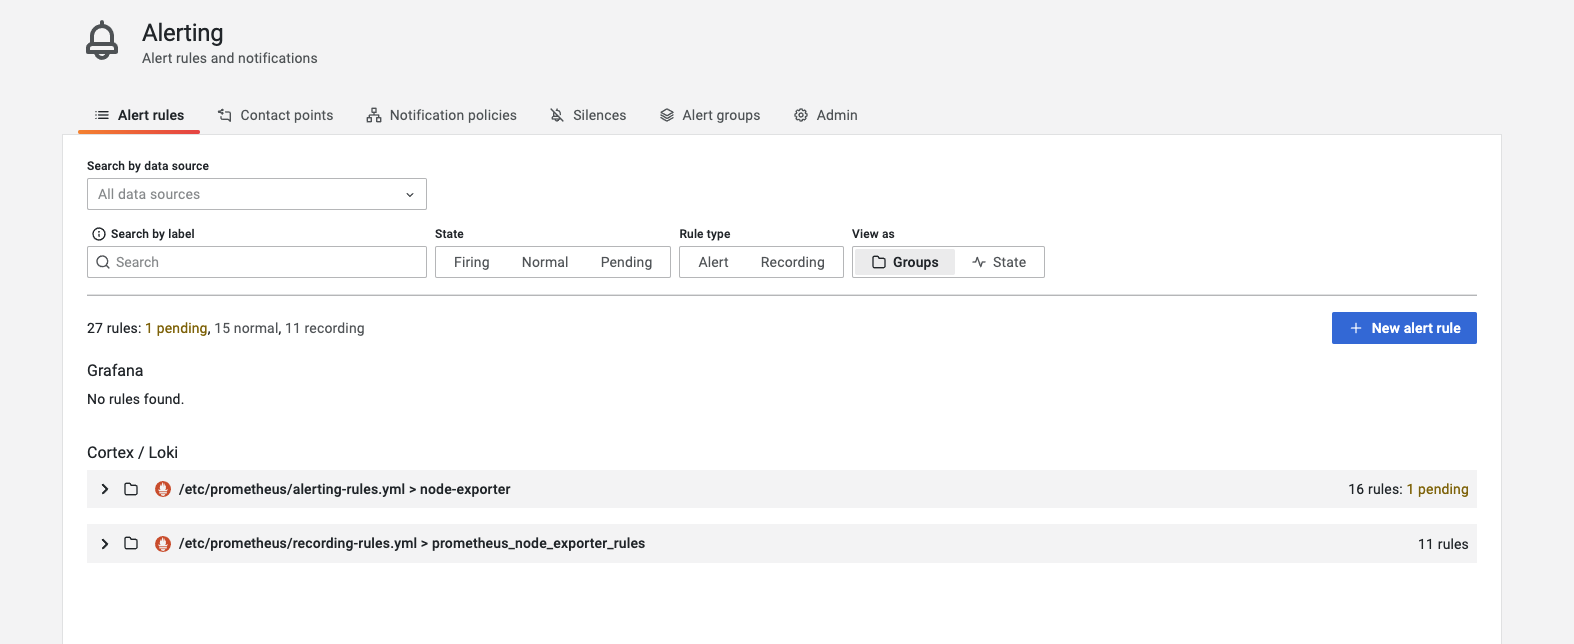
When you select "Alerting" and "Alert rules" you will find the recording and alerting rules:
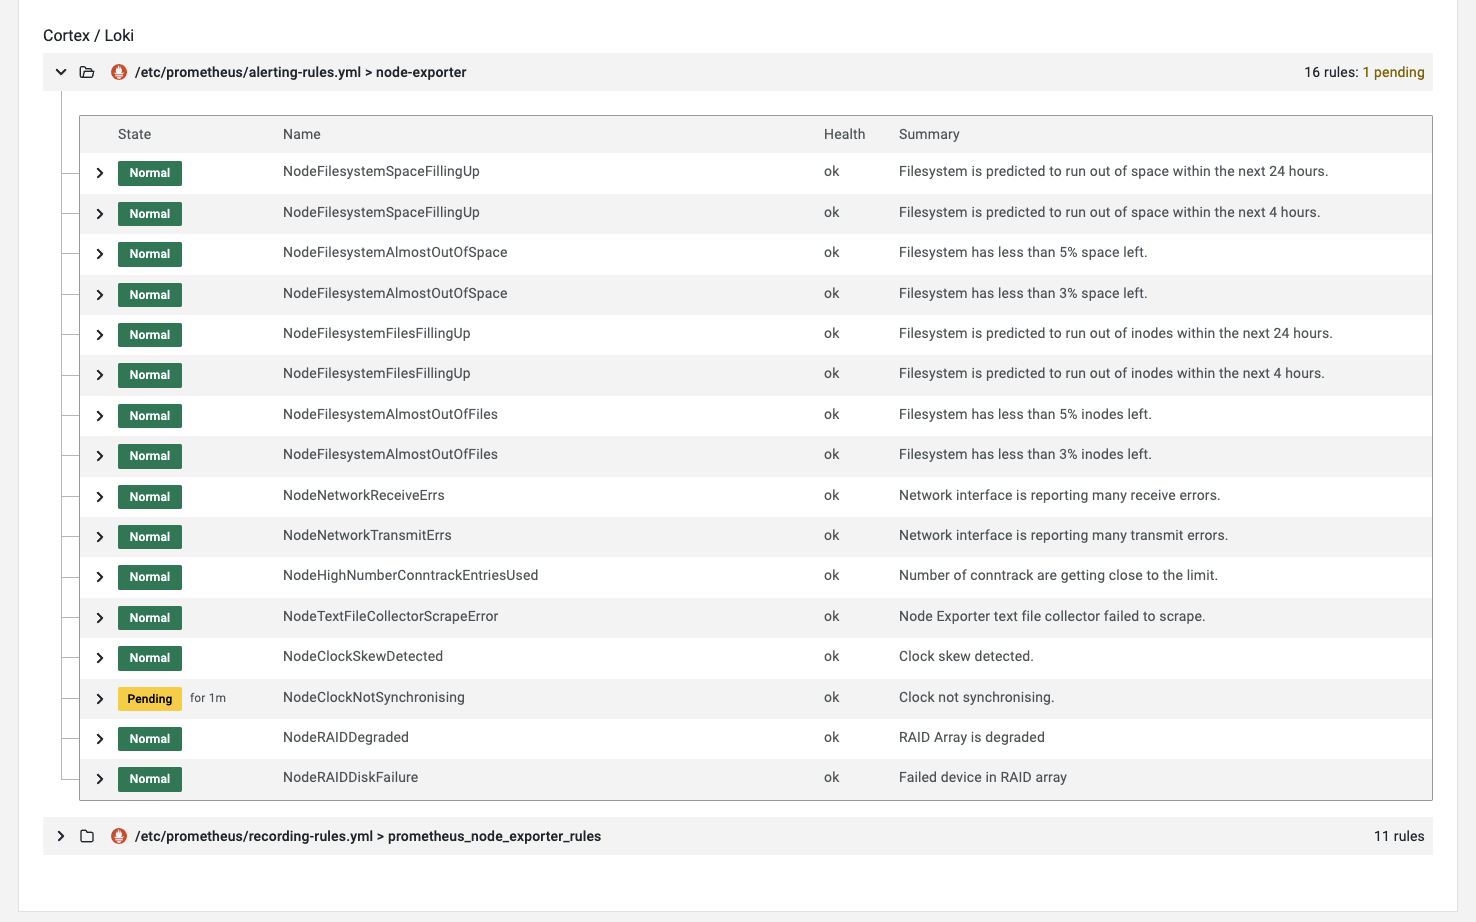
We can expand the alerting rules:
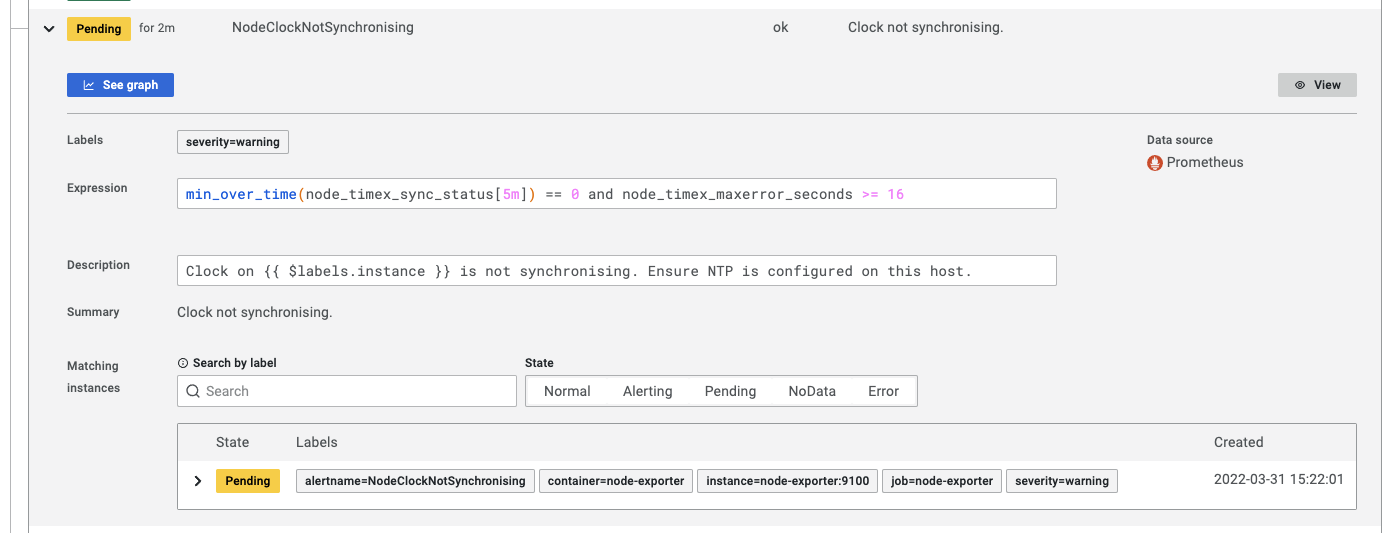
And then we can view more detail on a alert rule:
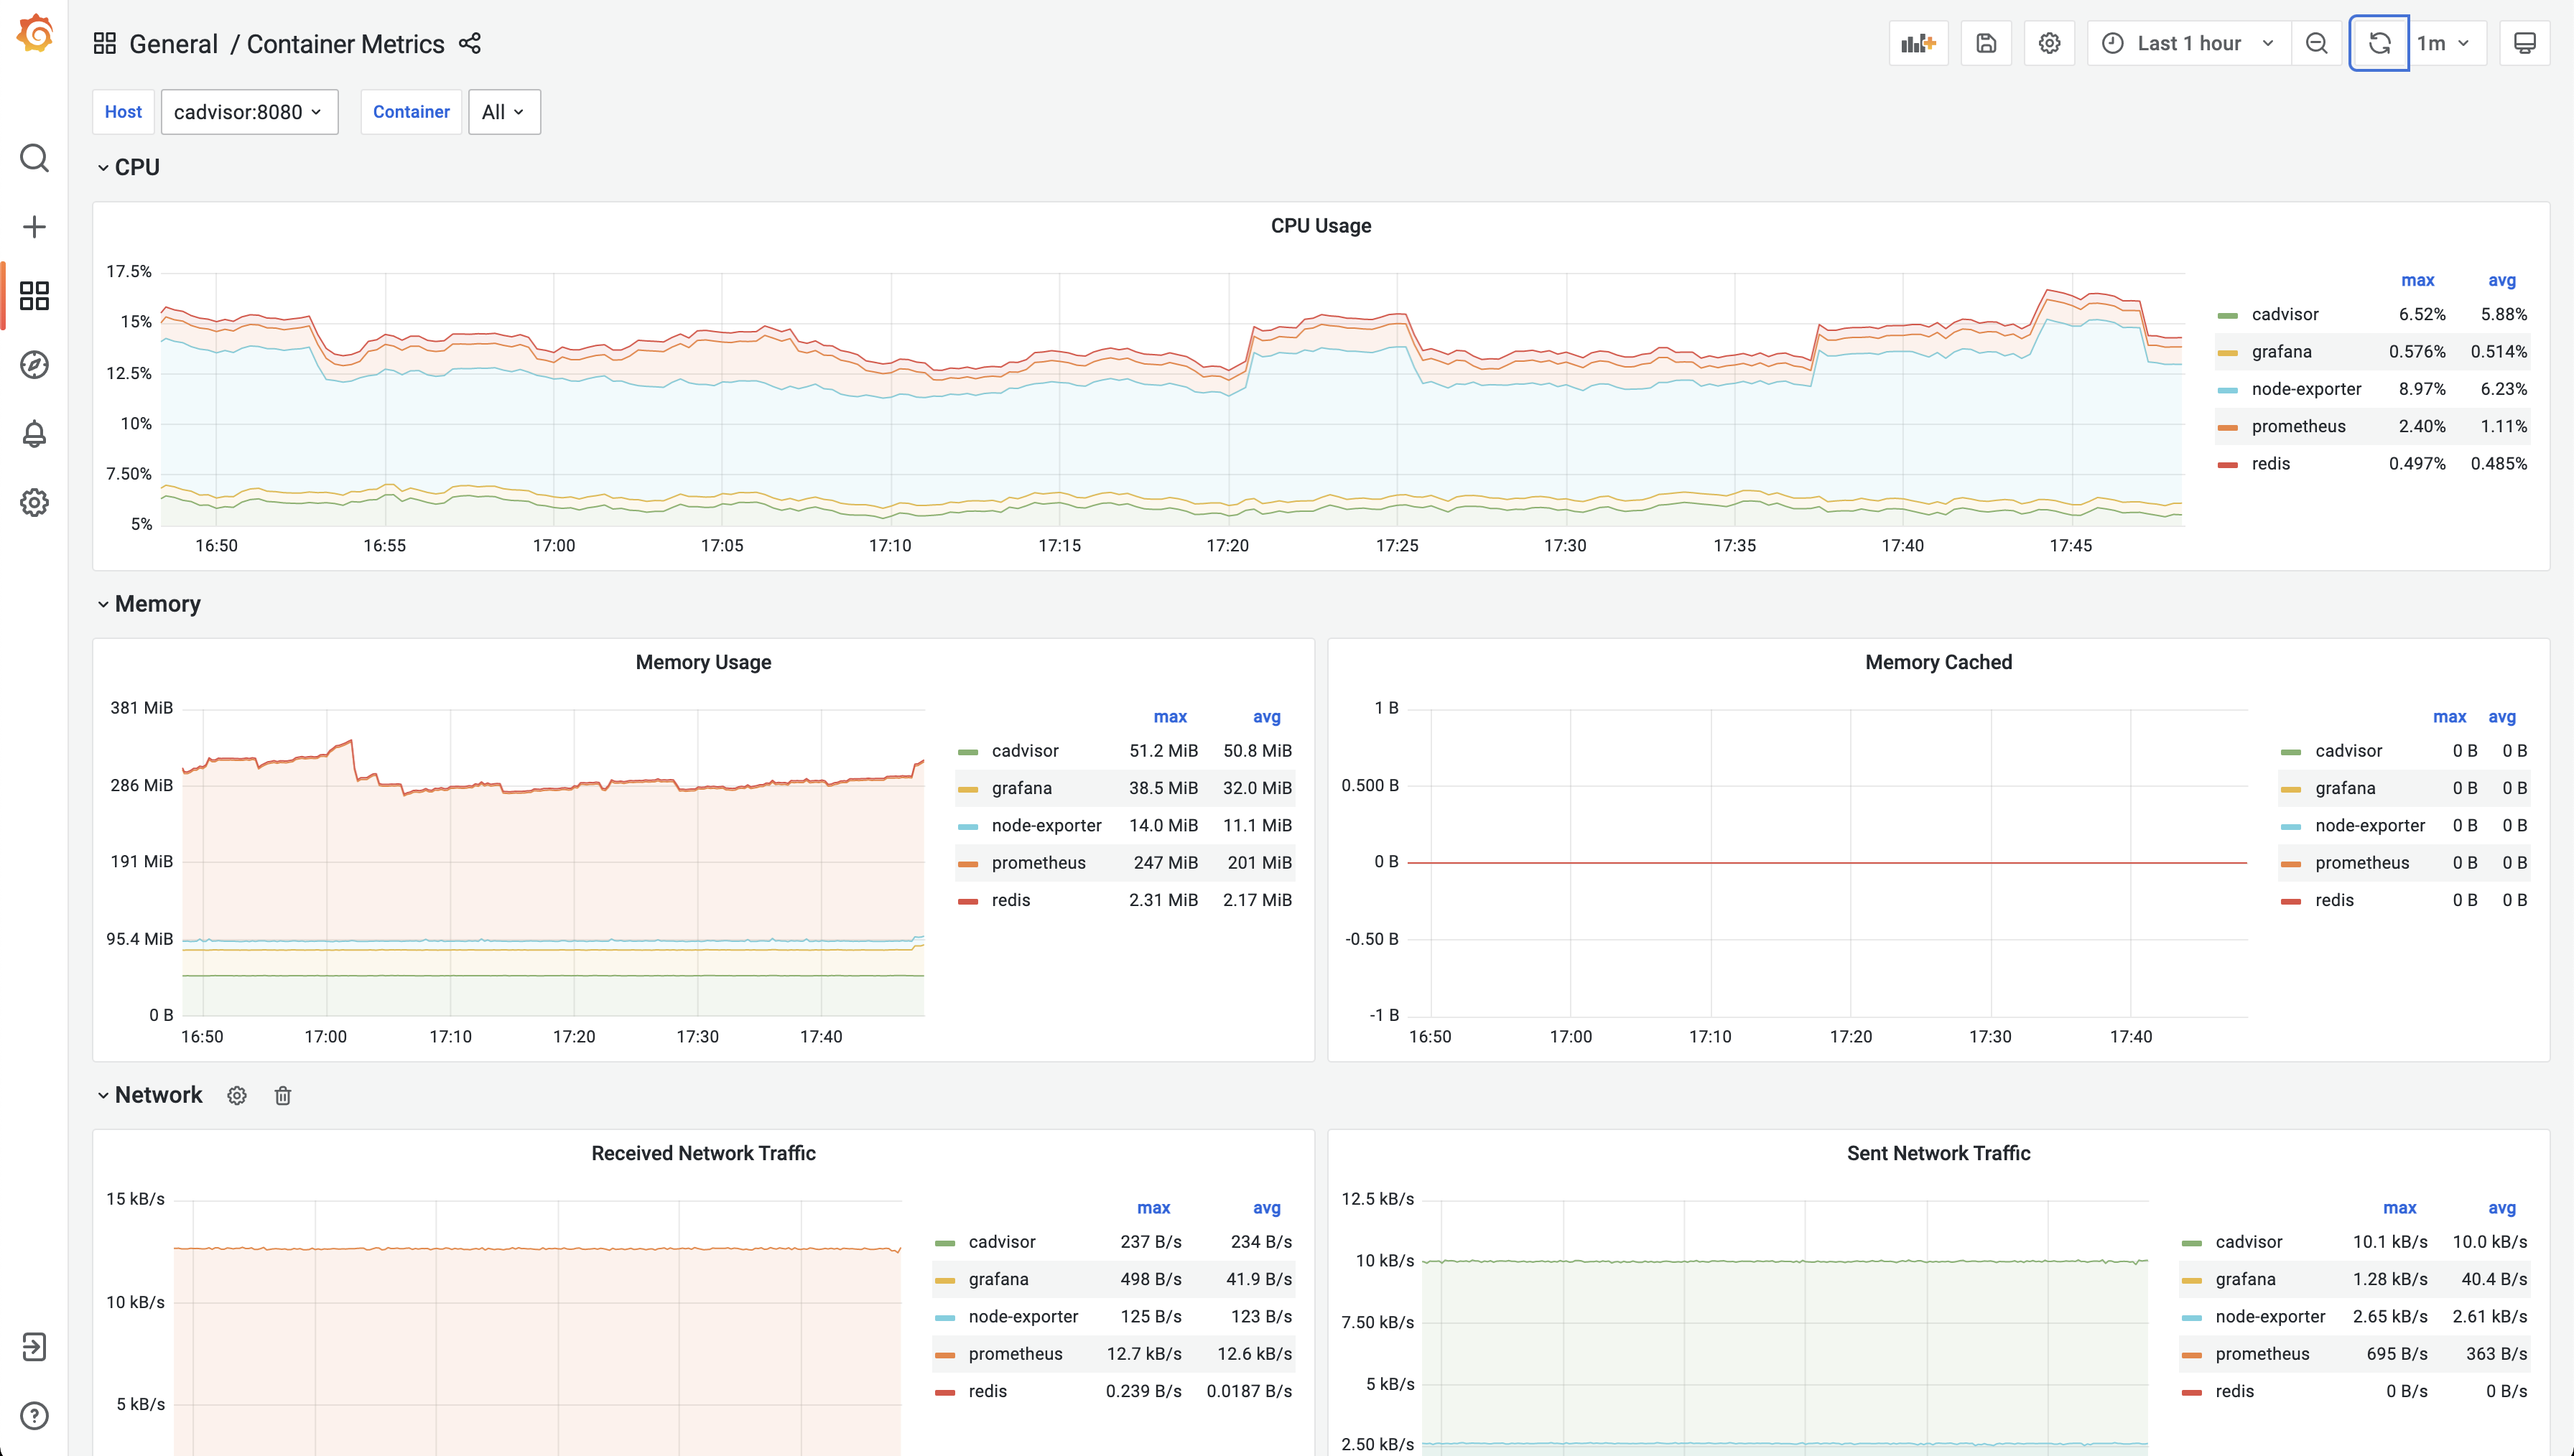
And for our container metrics we can access the Container Metrics dashboard:
The following endpoints are available:
| Container | Internal Endpoint | External Endpoint |
|---|---|---|
| Grafana | http://grafana:3000 | http://localhost:3000 |
| Prometheus | http://prometheus:9090 | http://localhost:9090 |
| Node-Exporter | http://node-exporter:9100 | http://localhost:9100 |
| cAdvisor | http://cadvisor:8080 | N/A |
| Alertmanager | http://alertmanager:9093 | http://localhost:9093 |
To remove the containers using docker compose (or make clean):
docker-compose downHeavily inspired from this exporter guide
