Utility which integrates Perforce (Helix Core) with Prometheus. If performs real-time analysis of p4d log files feeding to a dashboard and for system alerting.
It continuously parses p4d log files and writes a summary to
a specified Prometheus compatible metrics file which can be handled via the node_exporter
textfile collector module.
Uses go-libp4dlog for actual log file parsing.
This is currently a Community Supported Perforce tool.
This is part of a solution consisting of the following components:
- Prometheus - time series metrics management system: https://prometheus.io/
- Grafana - The leading open source software for time series analytics - https://grafana.com/
- node_exporter - Prometheus collector for basic Linux metrics - https://github.com/prometheus/node_exporter
Two custom components:
- p4prometheus - This component.
- monitor_metrics.sh - SDP compatible bash script to generate simple supplementary metrics - monitor_metrics.sh
Check out the 
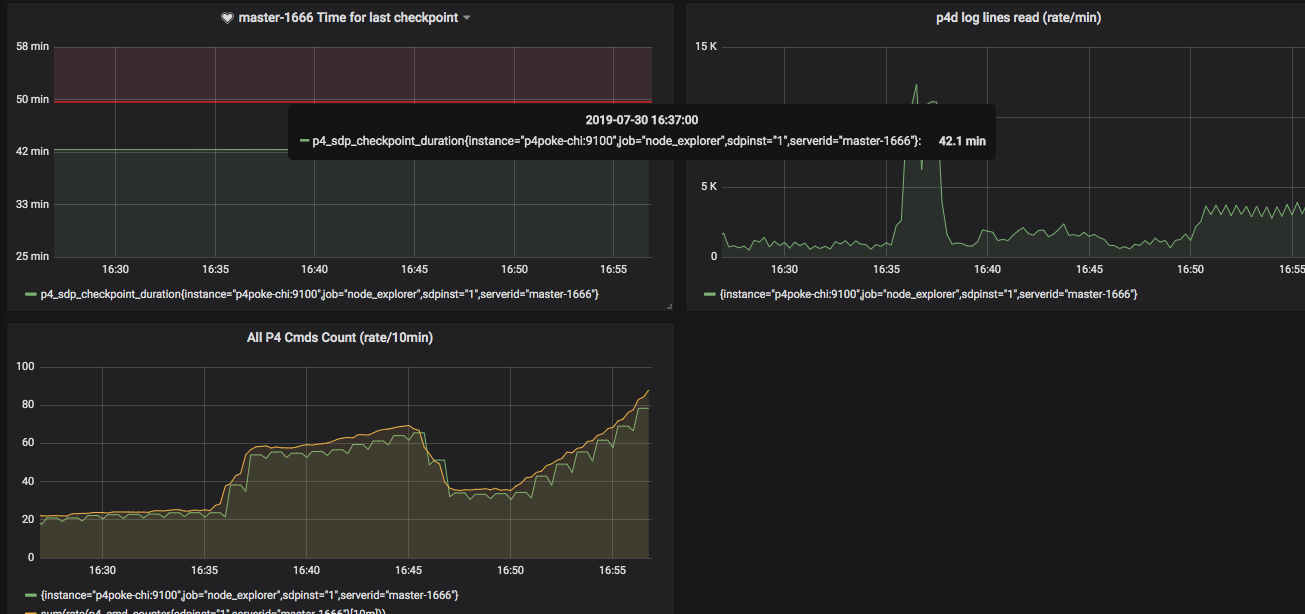
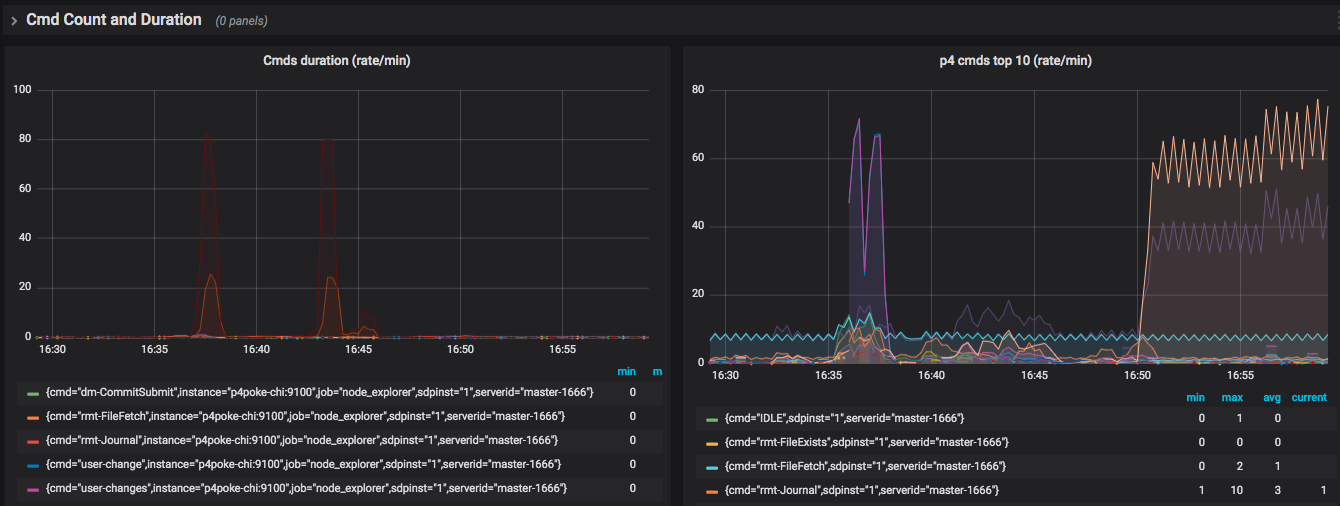
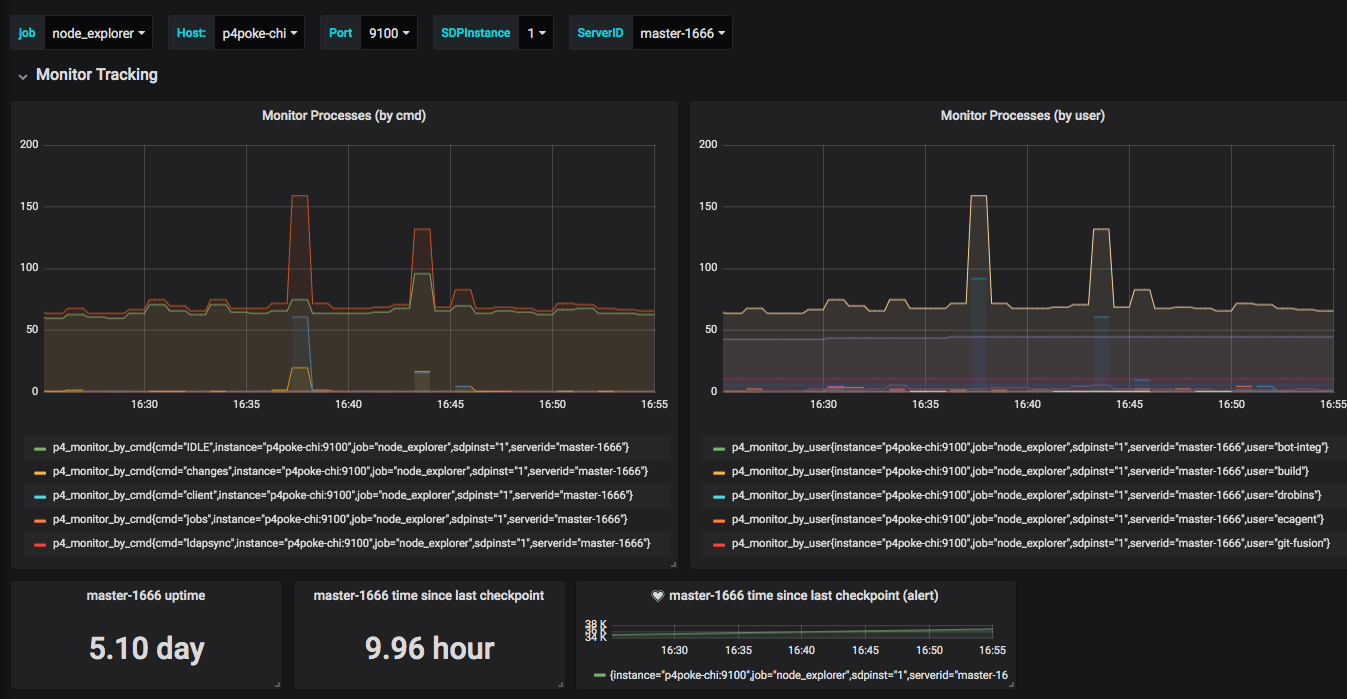
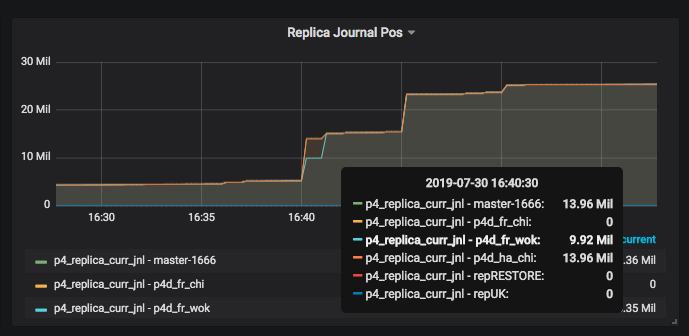
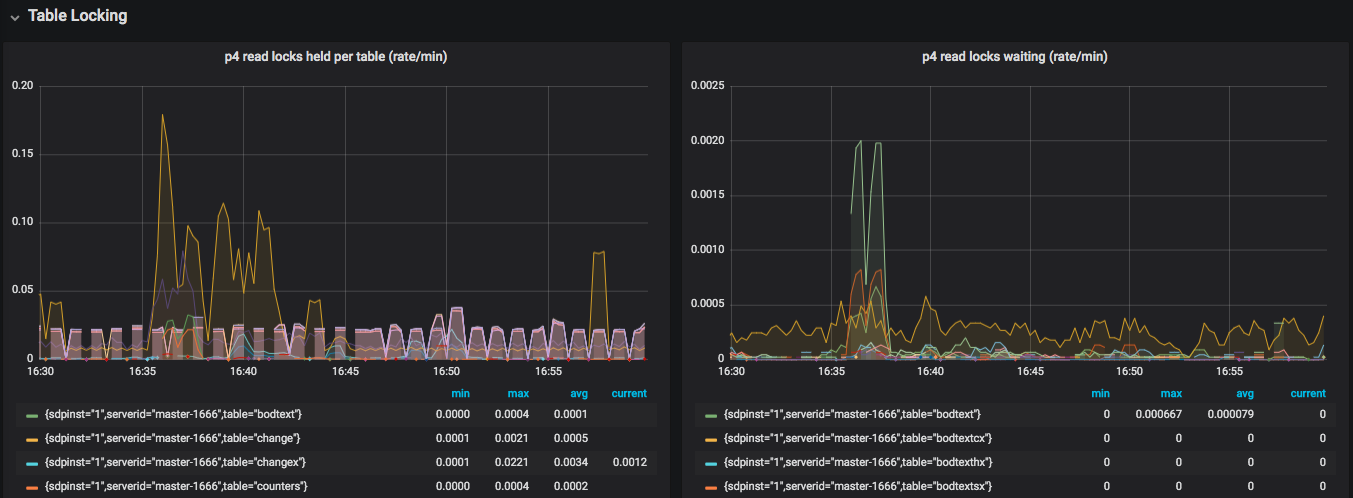
When installed and setup, you can get dashboards such as the following:
Commands Summary:
Rates for command durations and count:
Active commands (monitor):
Replication status:
Read/write locks held/waiting status:
Dashboard alerts can be defined, as well as alert rules which are actioned by alertmanager - see installation below for link to examples.
You need to install Prometheus and Grafana using standard methods. This is typically done on a seperate VM/machine to the Perforce server itself (for security and HA reasons).
The easiest way is to use Ansible with a Galaxy module.
Example files are to be found in the demo folder for this project which is an (as yet incomplete) Docker Compose demonstrator.
Note that all the components do run on Windows but you will need an appropriate Service wrapper.
See Detailed Instatallation Instructions (INSTALL.md) in this project.
