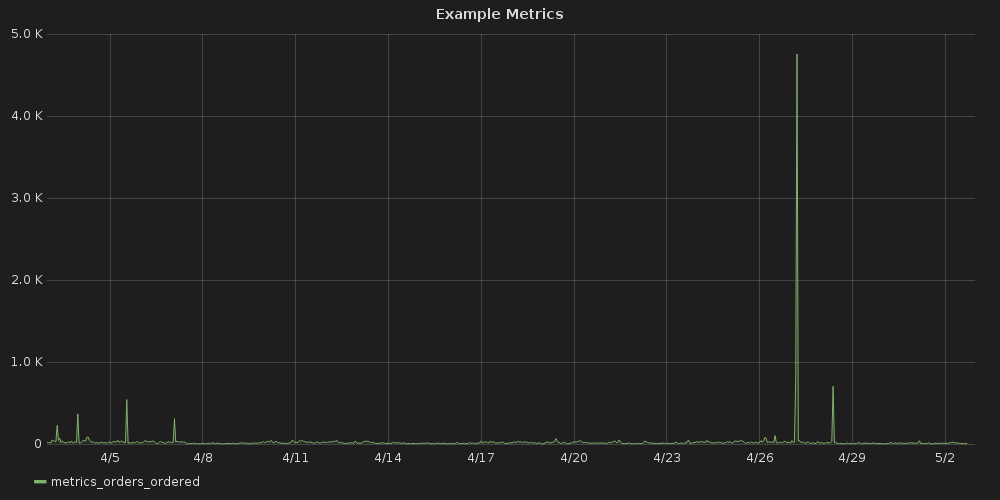
Grafana provides utilities to gain insights into the database, system status, logging, etc.
Start up the backend services:
docker-compose up [--build]Now, users may navigate to the grafana dashboard:
http -a admin:secret POST ":3000/api/datasources" name=chameleon type="grafana-simple-json-datasource" url="http://chameleon:5445/api/" access="proxy" basicAuth:=falseHTTP/1.1 200 OK
Content-Length: 56
Content-Type: application/json; charset=UTF-8
Date: Wed, 03 May 2017 21:40:22 GMT
{
"id": 1,
"message": "Datasource added",
"name": "chameleon"
}- Go to import new dashboard
- Select
Upload .json Fileand navigate to user_metrics.json - Will have to select "chameleon" as the datasource
- Select
Import
- Select
This dashboard comes with templating already configured. If you want to globally change parameters across all panels in a dashboard:
- On the dashboard page, select
⚙ (Manage Dashboard) > TemplatingandNew- Create a "source" template, of
Querytype, connected to the datasource we created- As an example:
templates.metrics.orders_ordered.source - Check the
Include All option[optional]
- As an example:
- Now, change the metric to use the new
$sourcetemplate- Example:
metrics.orders_ordered.source=$source
- Example:
- The dashboard will now have a template control header with dropdowns
- Create a "source" template, of
$ http -a admin:secret POST ":3000/api/admin/users" name=UserP login=UserP password=pass1HTTP/1.1 200 OK
Content-Length: 33
Content-Type: application/json; charset=UTF-8
Date: Wed, 03 May 2017 21:18:34 GMT
{
"id": 3,
"message": "User created"
}
Swagger creates documentation of our internal API automagically 🎉 :
