Did you know the air quality indoors matters as much as the quality of air outdoors? Bad indoor air quality has been linked to debilitating effects, most commonly, lung diseases, stroke, heart disease, and even lung cancer. Not only that, but bad indoor air quality may affect your ability to focus and work. The worst part is, most of these bad things floating around in your room are odorless and invisible to the naked eye.
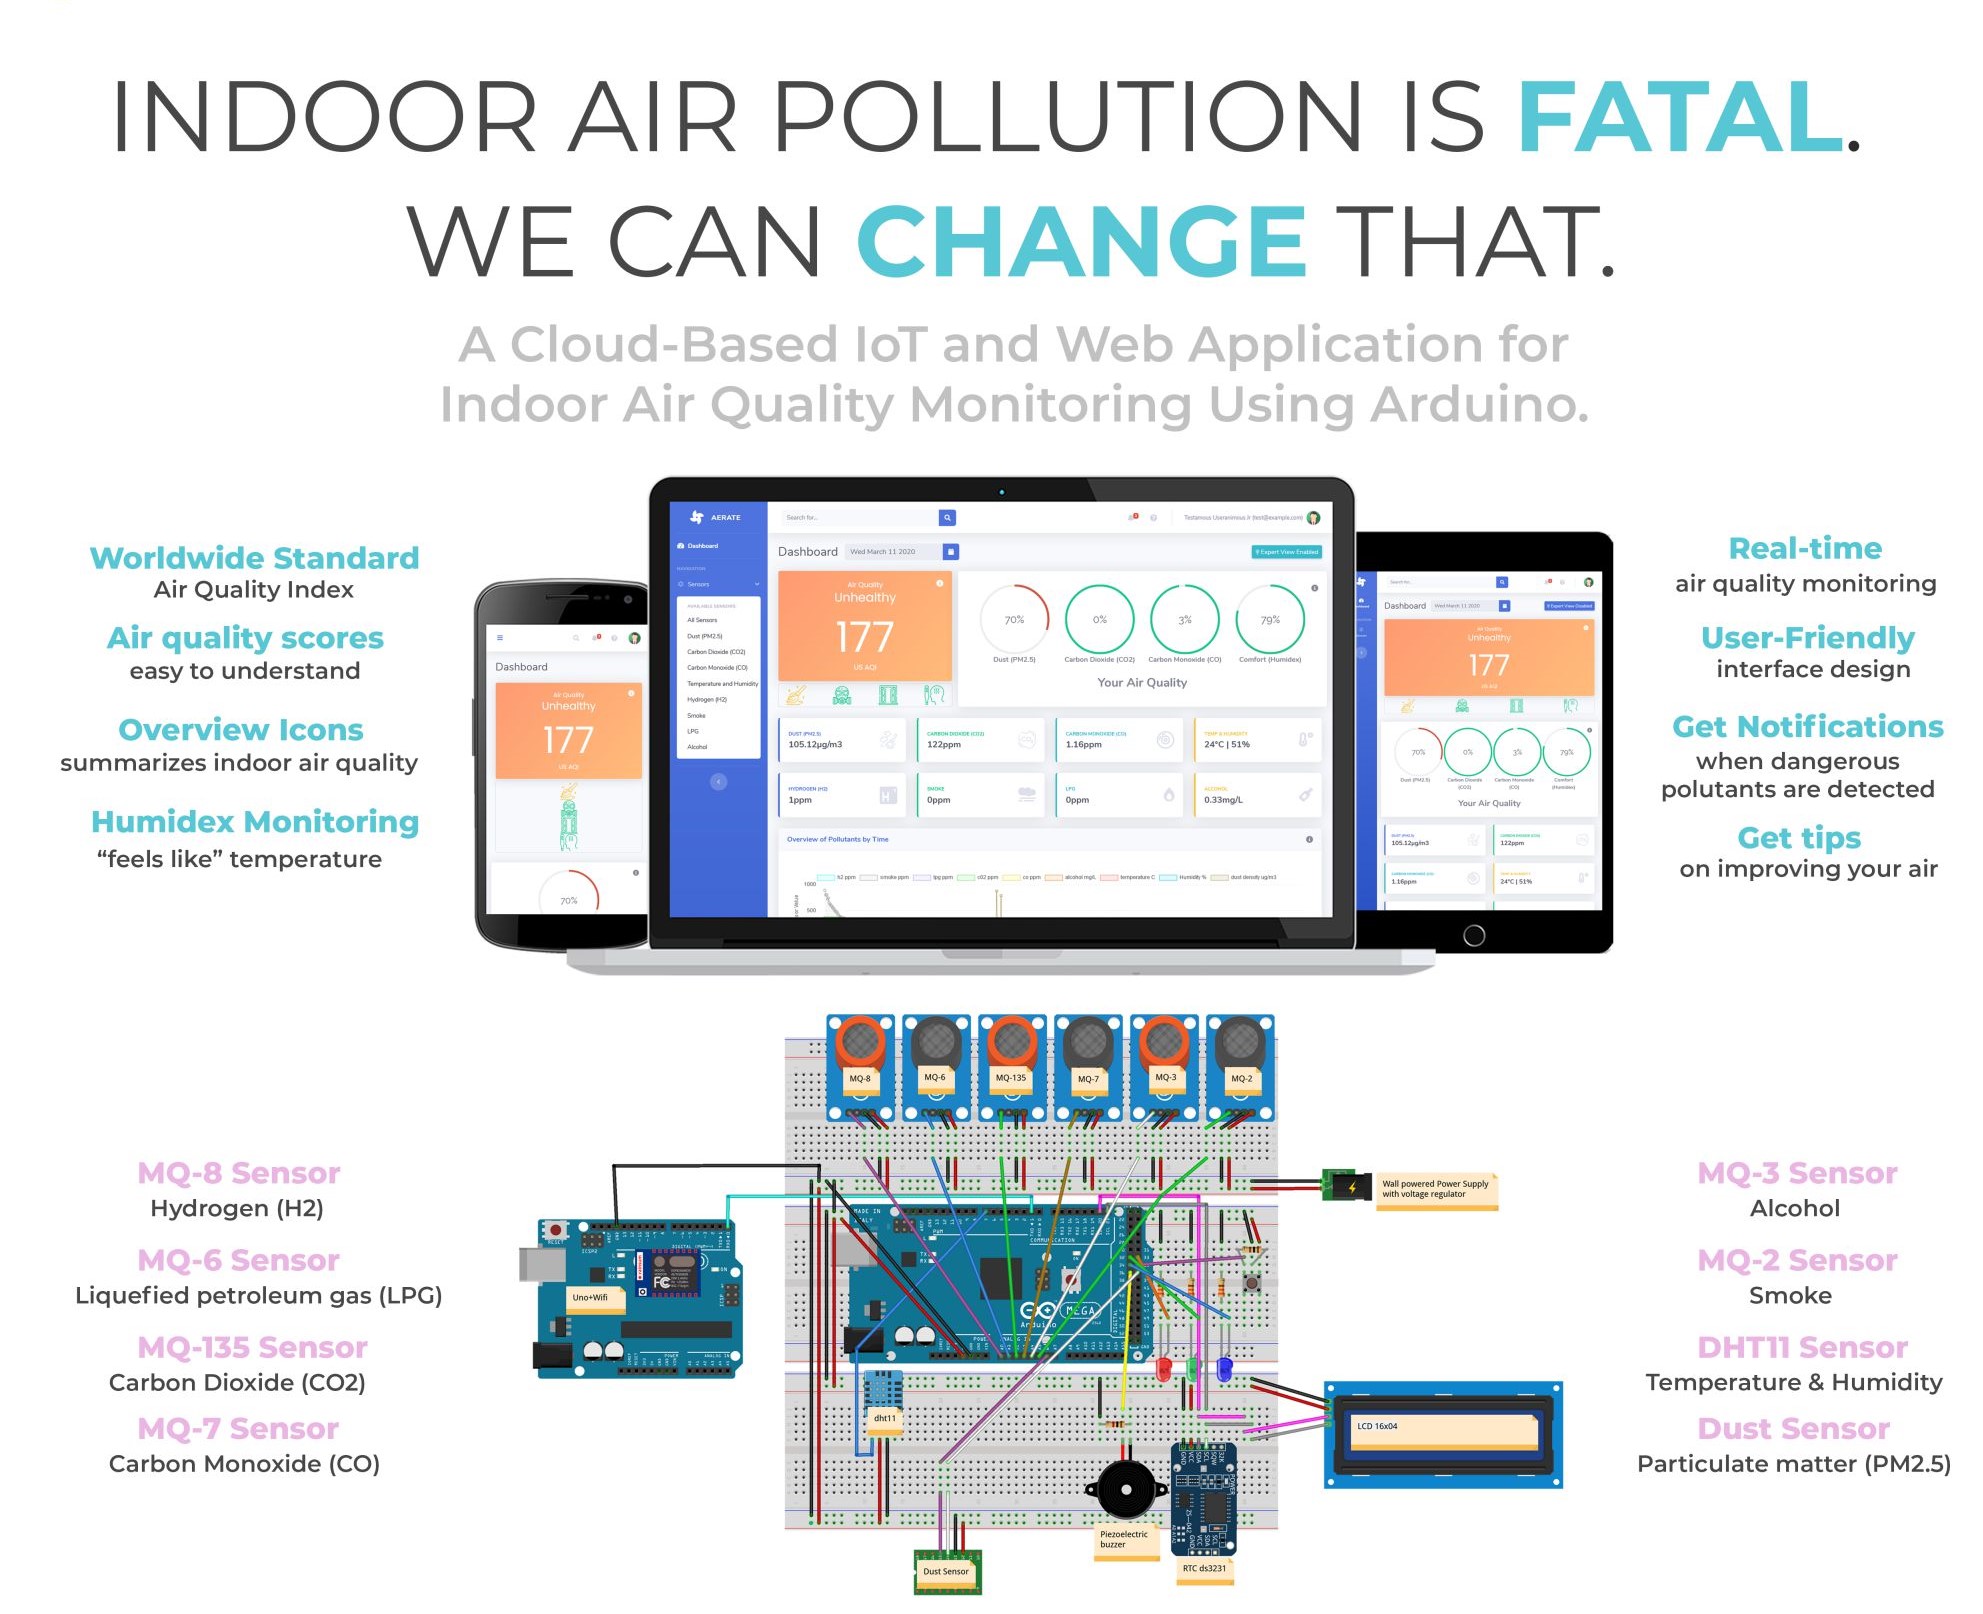
Aerate is a user-friendly cloud-based web application and hardware device that visualizes and informs you of the air quality in your room caused by exposure to dust particles, gasses, chemicals, and more! The application allows monitoring of your room while visualizing it in colorful, user-friendly graphics and even provides tips on increasing air quality! The app also acts as an alarm if a pollutant in your room passes a dangerous threshold. Working using cloud technology, the app works on all your devices and can be used even when you are not at home, keeping your family safe from dangerous air.
Using simple overview icons, US AQI, and air quality scores, aerate allows you to monitor the pollutants in your room and provide improvement tips to increase the air quality in your room.
Did you know that the temperature and humidity inside your room affects your overall comfort level? Aerate can calculate the humidex (what the temperature "feels like" on your skin) and calculate the comfort score to help you shape your room to the upmost optimal conditions.
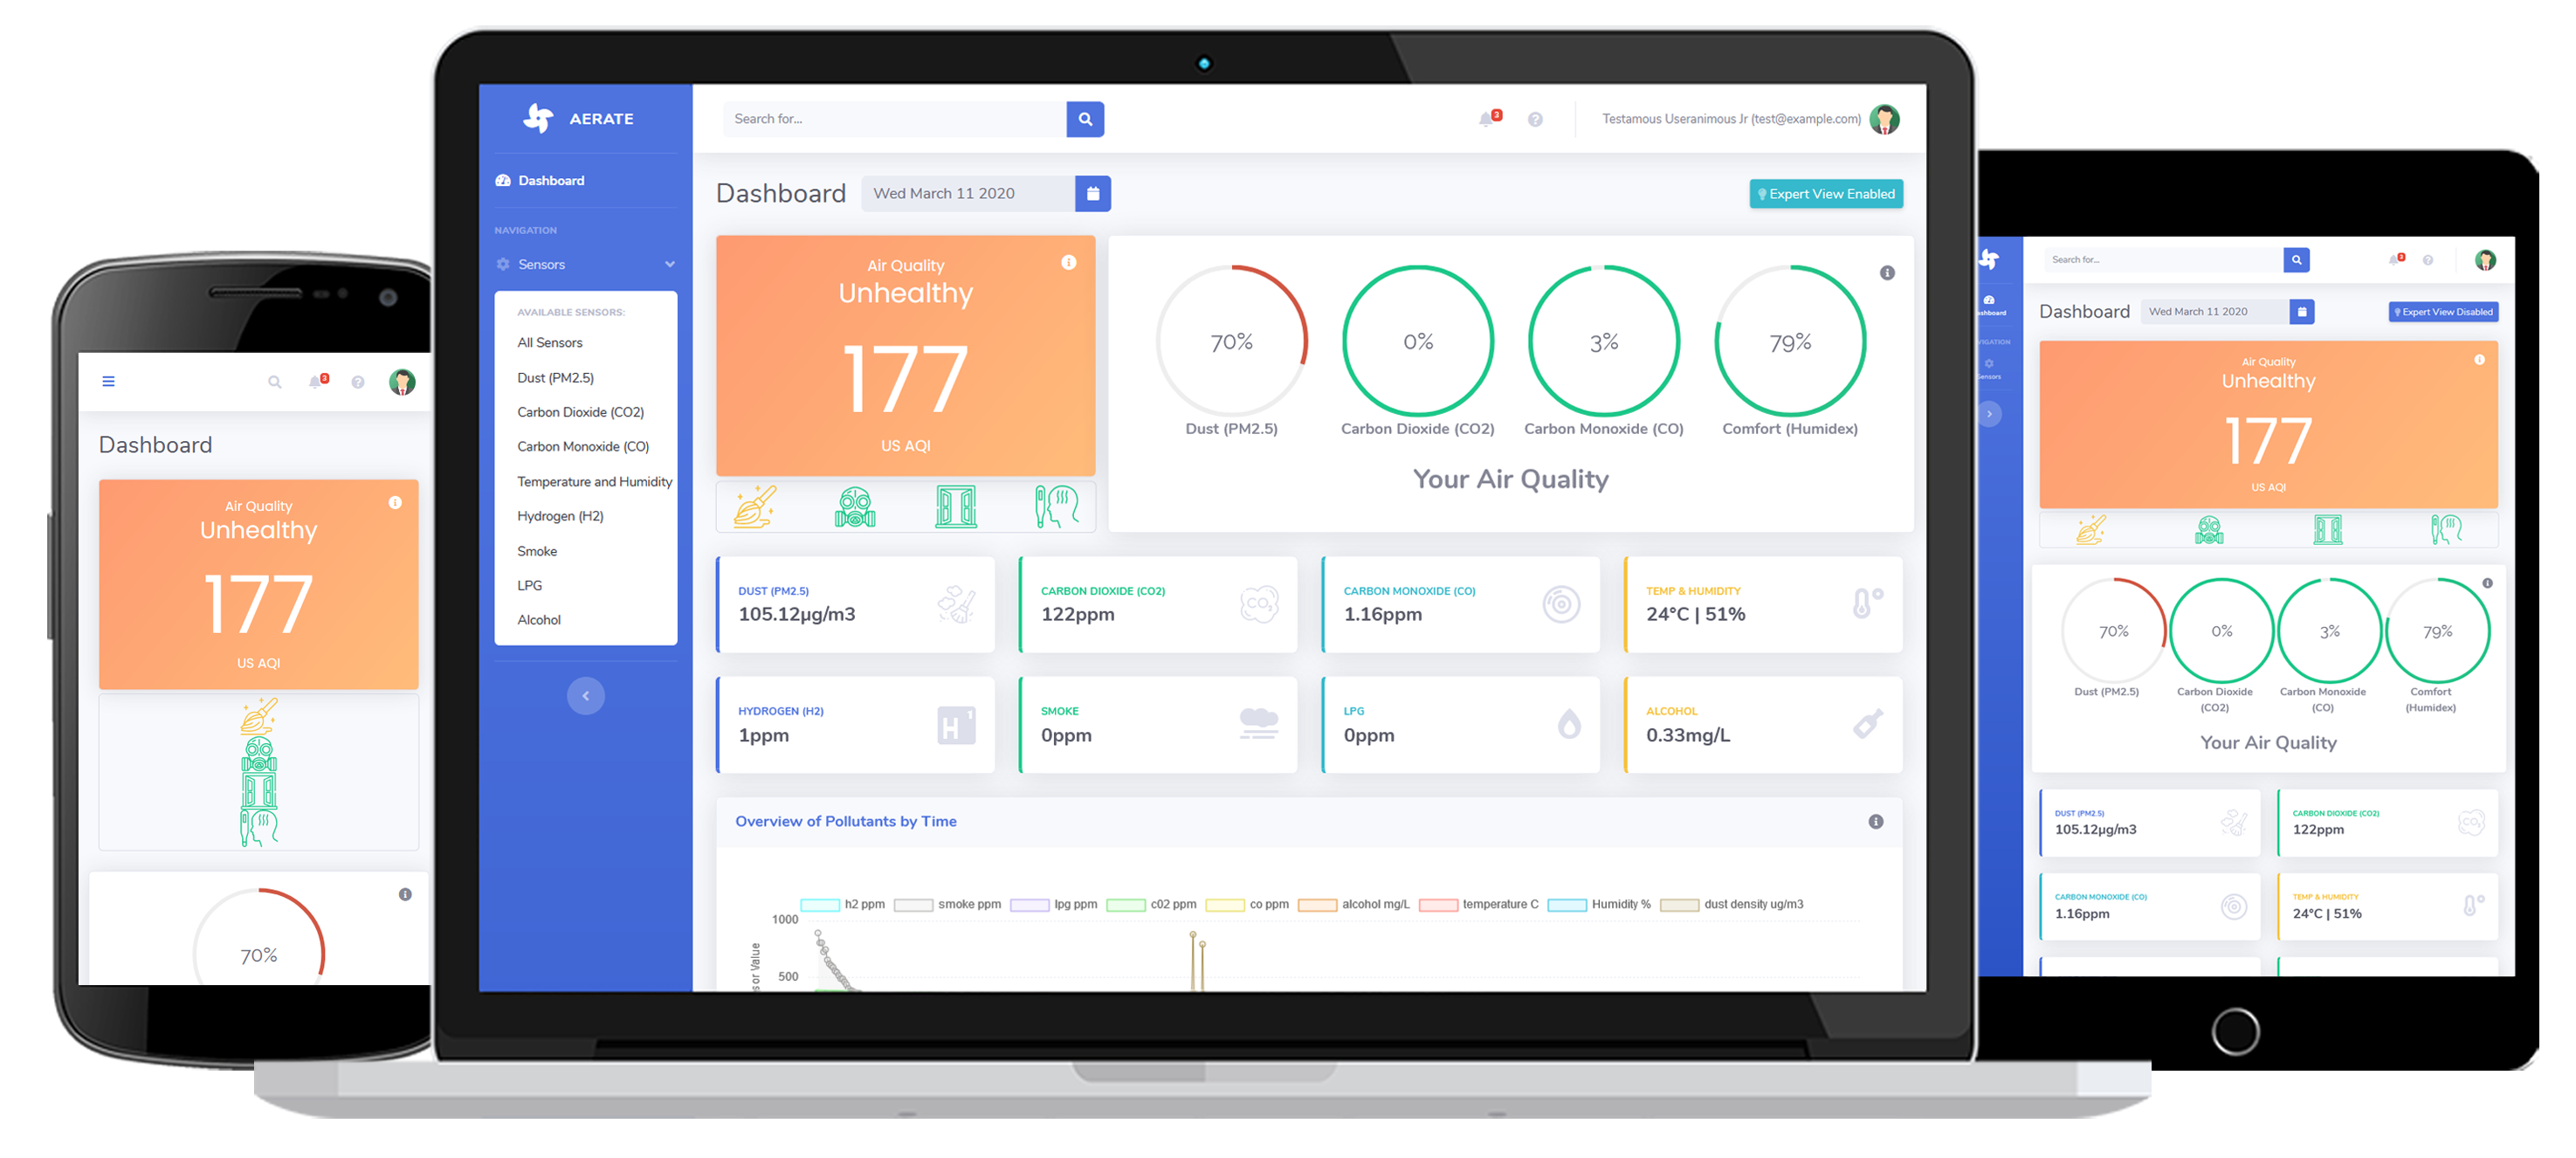
Aerate provides easy to understand graphics for everything! You can view how much your air has improved using the historical data graphs, use gauges just like your car's speed gauge to understand if pollutant levels are currently dangerous or not, view real-time pollutant data color-coded on graphs, and much more!
Designed to be user-friendly, aerate provides two viewing options. The first is "Simple Dashboard" view, where you can view a summary of the vital information about your air quality and get tips on improving it. The second is "Dashboard for Experts," designed for people who want to know in-depth information about the current air quality.
Aerate detects small particles invisible to the naked eye small enough to be breathed into your lungs and absorbed into the bloodstream. Long term research has proven that PM2.5 increases risk of stroke, cancers, heart attack, and birth-defects.
Aerate detects CO2 which is an odourless, colourless gas produced naturally and artificially through human activities. High levels of CO2 is responsible for making crowded rooms feel uncomfortable and even impair the ability to think clearly since CO2 from people's breath can be 2.5 times more than the air outside.
Aerate detects Carbon Monoxide, a poisonous gas that is colorless and odorless that is usually formed from cooking fuels, vehicles, cigarette smoke, and water heaters. Breathing carbon monoxide will cause dizziness, tiredness and confusion, memory loss, and can even be fatal if the dosage is high enough.
Colorless and odorless, flammable gases can quickly spread and fill a room. Inhaling these gases intoxicates you and causes increased blood pressure, increased heart rate, impaired coordination, disorientation, and hallucinations. Aerate detects these gasses and sets an alarm and sends notifications when the gasses are detected.
Constant exposure to smoke is correlated to heart and lung disease. Aerate can detect the compilation of small solids, chemicals, gas particles, and liquids that make up smoke.
Chemicals in experimentations involved may displace oxygen in a room and cause difficulty breathing and gas poisoning. Aerate comes with an alcohol and hydrogen (H2) sensor to detect dangerous levels of these used experimentation materials/byproducts.
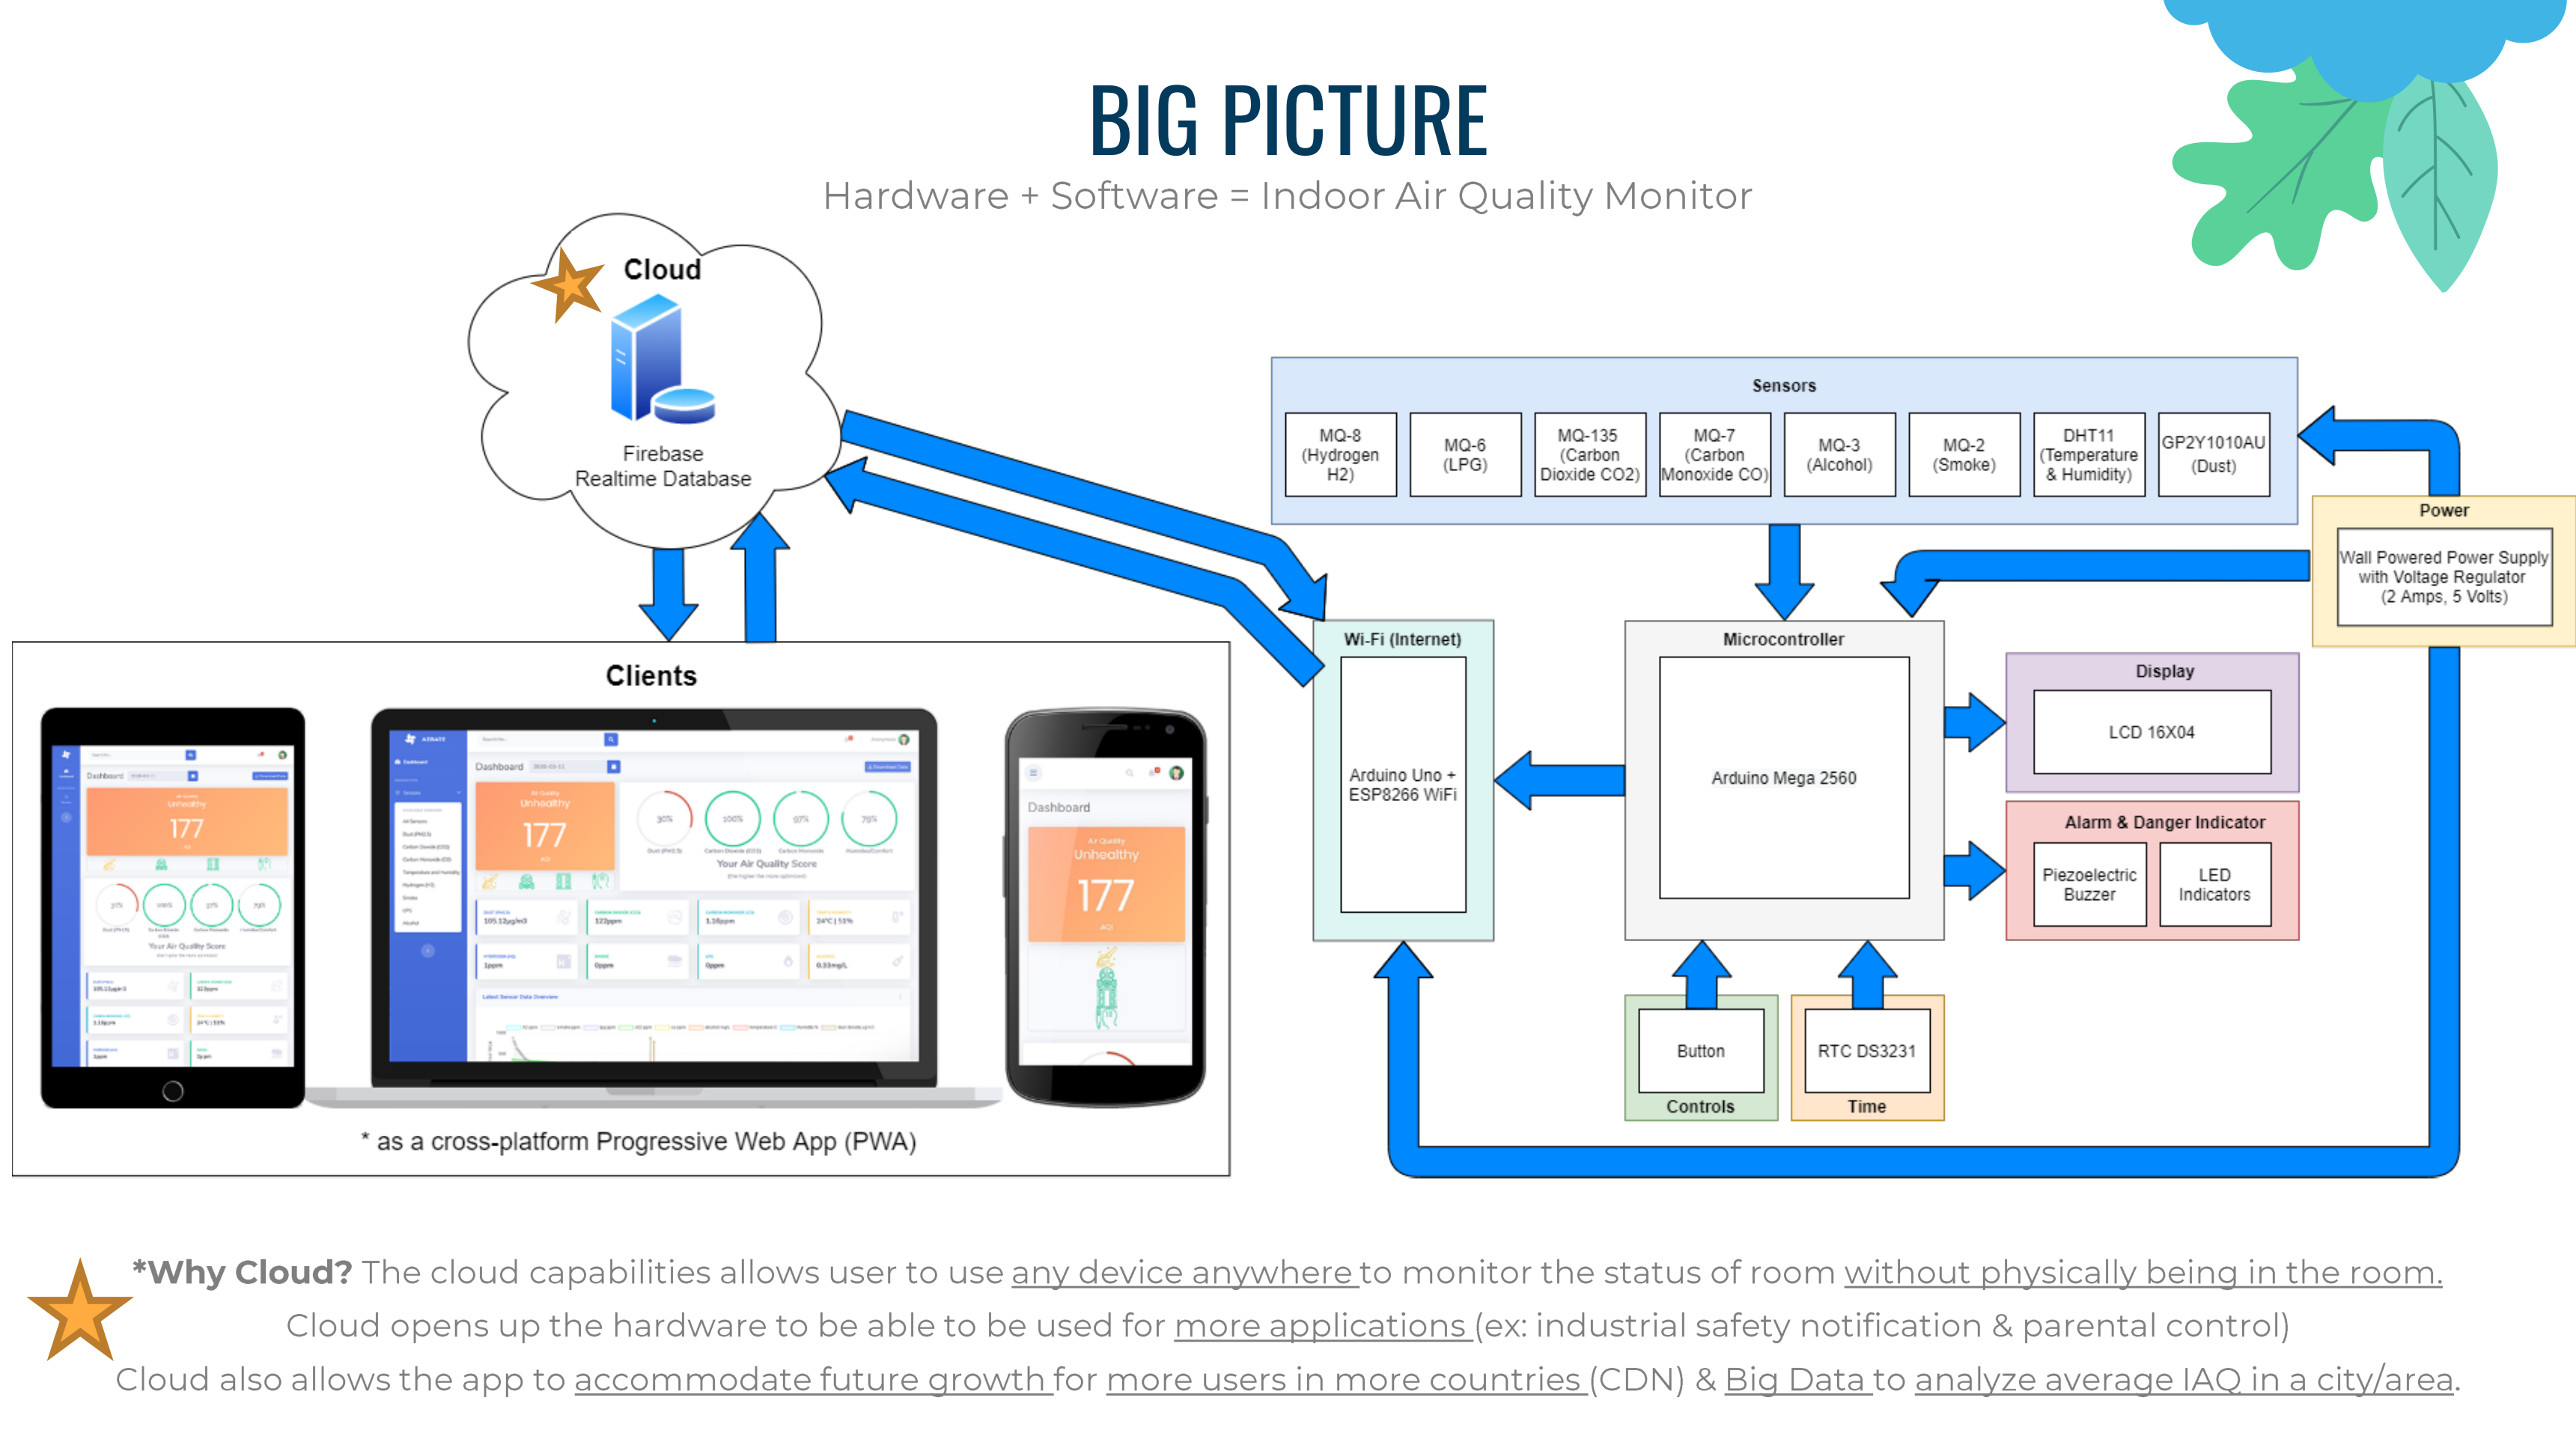
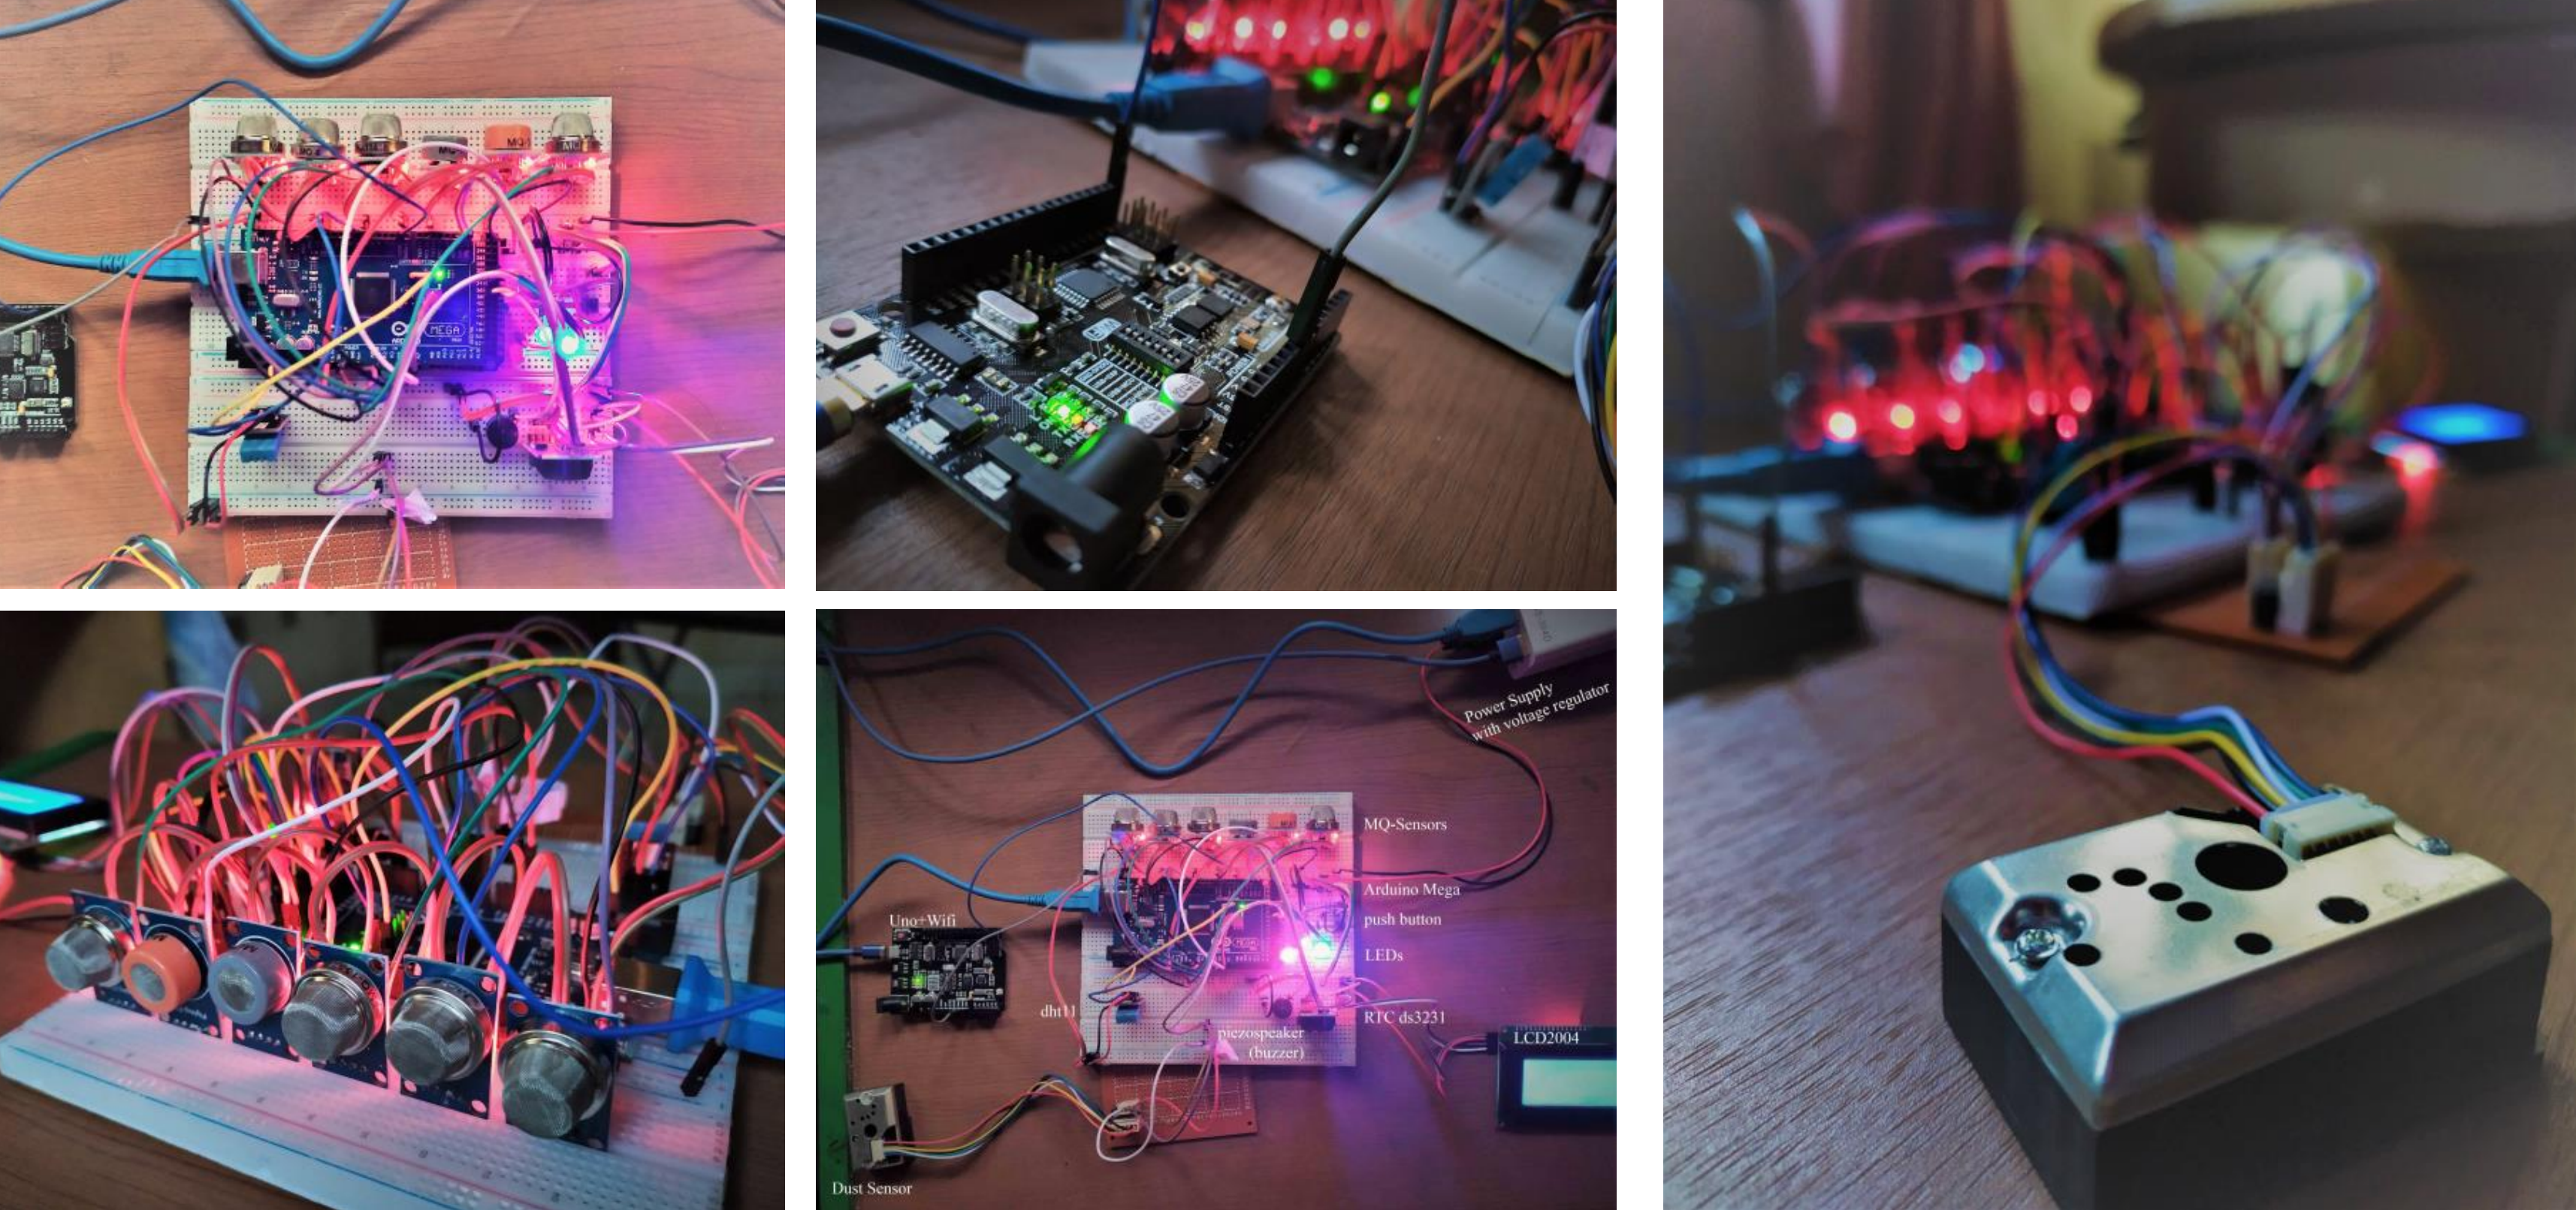
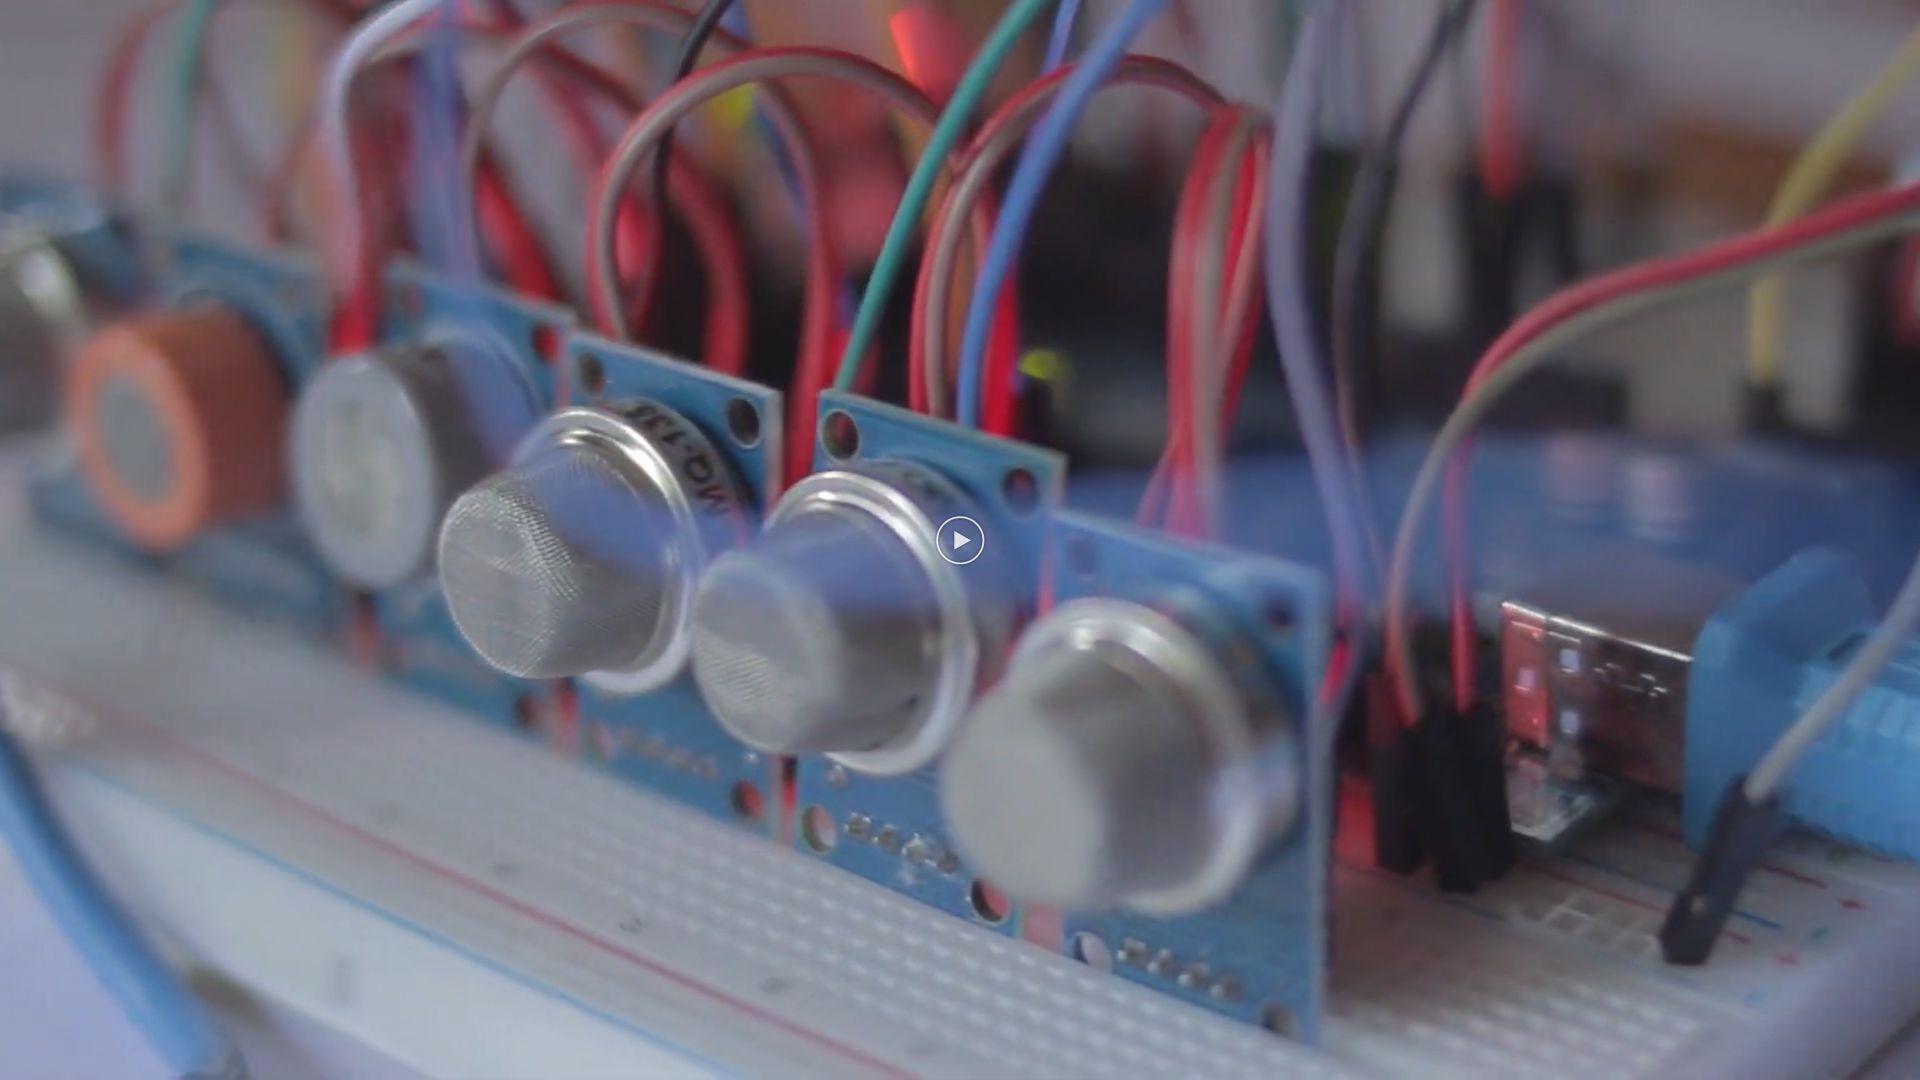
The hardware consists of an Arduino and its IoT modules, essentially small electronic devices such as the sensors, LCD, Wi-Fi chip, and more components. It is responsible for monitoring all sensor data, displaying it on the LCD, and sending the monitored data through a Wi-Fi internet connection towards a firebase cloud database.
| ID | Hardware Features | Status |
|---|---|---|
| REQH1 | Sensors specific to pollutant being monitored (to increase accuracy) | Pass |
| REQH2 | Plug & play automatic configuration and Wi-Fi connectivity | Pass |
| REQH3 | LCD display to view real-time sensor readings | Pass |
| REQH4 | Real time clock to keep track of date and time (timestamp) | Pass |
| REQH5 | Hardware sends sensor readings on a set interval (ex: 30 seconds) to the cloud database through Wi-Fi internet connectivity. | Pass |
| REQH6 | Buzzer beeps (alarm sound) when a pollutant is detected over a safety threshold. | Pass |
| REQH7 | LED flashes when a pollutant is detected over a safety threshold. | Pass |
| REQH8 | Push button to change settings. | Pass |
On the other hand, the software component is a web app. It is responsible for receiving data on the database, processing it with multiple calculations, and then visualizing it to inform the user of the US Air Quality Index, air quality score, pollutant concentration, humidex, and other relevant information.
| ID | Software Features | Category | Status |
|---|---|---|---|
| REQS1 | Software created is a dashboard progressive web application with a main dashboard page containing an overview of all sensors and air quality of the room. | Software Design | Pass |
| REQS2 | Software contains individual pollutant pages that shows each specific pollutant concentration in detail and why the pollutant is dangerous | Software Design | Pass |
| REQS3 | Software is designed with User Friendliness in mind. | Software Design | Pass |
| REQS4 | Supports asynchronous communication (allows for resynchronization of data when internet connection is slow) | Software Design | Pass |
| REQS5 | Real-time US Air Quality Index Calculation | Calculation, Interactive Feature | Pass |
| REQS6 | Real-time air quality score from 0-100% (unsafe: 0%, optimized: 100%) calculation | Calculation, Interactive Feature | Pass |
| REQS7 | Real-time humidex calculation | Calculation, Interactive Feature | Pass |
| REQS8 | Real-time Pollutant concentration viewer | Interactive Feature | Pass |
| REQS9 | Real-time data overview graphs | Interactive Feature | Pass |
| REQS10 | Real-time perceived temperature (Humidex) gauge | Interactive Feature | Pass |
| REQS11 | Historical data graph to view and compare average historical data using the respective truncated means. | Interactive Feature | Pass |
| REQS12 | Dynamically generated data table that shows raw sensor data (raw CSV data sent from the Arduino) | Interactive Feature | Pass |
| REQS13 | Datepicker that allows picking and viewing data specific to the chosen date | Interactive Feature | Pass |
| REQS14 | User Friendly UI with overview icons that changes colors according to the safety levels. | Interactive Feature | Pass |
| REQS15 | Optimization tips are generated and displayed according to the pollutant monitored. | Interactive Feature | Pass |
| REQS16 | Push notifications and alerts for pollutants going over a dangerous threshold | Interactive Feature | Pass |
| REQS17 | Alerts Centre to collect all previous notifications | Interactive Feature | Pass |
| REQS18 | User Login/Logout/Register | Interactive Feature | Pass |
Here is a recorded demo of the aerate in action: https://youtu.be/_0vNESb3Ww8
- On esp.ino, define your own FIREBASE_HOST and FIREBASE_AUTH using your own Firebase credentials (if you don't have one, you need to create one first on firebase.google.com).
- On login.html, register.html, unified.js, and index.html, change the Firebase API Keys to your own.
- aerate was built for my university thesis/dissertation and therefore we will not be liable for any loss or damage of any nature.
- Contact me (James) if you have questions or would like to work with me on developing aerate further.
- Arduino - Arduino
- Wire - Wire
- LiquidCrystal_I2C - LiquidCrystal_I2C
- RTClib - RTClib
- DHT Sensor Library - DHT Sensor Library
- MQSensorsLib - MQSensorsLib
- Sharp Dust Sensor Library - Sharp Dust Sensor Library
- FirebaseESP8266 - FirebaseESP8266
- ESP8266WiFi - ESP8266WiFi
- DNSServer - DNSServer
- ESP8266WebServer - ESP8266WebServer
- WiFiManager - WiFiManager
- JavaScript - JavaScript
- Firebase - Firebase
- Bootstrap - Bootstrap
- SB-Admin2 - SB Admin 2
- JQuery - JQuery + JQueryUI
- IziToast - IziToast
- Raphael.js - Raphael.js
- Chart.js - Chart.js
- Progressbar.js - Progressbar.js
- JustGage - JustGage
- DataTables - DataTables
- PapaParse - PapaParse
- outliers - outliers
- Push.js - Push.js
- UpUp - UpUp
- Intro.js - Intro.js
- js-cookie - js-cookie
- Moment.js - Moment.js
- James Adhitthana - jamesadhitthana
- Hareva, David Habsara (Thesis advisor)
- Murwantara, I Made (Thesis advisor)