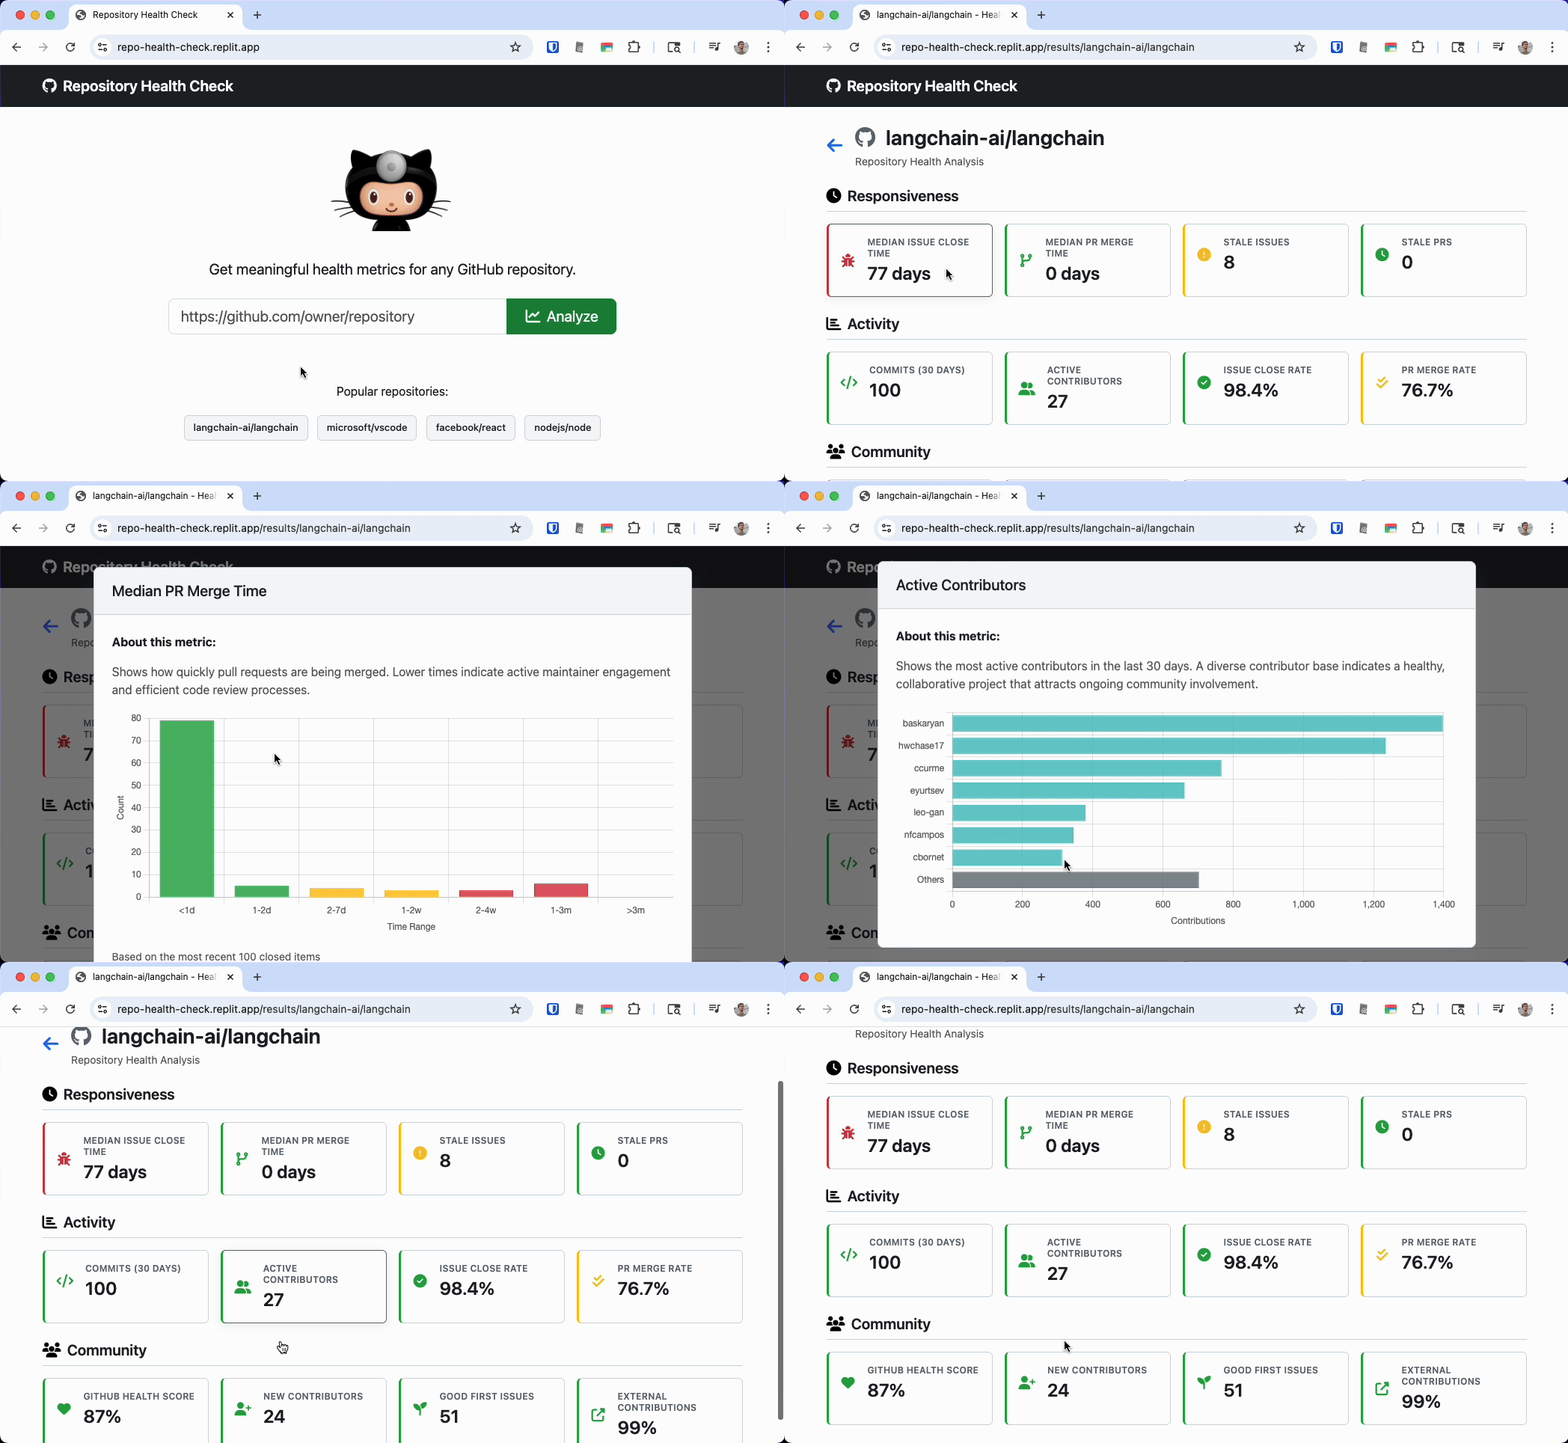
Get meaningful health metrics for any GitHub repository.
This web app takes the URL of a public GitHub repository, and provides relevant and up-to-date data on the GitHub's open source activity and community.
This is useful for maintainers to see where the project can improve, and for users to see if the project is well maintained.
| Responsiveness | Activity | Community Engagement |
|---|---|---|
| Median issue close time Median PR merge time Number of stale issues Number of stale PRs |
Commits in the last 30 days Active contributors Issue close rate PR merge rate |
Health score New contributors Good first issues External contribution percentage |
The core technical components are outlined below:
Backend:
- Flask-based backend
- Integration with the GitHub REST API v3 and the Community Health API
- File-based caching to store GitHub API responses for 24 hours.
Frontend:
- Bootstrap for responsive CSS styling
- Font Awesome for scalable icons
- Chart.js for interactive data visualizations
To use this as a Replit template:
- Remix on Replit: Click the "Remix" button to create your own copy.
- Connect to GitHub: When prompted, sign into your GitHub account to authorize access.
To run this application locally, run the following:
pip install -r requirements.txt
python app.py
I developed this application iteratively using Replit Agent 3, starting with an extensive initial prompt.
Following the initial version, I used series of focused follow-up prompts to make improvements in:
- UX/UI and aesthetics.
- Structural adjustments.
- Information clarity.
- Data visualizations.
- Bug fixes and optimization.
- Refine repository health metrics using real-world repository examples for better accuracy and relevance.
- Provide detailed explanations for each metric's calculation and significance.
- Add additional data visualizations.
