This was a post that I wrote while at the now defunct Apcera, on the getting ELK AKA Elastic Stack up and running on the Apcera platform.
When working with customers we often hear the same question: "How can I view my
logs and data". The answer for this is very easy with the Apcera Platform:
enter Log Drains. Log Drains
allow your applications to send their stdout and stderr log messages directly
to a syslog service such as Splunk or Papertrail with very little effort.
"That is great for production, but is too expensive and time consuming setting
up accounts for individual developers" is what we basically hear next.
One option is the built-in log-tailing utility, apc app logs my-shiny-app.
This is really straightforward, and great in a pinch, but definitely not
something you can use to visualize your output (unless you are really good at
ascii-art graphs).
The ELK Stack to the rescue!
The ELK stack is primarily composed of three products:
- Elasticsearch -- an open source JSON-based search and analytics engine
- Logstash -- an extensible data collection pipeline
- Kibana -- extensible and powerful analytics interface to Elasticsearch
There are others, but we will be focusing on the core of the stack in this post.
When used in concert, the whole of the ELK stack is greater than the sum of its parts. Yes, each piece can be used by itself, but when used together it becomes a powerful tool that gives you access to actionable insights from virtually any form of data, whether it be structured or unstructured.
The goal of this isn't to go in to a great deal of depth with each component of the stack, but rather to show how they can be used in the Apcera Platform. We will show how to create the packages for each layer in the stack, create reference applications for each layer, and tie them together. It is also possible to create one single application that contains each element of the stack (or other combination), but that is not the purpose of this endeavor.
Since version 5.0 of the components of the ELK Stack has come out, I thought it would be good to run through setting up the stack on an Apcera cluster. Having a dev cluster running in a pattern that matches production is very helpful when developing solutions, and prototyping designs. Solutions that can generate a large amount of data - such as IoT applications - greatly benefit from the ability to analyze and visualize data. In this post we are looking at this from a syslog point of view, but there is much more to the ELK stack.
Changing our stack from the 2.x (4.x for Kibana) wasn't overly difficult, the main pain points coming from the transition from x-pack security to the x-pack plugin.
We will be creating Apcera packages to
make reusable pieces for our stack. Near the end of the post you will find a
directory tree so you can see how we stored the pieces in the filesystem. In
this article you will see how to set up the packages of the ELK stack, as well
as how to instantiate a stack for dev use. You only need to create the packages
once for them to be shared across your development team. This post also
demonstrates the use of the Elasticsearch x-pack plugin, but includes tips for
omitting it. If you don't want to follow along you can simply clone the
accompanying github repo (which may be newer than the article) and move at your
own pace. The repo can be found under Apcera's
sample-apps (any path references
in this article will be relative to that sample-appshttps://raw.githubusercontent.com/jamiesmith/apcera-elk-stack/master/readme-images base
to make it easier to follow along).
git clone https://github.com/apcera/sample-apps.git
cd example-elk-stackYou will need a full java-1.8 package, see [java package build] (#installing-java-18). You should also increase the base size of the compiler stager, since pulling in the elasticsearch plugins takes a bit of ram:
apc job update /apcera/stagers::compiler --memory 4gbThe first piece of the puzzle that we will create is a package for
Elasticsearch. Our package will be based on what is the current release at the
time of writing, which is the brand-new elasticsearch version 5.0.0.
Installation is fairly straightforward, only requiring untarring the package,
and, in our case, installing a trial version of the Elasticsearch x-pack plugin.
We will also include build helper script to start elasticsearch.
To build an Apcera package we first need to specify a
package configuration file.
The package configuration file tells the system what to download, what to
upload, and the commands to run to create the package. In our case we will be
downloading the package from elastic.co's website. In the elasticsearch/
directory, our package spec(in our case called elasticsearch-5.0.0.conf) is:
name:      "elasticsearch-5.0.0"
version:   "5.0.0"
namespace: "/apcera/pkg/packages"

sources [
  { url: "https://artifacts.elastic.co/downloads/elasticsearch/elasticsearch-5.0.0.tar.gz",
    sha1: "d25f6547bccec9f0b5ea7583815f96a6f50849e0" },
]

depends  [
	{ os: "ubuntu-14.04" },
	{ runtime: "java-1.8"}
	]

provides [
	{ package: "elasticsearch" },
	{ package: "elasticsearch-5" },
	{ package: "elasticsearch-5.0" },
	{ package: "elasticsearch-5.0.0" }
	]

environment {
	"PATH": "/opt/apcera/elasticsearch/bin:$PATH"
	}

include_files [
	"start-elasticsearch.sh",
	"elasticsearch.yml",
	"roles.yml"
	]

cleanup [ "/root" ]

build (
	mkdir -p /opt/apcera
	tar -C /opt/apcera -xvf elasticsearch-5.0.0.tar.gz
	chmod a+x start-elasticsearch.sh

	cp start-elasticsearch.sh /opt/apcera/elasticsearch-5.0.0/bin/.
	cp elasticsearch.yml /opt/apcera/elasticsearch-5.0.0/config/elasticsearch.yml
	savedir=$(pwd)

	echo "Installing x-pack"

	cd /opt/apcera/elasticsearch-5.0.0

	# Note that by running this you are accepting the apache2 license
	# terms of x-pack
	#
	echo "Y" | ./bin/elasticsearch-plugin install x-pack

	cp ${savedir}/roles.yml /opt/apcera/elasticsearch-5.0.0/config/x-pack/roles.yml

	chown -R runner:runner /opt/apcera/elasticsearch-5.0.0
	cd /opt/apcera
	ln -s elasticsearch-5.0.0 elasticsearch
)
Which also installs a trial license for x-pack, which provides several added features, such as alerting, monitoring, reporting, data graphs, and the part we will be using in the post, security.
The sources section tells the package creation process to download the
elasticsearch archive and validate its secure hash. Once that is done it
follows through the build section. It makes a directory and untars the
archive to that directory. Next, it makes sure that the execute bit of the
start script is set, then copies it to the bin directory underneath our new
elasticsearch tree. It then uses the elasticsearch plugin utility to install
the x-pack plugin. Note that the echo "y" in the script is accepting the
trial license. Finally, it changes the ownership of the whole tree to runner,
a predefined user, and sets up a soft link to make the paths nicer.
The environment section adds /opt/apcera/elasticsearch/bin to the path.
When this package is included in a container, the environment will be updated
to include this.
If you don't want to include x-pack, simply omit the two plugin install lines.
To simplfy starting elasticsearch, we create a helper script
(elasticsearch/start-elasticsearch.sh) which looks like:
 #!/bin/sh

 HTTP_PORT=${PORT:-9200}

 myip=$(ifconfig | grep 169.| sed "s|:| |g" | awk '{print $3}')

 elasticsearch -E http.port=${HTTP_PORT} -E network.host=$myip $@
Note the pattern for the port: HTTP_PORT=${PORT:-9200}. If the environment
variable PORT is not set (for example, if an application were deployed with
the --disable-routes flag) then it will fall back to using 9200. We also
want to make sure that we store the data under the application directory, so
we specify path information. We are also finding the ephemeral IP address
of this job instance to use as the network host IP.
We are including additional files, as mentioned in the package build specification:
(...)
include_files [
	"start-elasticsearch.sh",
	"elasticsearch.yml",
	"roles.yml"
	]
(...)
We have already looked at the first one- the second two are to set up some elasticsearch specifics for our environment.
elasticsearch/elasticsearch.yml sets gives us the ability to define users
from the command line, prior to starting elasticsearch:
xpack:
  security:
    authc:
      realms:
        file1:
          type: file
          order: 0
while elasticsearch/roles.yml gives us a role specifically set up with the
permissions for the logstash app that we will be setting up later, with some
CRUD permissions on its own indices, as well as some cluster permissions:
logstash_writer:
  cluster: [ 'monitor', 'manage_index_templates' ]
  indices:
    - names: [ 'logstash-*' ]
      privileges: [ 'read', 'write', 'create_index' ]
Creating the package from this manifest is pretty simple:
cd elasticsearch/
apc package build elasticsearch-5.0.0.conf
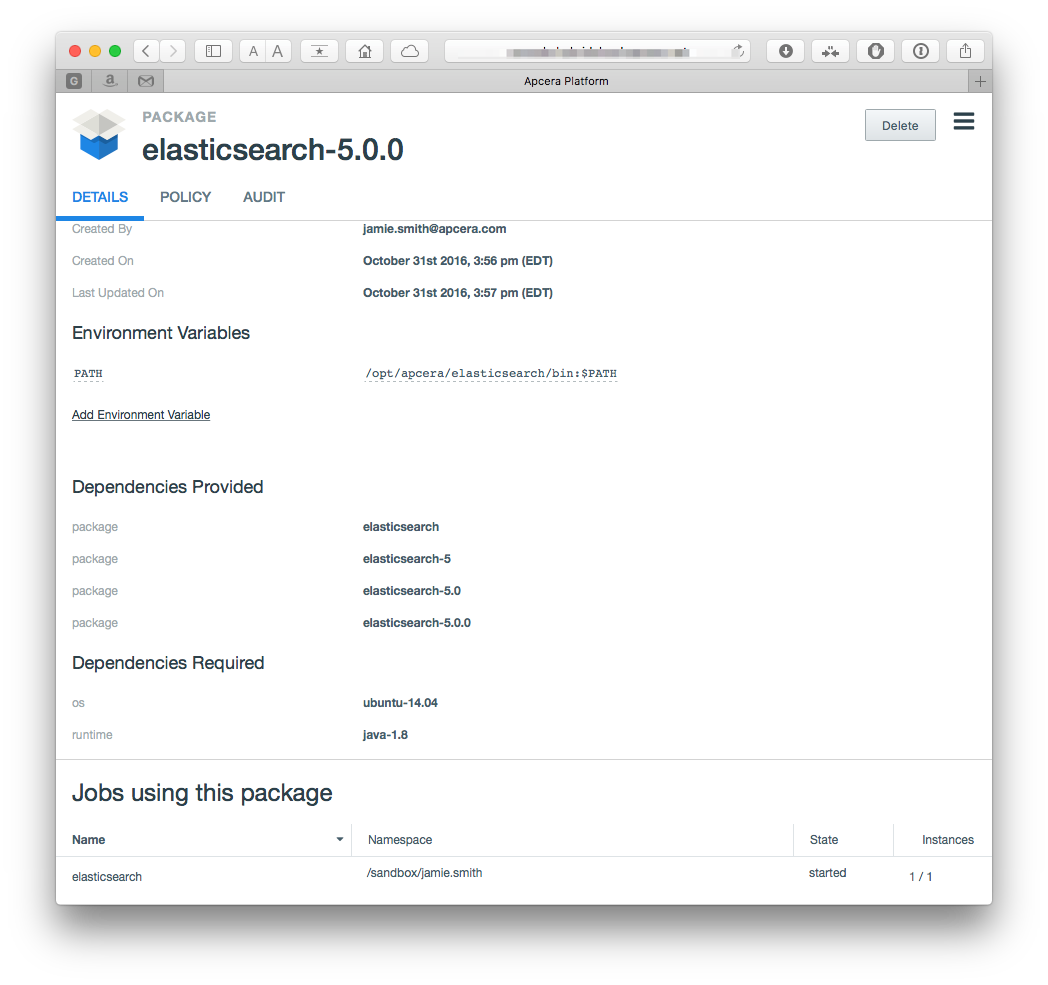
which will create a package that looks like this:
To deploy and start the standalone application (in the
elasticsearch/sample-app/ directory) we will leverage the bash stager, which
also allows us to specify the users and passwords that we will be using. Our
elasticsearch/sample-app/bash_start.sh looks like this (you probably want to
use better passwords):
 #!/bin/bash

 # Be creative - if x-pack is installed, add these users
 #
 if [ -d /opt/apcera/elasticsearch/bin/x-pack ]
 then
 	echo "x-pack is configured, adding users"

 	# Lets switch to file-based realms so we can use the users script
 	#
 	USER_COMMAND=/opt/apcera/elasticsearch-5.0.0/bin/x-pack/users
 	${USER_COMMAND} useradd apcera -r superuser -p "apcera-password"
 	${USER_COMMAND} useradd apcera-kibana -r kibana -p "kibana-password"
 	${USER_COMMAND} useradd logstash -r logstash_writer -p "logstash-password"

 else
 	echo "x-pack is not configured, skipping users"
 fi

 start-elasticsearch.sh
Our application manifest
elasticsearch/sample-app/continuum.conf sets the default application name as
elasticsearch, as well as requiring the appropriate package and resources
name: elasticsearch
instances: 1

package_dependencies: [
	"package.elasticsearch"
]

allow_egress: true

start: true

resources {
	memory: "4GB"
}
Replacing the domain with one appropriate for our cluster and user, we can now
deploy and start the application via the following commands (adjust the memory
to match your development needs - this can be done here by specifying
--memory or by changing the above manifest):
cd elasticsearch/sample-app/
apc app create \
	--routes https://elasticsearch.<your-domain> \
	--allow-ssh \
--batchKibana can be seen as the "gui" for the elasticsearch database- it provides charting, graphs, queries, and advanced visualizations to the data stored in the elasticsearch database.
Creation of the Kibana package looks fairly similar to the elasticsearch config,
again using a package build spec (kibana/kibana-5.0.0.conf):
name:      "kibana-5.0.0"
version:   "5.0.0"
namespace: "/apcera/pkg/packages"

sources [
    { url: "https://artifacts.elastic.co/downloads/kibana/kibana-5.0.0-linux-x86_64.tar.gz",
    sha1: "370b78f1600c4dde8ac29ff9bb71a0a429d58ba9" },
]

depends  [ { os: "ubuntu-14.04" },
			{ runtime: "java-1.8"}
		 ]
provides      [ { package: "kibana" },
                { package: "kibana-5" },
                { package: "kibana-5.0" },
                { package: "kibana-5.0.0" }]

environment {
	"PATH": "/opt/apcera/kibana/bin:$PATH"
			}

include_files [
	"start-kibana.sh"
	]

cleanup [
          "/root"
        ]

build (
	chmod a+x start-kibana.sh

	mkdir -p /opt/apcera
	tar -C /opt/apcera/ -xzf kibana-5.0.0-linux-x86_64.tar.gz

	cp start-kibana.sh /opt/apcera/kibana-5.0.0-linux-x86_64/bin/

	cd /opt/apcera/kibana-5.0.0-linux-x86_64

	# Note that we are accepting the license agreement for x-pack
	#
	./bin/kibana-plugin install x-pack

	cd /opt/apcera/
	ln -s kibana-5.0.0-linux-x86_64 kibana

	chown -R runner:runner /opt/apcera/kibana-5.0.0-linux-x86_64/
)
while kibana/start-kibana.sh script is simply:
 #!/bin/bash

 SERVER_PORT=${PORT:-5601}

 if [ -n "$ELASTICSEARCH_URI" ]
 then
     export ELASTICSEARCH=$(echo $ELASTICSEARCH_URI/ | sed "s|tcp|http|")
 else
 	echo "ERROR, job not linked to elasticsearch"
 	exit 9
 fi

 kibana --elasticsearch $ELASTICSEARCH --port=${SERVER_PORT} --host $(hostname) $@
We use the same pattern for the port SERVER_PORT=${PORT:-5601} as we did with
the elasticsearch package. There is a difference though- note the logic around
the ELASTICSEARCH_URI - the kibana package expects a job
link to the elasticsearch instance- in
fact, it will not funciton without it-- it is a front-end to elasticsearch. The
job link URI has a tcp scheme, so we change that to http to match the format
that kibana expects.
Creating the package from this manifest is pretty simple:
cd kibana/
apc package build kibana-5.0.0.conf
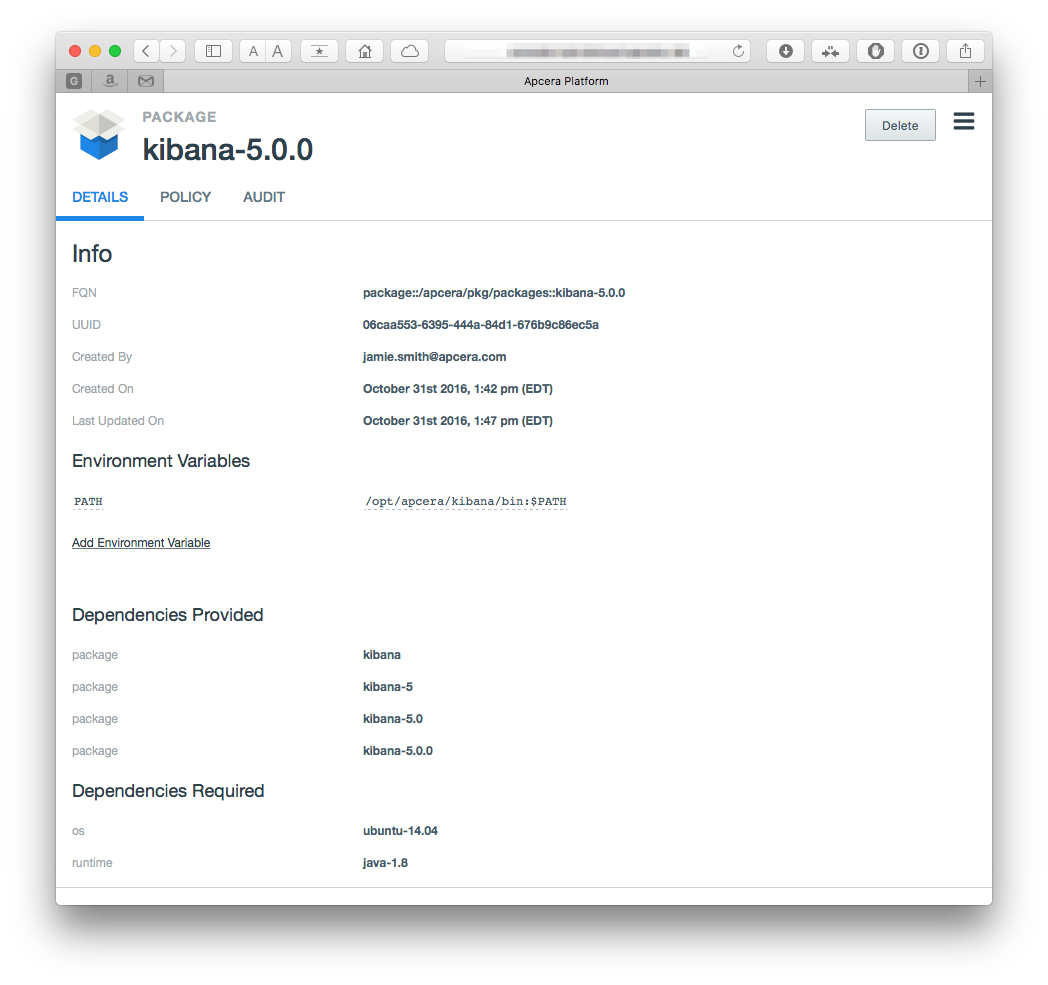
The Kibana package, based on the brand-new 5.0.0 is depicted here:
Creating a standalone application instance is a little more complicated than our
elasticsearch example, because we need to include the job link to elsaticsearch.
We have the same files: A manifest (kibana/sample-app/continuum.conf) and our
bash_start.sh stager
The manifest is very similar to the one for the elasticsearch app:
name: kibana
instances: 1

package_dependencies: [
	"package.kibana"
]

allow_egress: true

start: false

resources {
	memory: "1GB"
}
Note that in the case of kibana, the manifest has the start flag set to false- this is because we need to add the job link to elasticsearch before it can be used.
Our bash_start.sh simply adds the elasticsearch user to the kibana
config (something that you can skip if you aren't using x-pack):
 #!/bin/bash

 kibana_config=/opt/apcera/kibana/config/kibana.yml

 if [ -n "$ELASTICSEARCH_URI" ]
 then
     export ELASTICSEARCH=$(echo $ELASTICSEARCH_URI/ | sed "s|tcp|http|")
 else
 	echo "ERROR, job not linked to elasticsearch"
 	exit 9
 fi

 # change the password for the kibana and elastic special users
 # You should really use something better.
 #
 SECURITY_URL=${ELASTICSEARCH}_xpack/security/user

 curl -s -XPUT -u elastic:changeme "${SECURITY_URL}/elastic/_password" -d '{"password" : "elastic-password"}'
 curl -s -XPUT -u elastic:elastic-password "${SECURITY_URL}/kibana/_password" -d '{"password" : "kibana-password"}'

 echo "elasticsearch.username: \"kibana\"" >>  ${kibana_config}
 echo "elasticsearch.password: \"kibana-password\"" >> ${kibana_config}

 start-kibana.sh
Notice that we also take this opportunity to change the default passwords. You
could do this from the command line as well, but now you see how. As before- if
you aren't using x-pack, skip all of the security stuff and just do the
start-kibana.sh. Finally we can deploy the app as such- note the addition of
a job link to dynamically bind kibana to its elasticsearch server, and the
subsequent start command (again replacing the domain).
cd kibana/sample-app/

apc app create kibana \
	--routes https://kibana.<your-domain> \
	--allow-ssh \
	--batch

apc job link kibana --to elasticsearch --name elasticsearch --port 0

apc app start kibana
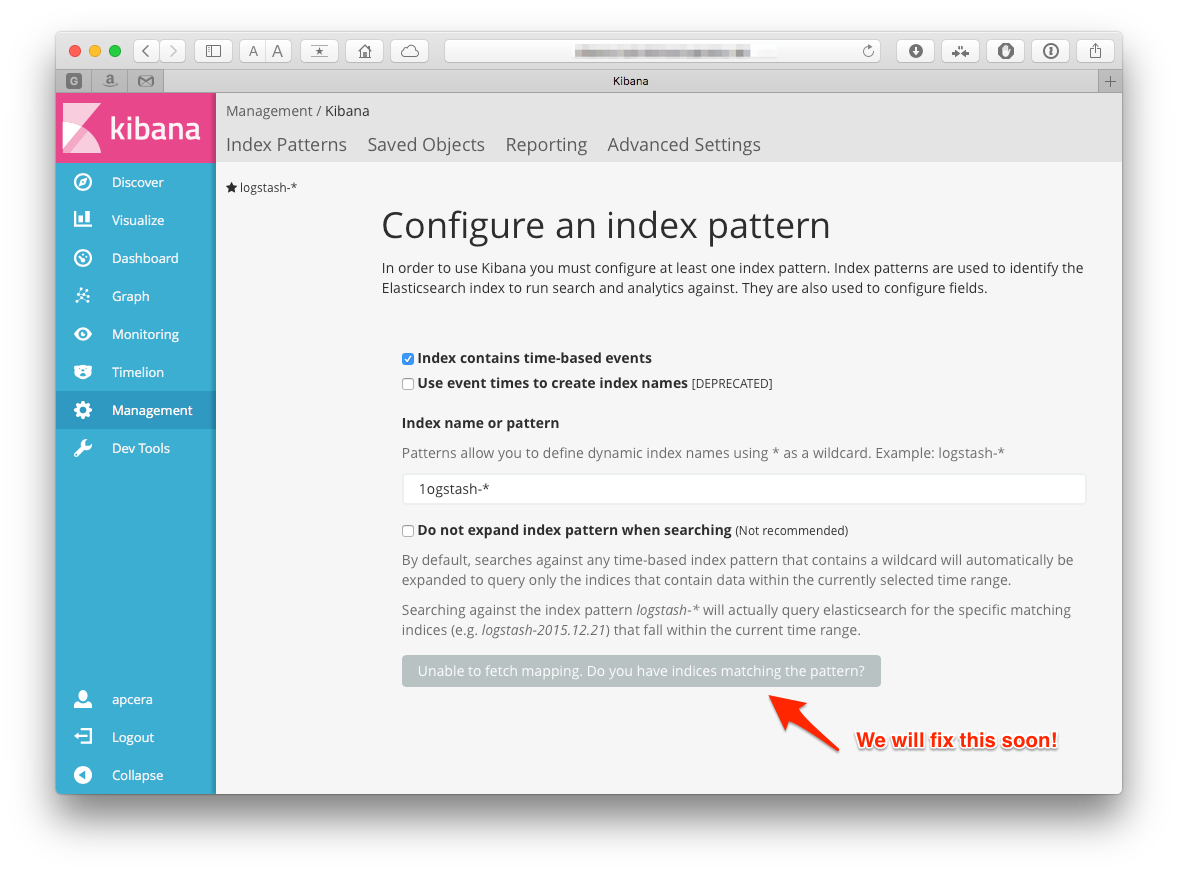
Navigating to the route should result in a page similar to the one below (note
that we can't really do anything with it, yet!). X-Pack users, make sure that
you log in using the apcera user's credentials that we defined above,
apcera/apcera-password
to finally see the landing page - don't worry about the mappings error, we will take care of that soon!
Finally we move on to Logstash. In our example we will be using logstash as a syslog target, which we bind to applications as a log drain.
In Elastic's words:
Logstash is an open source, server-side data processing pipeline that ingests data from a multitude of sources simultaneously, transforms it, and then sends it to your favorite "stash".
Logstash is a dynamic data collection pipeline with an extensible plugin ecosystem and strong Elasticsearch synergy.
Using a data collection "pipeline", we will use Logstash to map from various data sources to elasticsearch, via "plugins", which we describe later - but first we need a package for logstash.
Our package build specification for logstash rumtime looks similar to the
elasticsearch and kibana counterparts, our specification,
logstash/logstash-5.0.0.conf:
name:      "logstash-5.0.0"
version:   "5.0.0"
namespace: "/apcera/pkg/packages"

sources [
  { url: "https://artifacts.elastic.co/downloads/logstash/logstash-5.0.0.tar.gz",
    sha1: "a2517d10229eba1e706bbf3aa3e48ac15f2f19aa" },
]

depends  [ { os: "ubuntu-14.04" },
           { runtime: "java-1.8"} ]

provides      [ { package: "logstash" },
                { package: "logstash-5" },
                { package: "logstash-5.0" },
                { package: "logstash-5.0.0" }]

environment {
	"PATH": "/opt/apcera/logstash/bin:$PATH"
			}

cleanup [
          "/root"
        ]

build (
	mkdir -p /opt/apcera
	tar -C /opt/apcera/ -xzf logstash-5.0.0.tar.gz

	cd /opt/apcera/
	ln -s logstash-5.0.0 logstash
	cd logstash

	# Install some plugins
	#
	./bin/logstash-plugin install logstash-output-kafka

	# Update the geo ip data
	#
	echo "This sample uses GeoLite2 data created by MaxMind, available from"
	echo "http://www.maxmind.com"

	curl -s -O "http://geolite.maxmind.com/download/geoip/database/GeoLite2-City.mmdb.gz"
	gunzip GeoLite2-City.mmdb.gz
	rm -f GeoLite2-City.mmdb.gz

	chown -R runner:runner logstash-5.0.0/
)
Note that we have installed a more robust set of IP-to-geography mappings when
we built the logstash package (see right after the comment Update the geo ip data)
Our logstash package is meant to be used in the guise of an application- the pipeline configuration is the variable part-- the "source code" if you will -- while the package is the same between different instances of the application. Think of it like perl - we have one perl package, but many application instances running against it. It only makes sense for each individual application to define their own configuration for logstash.
Creating the package from this manifest is pretty simple:
cd logstash/
apc package build logstash-5.0.0.conf
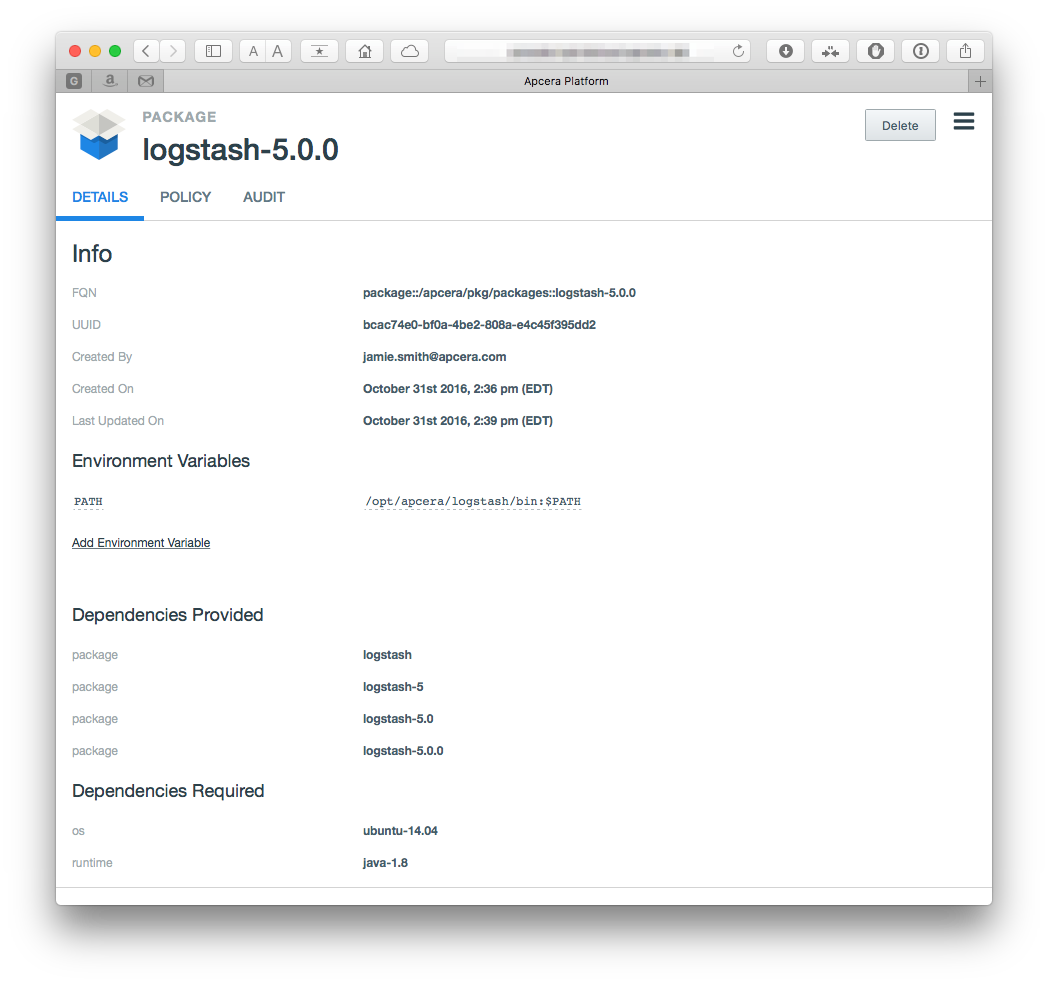
Which yields a package that looks similar to:
At this point we have the E(lasticsearch) & K(ibana) parts of the stack running- now we need to tie in the L(ogstash). To do this we will be tying a logstash application to a sample applicaiton as a log drain. Let's build out a sample syslog target!
The whole goal of the way we are using logstash is so the app can serve as a syslog target (that is to say that we are set up using a syslog input for Logstash). Granted, we don't have a tremendous amount of knowledge about what is coming in. For this we want to set up FILTERS.
To do this we need to create a logstash pipeline to process the data. Logstash has many predefined patterns and filters, but we need a custom one (because our log format is custom).
We will be setting up a pipeline configuration with a syslog input, and two outputs- one for elasticsearch, and one for stdout (which will make debugging easier).
So far, so good - let's build up a pipeline configuration for our logstash
instance. A logstash pipeline (logstash/syslog-sample-app/pipeline.conf)
sending to elasticsearch starts out looking like this:
input
{
  syslog {}
}
filter {}
output
{
  elasticsearch {}
  stdout {}
}
As you can see, we have input, output, and filter sections - a prototype logstash filter. We will fill these out with a little more detail a bit later.
First we now need to bind our logstash application to our other applications,
and have it behave in a more cloud-native manner. For this, we will use a
script to have it get the syslog port. Our
logstash/syslog-sample-app/bash_start.sh start script for the bash stager will
preprocess our logstash pipeline configuration, to make sure it picks up the
correct port:
 #!/bin/bash

 export SYSLOG_PORT=${PORT:-3333}

 sed "s|SYSLOG_PORT|$SYSLOG_PORT|" pipeline.conf > syslog-pipeline.conf

 logstash -f syslog-pipeline.conf
In this case we are using the same pattern for the $PORT variable as with the
previous applications, but this time we are preprocessing our pipeline configuration using
sed - but we need a place for that value to land. We can now update our
pipeline to include this:
input
{
		syslog
		{
			# This will be replaced by the PORT from the env
			port => SYSLOG_PORT
		}
}
filter {}
output
{
	elasticsearch {}
	stdout {}
}
We still have a few more things to do. Next we need to tell logstash where to
send the data - we specified the elasticsearch output, but we need to leverage
Apcera job templates to map the
bindings. We replace our elasticsearch {} with a version specifying the
template to process, and go ahead and include the credentials, so logstash knows
how to authenticate with our elasticsearch instance:
	(...)
	elasticsearch {
		user => "logstash"
		password => "logstash-password"
		hosts => [
			{{range bindings}}{{if .URI.Scheme}}"{{.URI.Host}}:{{.URI.Port}}"{{end}}{{end}}
		]
	(...)
	}
During the deployment process, the template translation will process the directives, generating a file that contains something like this (note that the IP address will be different):
	(...)
	elasticsearch
	{
		user => "logstash"
		password => "logstash-password"
		hosts => [
			"169.254.0.14:10000"
		]
	}
	(...)
We still need logstash to know how to take apart the messages that it receives. It can process plain text, but it is more convenient for us to define the format ahead of time. This is done by using filters - in this case we will be using a grok filter.
The sample application we will be using (the one that will drain to our logstash)
is written in node.js, and uses Morgan logger middleware.
The pertinent parts of the format specification, and the logger syntax are:
morgan.token('cntm-instance', function getUUID (req) {
  return process.env['CNTM_INSTANCE_UUID']
})

morgan.token('real-client', function getRealClient (req) {
    return req["headers"]["x-forwarded-for"];
})

morgan.token('cntm-job', function getJobFQN (req) {
  return process.env['CNTM_JOB_FQN']
})

morgan.token('zulu-date', function getZuluDate (req) {
	return new Date().toISOString();
})

morgan.format('apcera', 'access-log :real-client :remote-user :zulu-date latency :response-time ms :cntm-job :cntm-instance ":method :url HTTP/:http-version" :status :res[content-length] ":referrer" ":user-agent"')

app.use(morgan('apcera'))
and some sample records
access-log 71.75.0.0 - 2016-10-24T17:46:53.409Z latency 0.831 ms job::/sandbox/demouser::todo eb93dcf5-b0ca-4e93-86dd-76a5def65f04 "POST /api/todos HTTP/1.1" 200 5099 "http://todo.your.domain.com/" "Mozilla/5.0 (Macintosh; Intel Mac OS X 10_11_6) AppleWebKit/537.36 (KHTML, like Gecko) Chrome/53.0.2785.116 Safari/537.36"
access-log 71.75.0.0 - 2016-10-24T17:46:55.286Z latency 0.356 ms job::/sandbox/demouser::todo eb93dcf5-b0ca-4e93-86dd-76a5def65f04 "DELETE /api/todos// HTTP/1.1" 404 27 "http://todo.your.domain.com/" "Mozilla/5.0 (Macintosh; Intel Mac OS X 10_11_6) AppleWebKit/537.36 (KHTML, like Gecko) Chrome/53.0.2785.116 Safari/537.36"
access-log 71.75.0.0 - 2016-10-24T17:46:58.355Z latency 0.349 ms job::/sandbox/demouser::todo eb93dcf5-b0ca-4e93-86dd-76a5def65f04 "DELETE /api/todos// HTTP/1.1" 404 27 "http://todo.your.domain.com/" "Mozilla/5.0 (Macintosh; Intel Mac OS X 10_11_6) AppleWebKit/537.36 (KHTML, like Gecko) Chrome/53.0.2785.116 Safari/537.36"
access-log 71.75.0.0 - 2016-10-24T17:47:04.036Z latency 0.787 ms job::/sandbox/demouser::todo eb93dcf5-b0ca-4e93-86dd-76a5def65f04 "POST /api/todos HTTP/1.1" 200 5113 "http://todo.your.domain.com/" "Mozilla/5.0 (Macintosh; Intel Mac OS X 10_11_6) AppleWebKit/537.36 (KHTML, like Gecko) Chrome/53.0.2785.116 Safari/537.36"
access-log 71.75.0.0 - 2016-10-24T17:47:05.308Z latency 1.503 ms job::/sandbox/demouser::todo eb93dcf5-b0ca-4e93-86dd-76a5def65f04 "DELETE /api/todos/%!C(MISSING) HTTP/1.1" 200 5099 "http://todo.your.domain.com/" "Mozilla/5.0 (Macintosh; Intel Mac OS X 10_11_6) AppleWebKit/537.36 (KHTML, like Gecko) Chrome/53.0.2785.116 Safari/537.36"
Which kind of looks like a standard apache log, but with a bit more. Broken down, it looks like this:
| field name | value |
|---|---|
| access-log | access-log |
| :remote-addr - | 71.75.0.0 |
| :remote-user | - |
| :zulu-date | 2016-10-24T17:46:53.409Z |
| :response-time ms | latency 0.831 ms |
| :cntm-job | job::/sandbox/demouser::todo |
| :cntm-instance | eb93dcf5-b0ca-4e93-86dd-76a5def65f04 |
| :method :url HTTP/:http-version | "POST /api/todos HTTP/1.1" |
| :status | 200 |
| :res[content-length] | 5099 |
| ":referrer" | "http://todo.your.domain.com/" |
| ":user-agent"' | "Mozilla/5.0 (Macintosh; Intel Mac OS X 10_11_6) AppleWebKit/537.36 (KHTML, like Gecko) Chrome/53.0.2785.116 Safari/537.36" |
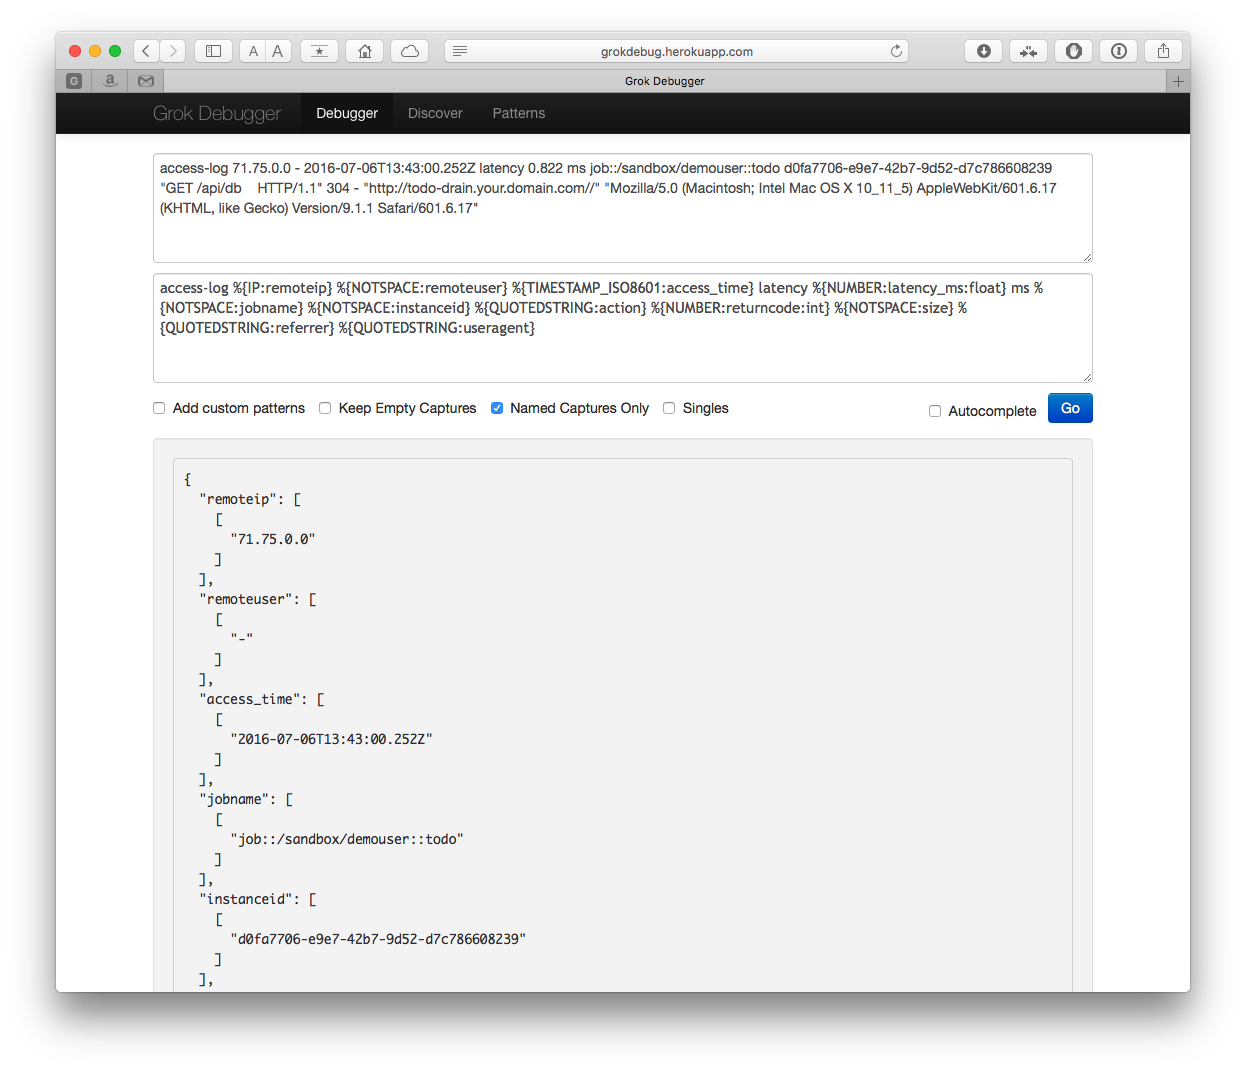
We need a filter to match the above patterns. To build the pipeline we will use the grok debugger to help generate our format. Using the tool is pretty straightforward. Another helpful tool is the Grok Constructor. In our case it looks like:
with our format as
access-log %{IP:remoteip} %{NOTSPACE:remoteuser} %{TIMESTAMP_ISO8601:access_time} latency %{NUMBER:latency_ms:float} ms %{NOTSPACE:jobname} %{NOTSPACE:instanceid} %{QUOTEDSTRING:action} %{NUMBER:returncode:int} %{NOTSPACE:size} %{QUOTEDSTRING:referrer} %{QUOTEDSTRING:useragent}
We want to make sure that we actually match all rows, so we will specify a
catch-all pattern as well access-log %{IP:remoteip} %{GREEDYDATA:catchall}
Now our final pipeline.conf looks like this:
input
{
	syslog
	{
		port => SYSLOG_PORT
	}
}
filter
{
	grok
	{
		match => { "message" => "access-log %{IP:remoteip} %{NOTSPACE:remoteuser} %{TIMESTAMP_ISO8601:access_time} latency %{NUMBER:latency_ms:float} ms %{NOTSPACE:jobname} %{NOTSPACE:instanceid} %{QUOTEDSTRING:action} %{NUMBER:returncode:int} %{NOTSPACE:size} %{QUOTEDSTRING:referrer} %{QUOTEDSTRING:useragent}"}
		match => { "message" => "access-log %{IP:remoteip} %{GREEDYDATA:catchall}"}
	}
}
output
{
	elasticsearch
	{
		user => "logstash"
		password => "logstash-password"
		hosts => [
			{{range bindings}}{{if .URI.Scheme}}"{{.URI.Host}}:{{.URI.Port}}"{{end}}{{end}}
		]
	}
	stdout {}
}
If you are skipping x-pack, omit the setting of the user and password from the
above elasticsearch section, leaving only the hosts block.
Now, when records pass through our logstash pipeline, they will be compared against the various match records we have, and be mapped to records that look something like this:
{
  "remoteip": [
	[
		"71.75.0.0"
	]
  ],
  "remoteuser": [
	[
		"-"
	]
  ],
  "access_time": [
	[
		"2016-07-06T13:43:00.252Z"
	]
  ],
  "jobname": [
	[
		"job::/sandbox/demouser::todo"
	]
  ],
  "instanceid": [
	[
		"d0fa7706-e9e7-42b7-9d52-d7c786608239"
	]
  ],
  "action": [
	[
		"GET /api/db	HTTP/1.1"
	]
  ],
  "size": [
	[
		"-"
	]
  ],
  "referrer": [
	[
		"http://todo-drain.<domain-name>"
	]
  ],
  "useragent": [
	[
		"Mozilla/5.0 (Macintosh; Intel Mac OS X 10_11_5) AppleWebKit/601.6.17 (KHTML, like Gecko) Version/9.1.1 Safari/601.6.17"
	]
  ]
}
We can also add a filter to translate geoip information, allowing us to get an idea where requests are coming from (note that this assumes that your router and any upstream load balancers/ELB include the forwarded IP from the client, otherwise these will only be the IPs of your router). With this in place, the filter block of our pipeline looks like:
filter
{
	grok
	{
		match => { "message" => "access-log %{IP:remoteip} %{NOTSPACE:remoteuser} %{TIMESTAMP_ISO8601:access_time} latency %{NUMBER:latency_ms:float} ms %{NOTSPACE:jobname} %{NOTSPACE:instanceid} %{QUOTEDSTRING:action} %{NUMBER:returncode:int} %{NOTSPACE:size} %{QUOTEDSTRING:referrer} %{QUOTEDSTRING:useragent}"}
		match => { "message" => "access-log %{IP:remoteip} %{GREEDYDATA:catchall}"}
	}
	geoip
	{
		source => "remoteip"
		target => "geoip"
		database => "/opt/apcera/logstash/GeoLiteCity.dat"
		add_field => [ "[geoip][coordinates]", "%{[geoip][longitude]}" ]
		add_field => [ "[geoip][coordinates]", "%{[geoip][latitude]}"  ]
	}
	mutate
	{
		convert => [ "[geoip][coordinates]", "float"]
	}
}
We also include an application manifest for our syslogger
(logstash/syslog-sample-app/continuum.conf)
 name: my-syslog
 instances: 1

 package_dependencies: [
 	"package.logstash"
 ]

 allow_egress: true

 # Cannot start it since it has to be bound
 #
 start: false

 resources {
 	memory: "1GB"
 }

 templates: [
 	{
 		path: "pipeline.conf"
 	}
 ]
 ports: [
 	{
 		number: 0,
 		routes: [
 			{
 				type: "tcp",
 				endpoint: "auto",
 				weight: 0.0
 			}
 		]
 	}
 ]
We can deploy and start our syslog app using the following commands:
 cd logstash/syslog-sample-app/

 # Create the app  (the --allow-ssh here is optional)
 #
 apc app create --allow-ssh

 # This is crucial - this logstash instance needs to know where
 # elasticsearch is, which is provided via job links.  The port 0 tells it
 # to bind to the system-configured port
 #
 apc app link my-syslog --to elasticsearch --name elasticsearch --port 0

 # Finally we can start this syslog app
 #
apc app start my-syslog A sample hello-world kind of app is supplied in the sample-app/ directory. To
start it:
cd sample-app/
apc app create --allow-ssh --routes http://elk-sample.<your-domain>
Which will create a small Node.js app called elk-sample-app, and assign bind the
http://elk-sample. route to it. You can make requests to
it. Anything to / will return a 200 response with a json payload, anything
to /304 will return a 304, while anything else will return a 400.
Finally, we tie the logstash instance with the sample app via a log drain. First we have to find the correct address by running
apc app show todo
(...)
│ Exposed Ports: │ 0 (chosen by system, env: $PORT)                     │
│                │ 222                                                  │
│                │                                                      │
│ Routes:        │ tcp://your-IP:your-port [to port 0] (Weight: auto)   │
(...)
and looking for the Routes: entry. Changing the scheme to syslog, we can add
the log drain, using your IP and port from above:
apc drain add syslog://<your-IP>:<your-port> --app elk-sample-appfor example, for mine I had to use:
apc drain add syslog://55.22.133.114:53316 --app elk-sample-app Note that you can change it to use a static port, see the application manifests.
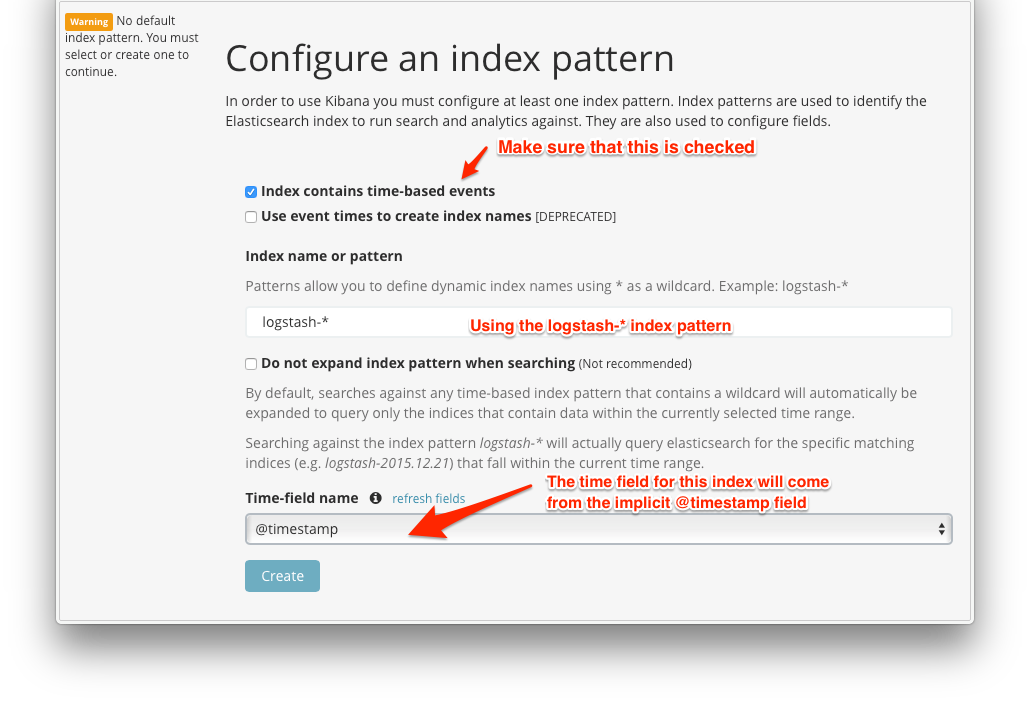
Once everything is all tied together, we can start to visualize our logs in Kibana. Going back to our kibana browser, we want to register a new index. Refresh the page, and you should see that you can now add an index:
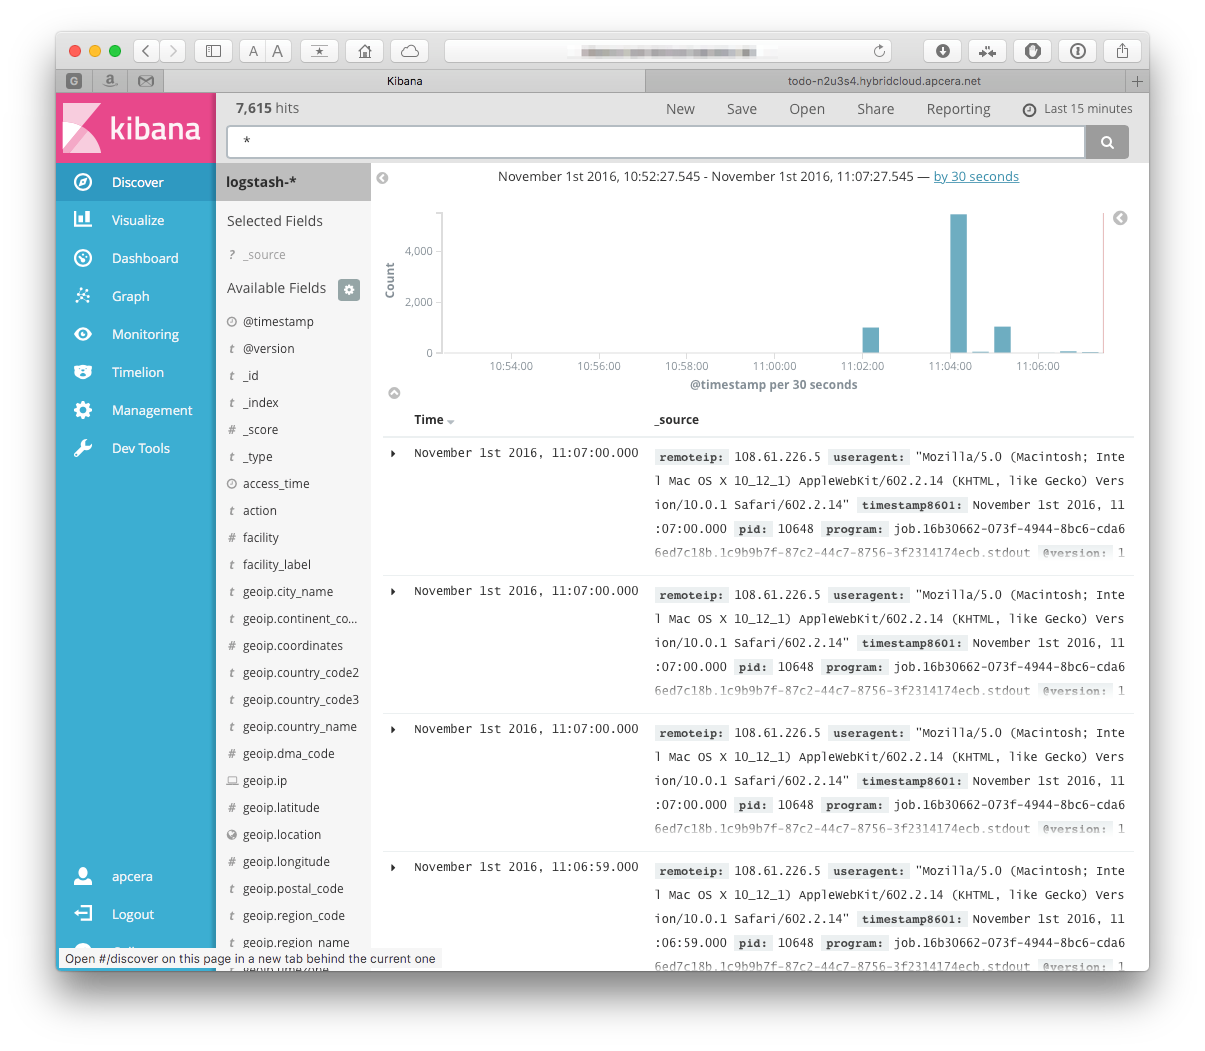
then click "create". Moving to the the Discover tab we can see now records coming (Ok, this assumes that the application has been sending log records- in my case I just reloaded the app's page a few times)
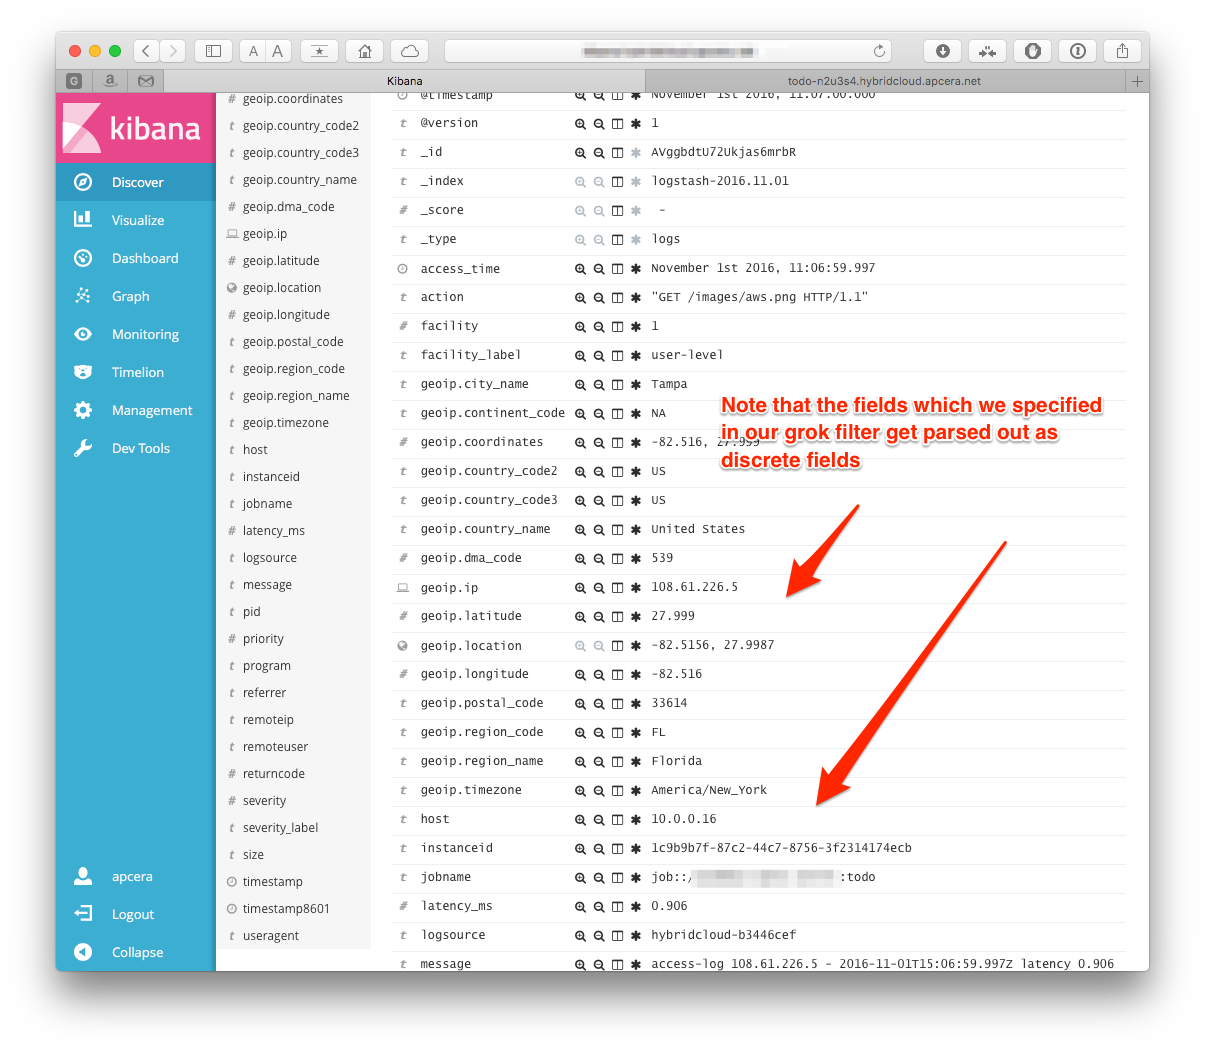
clicking on the disclose arrow next to one of the log entries, we can see that the fields we are parsing for are stored as discrete fields:
But we can do much more- kibana can be used to create bar charts, graphs, even dashboards. Let's build a couple visualizations!
First let's build and save a pie chart to plot the response codes from requests to our app.
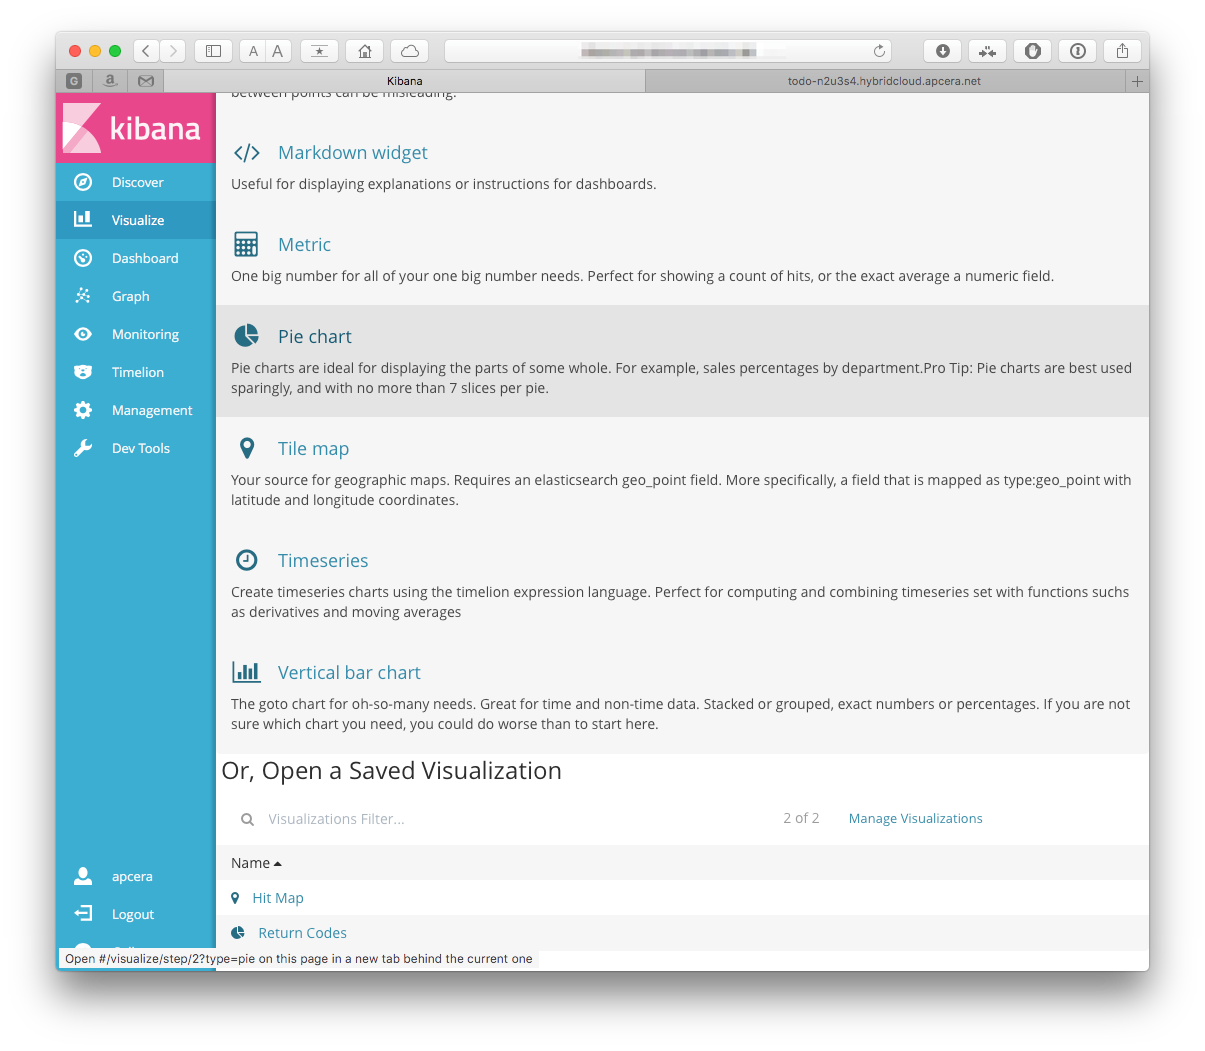
Click on the "visualize" tab on the left side of the screen, then select "Pie chart":
Select our logstash-* index as the source index. On the next screen,
pick the Split Splices for the bucket type, and pick a terms aggregation.
The field we want is the returncode, so select that in the Field dropdown.
The other choices should stay the defaults. Click the "Play" button above the
criteria, and you should see a pie chart.
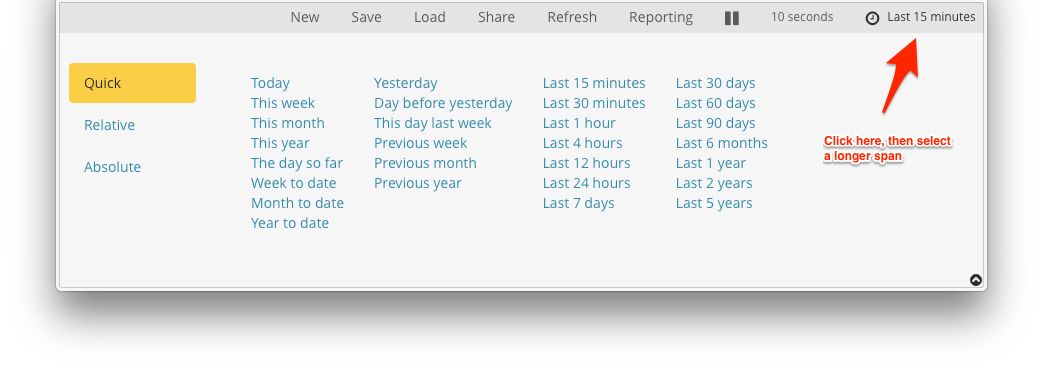
The default time for a viz is 15 minutes - if there weren't any records in that window, you can increase it. Click on the clock at the top right, then select a longer window:
Once you get that working you can save the visualization by hitting the "save" button in the top banner. Let's call it "Return Codes":
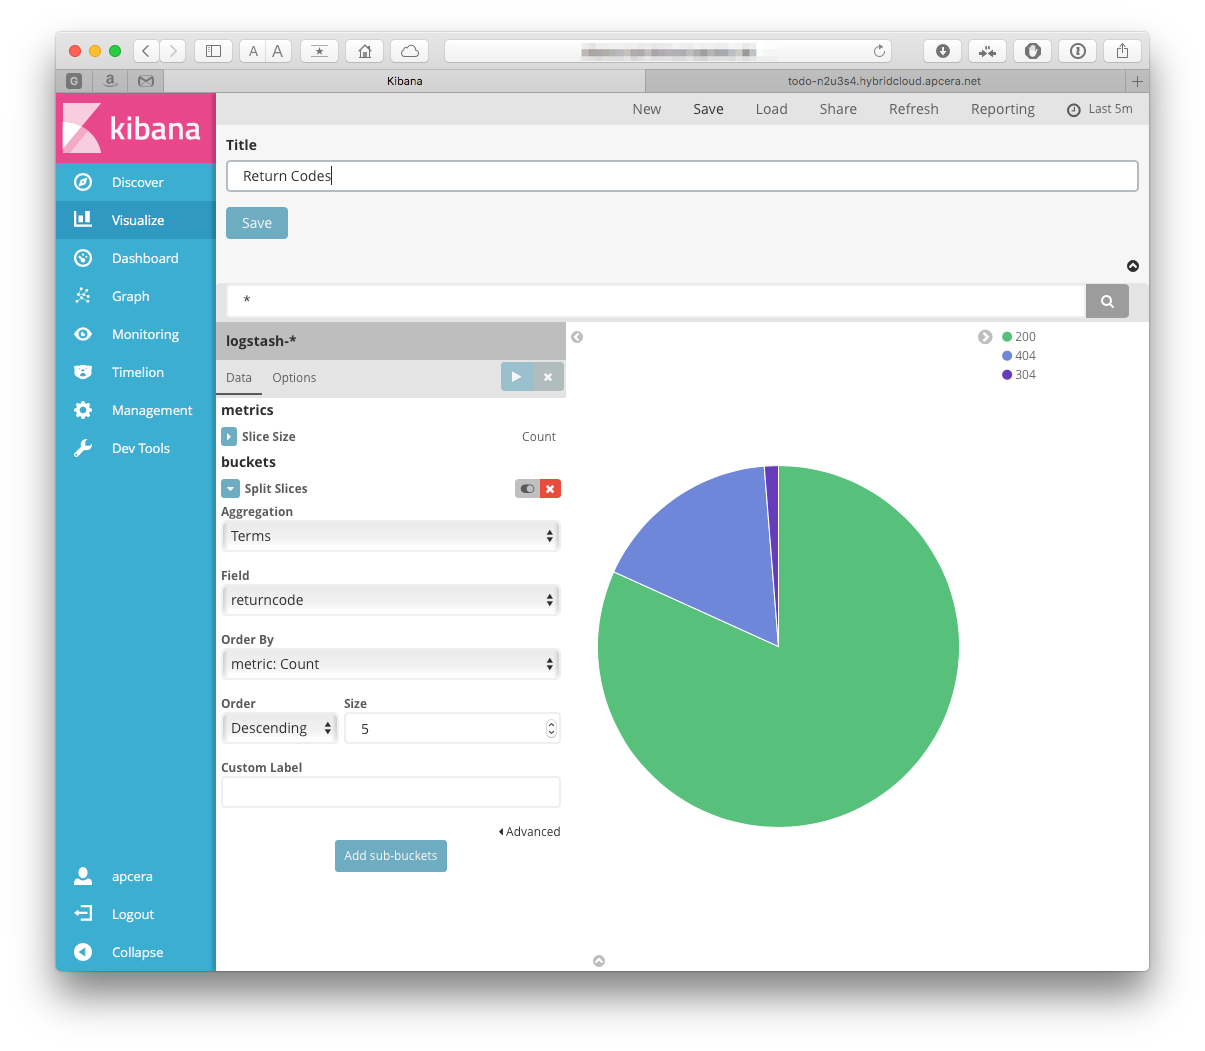 Hmmm, I am getting several 304's, I wonder if that is OK.
We went to the trouble of installing that Geo data, we should see what we can do with that. How about a map!
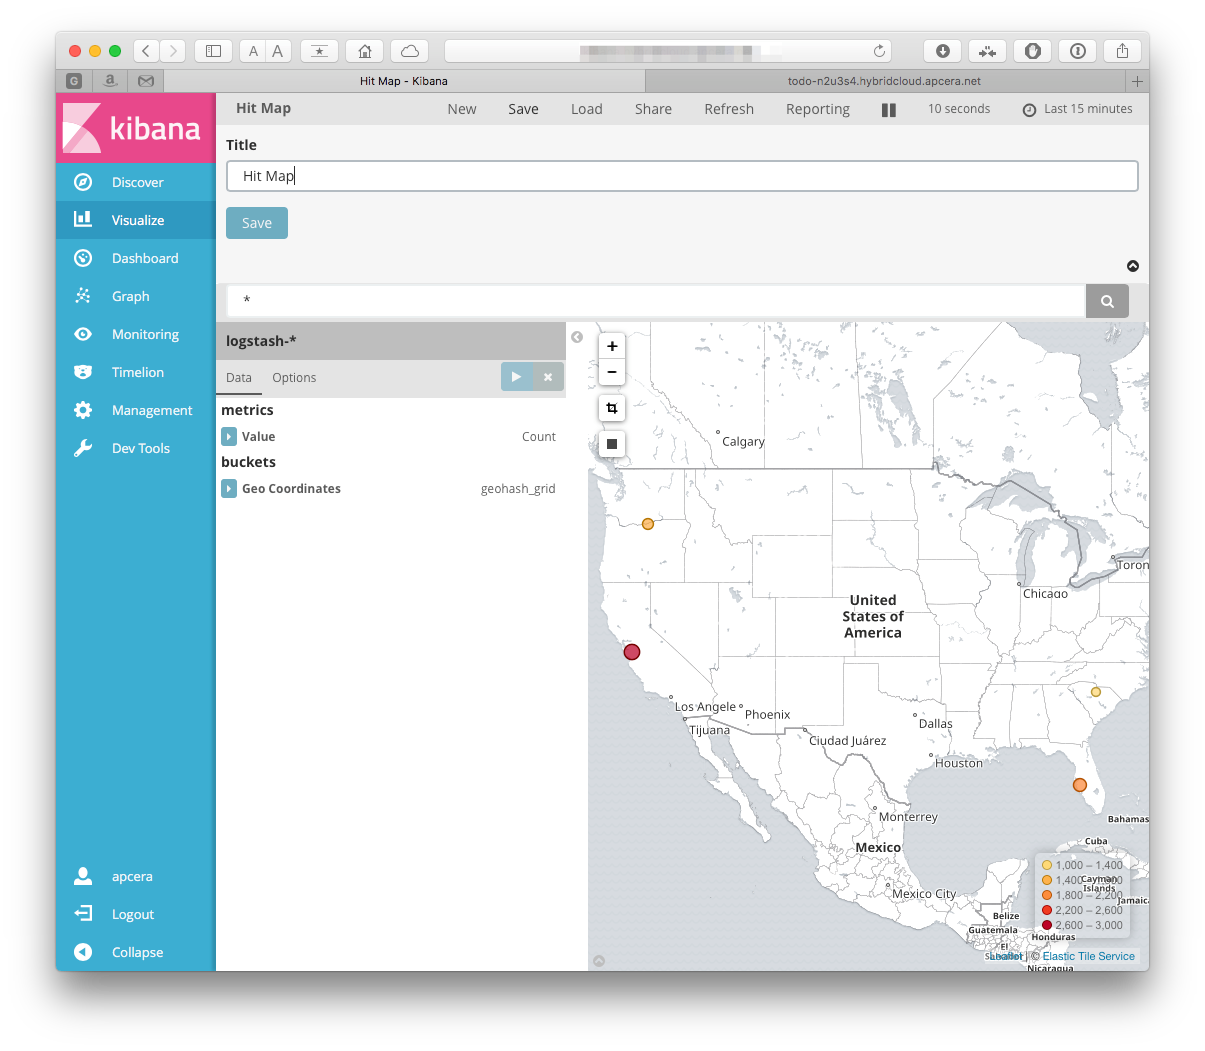
So create another visualization. Click "new" when on the "Visualize" tab, but this time choose the "Tile map":
Again, select the logstash-* index. The only bucket type choice that we
have is Geo Coordinates, so I guess that is the one that we will pick. Select
the defaults. We can save that, also:
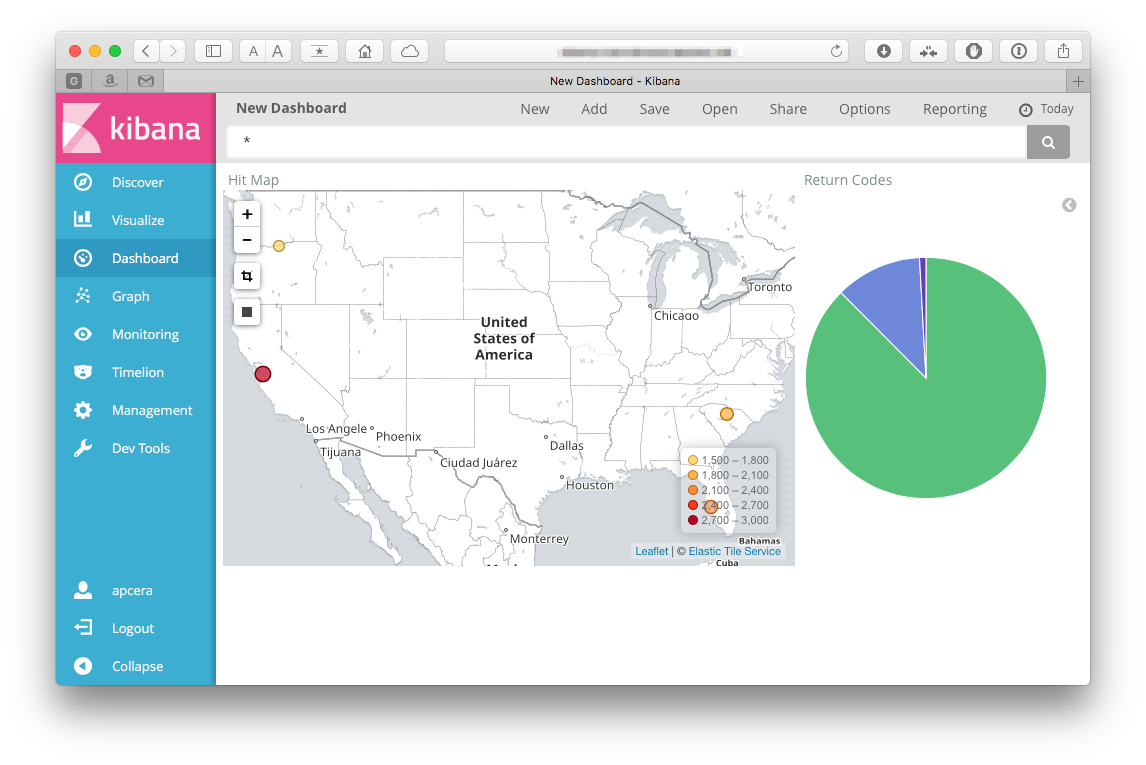
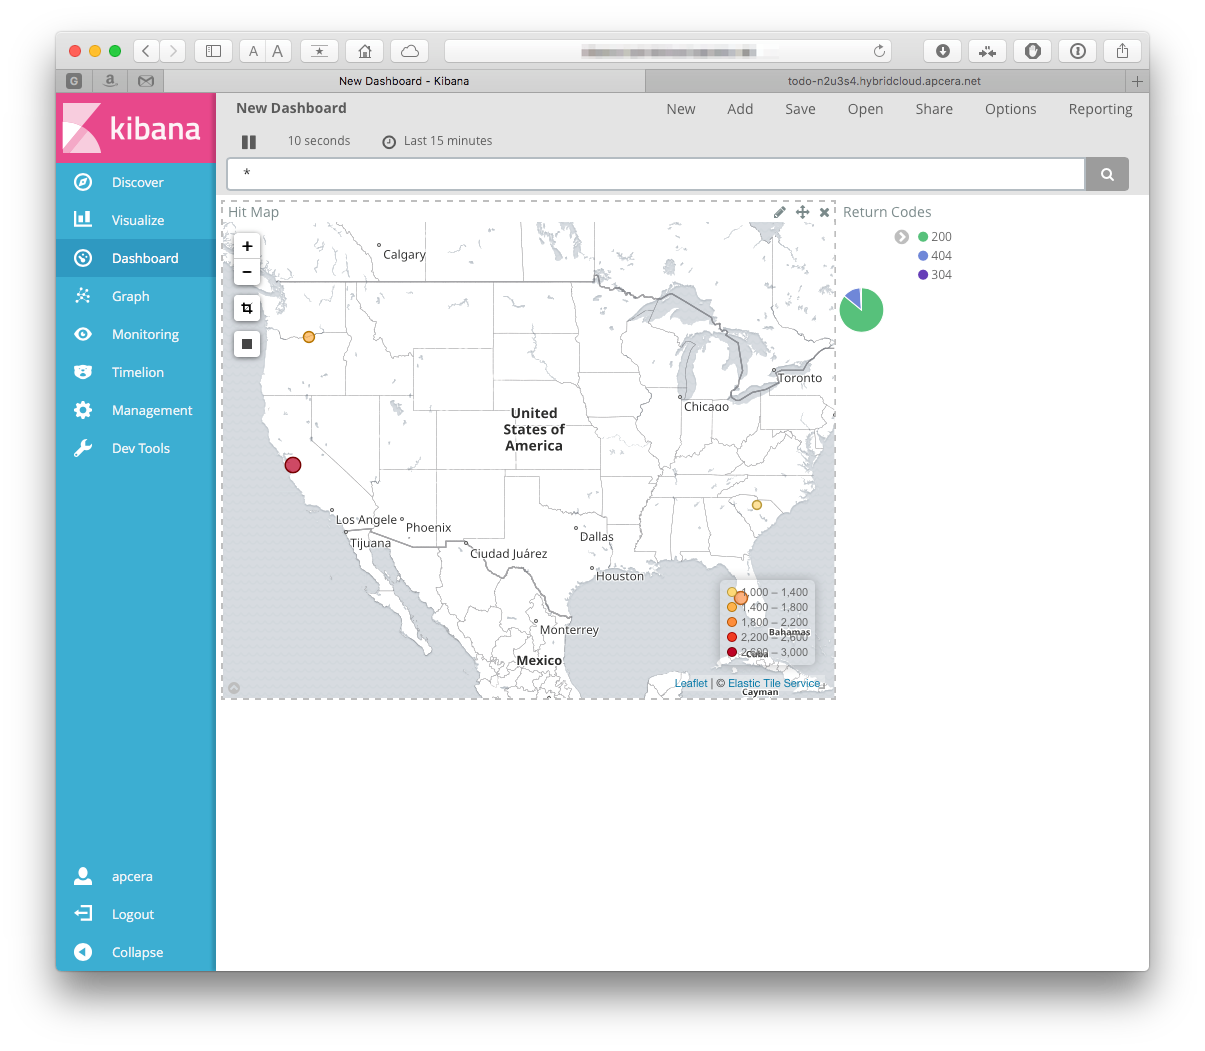
No, not the Meatloaf song. A consolidated view of a system. Let's make one!
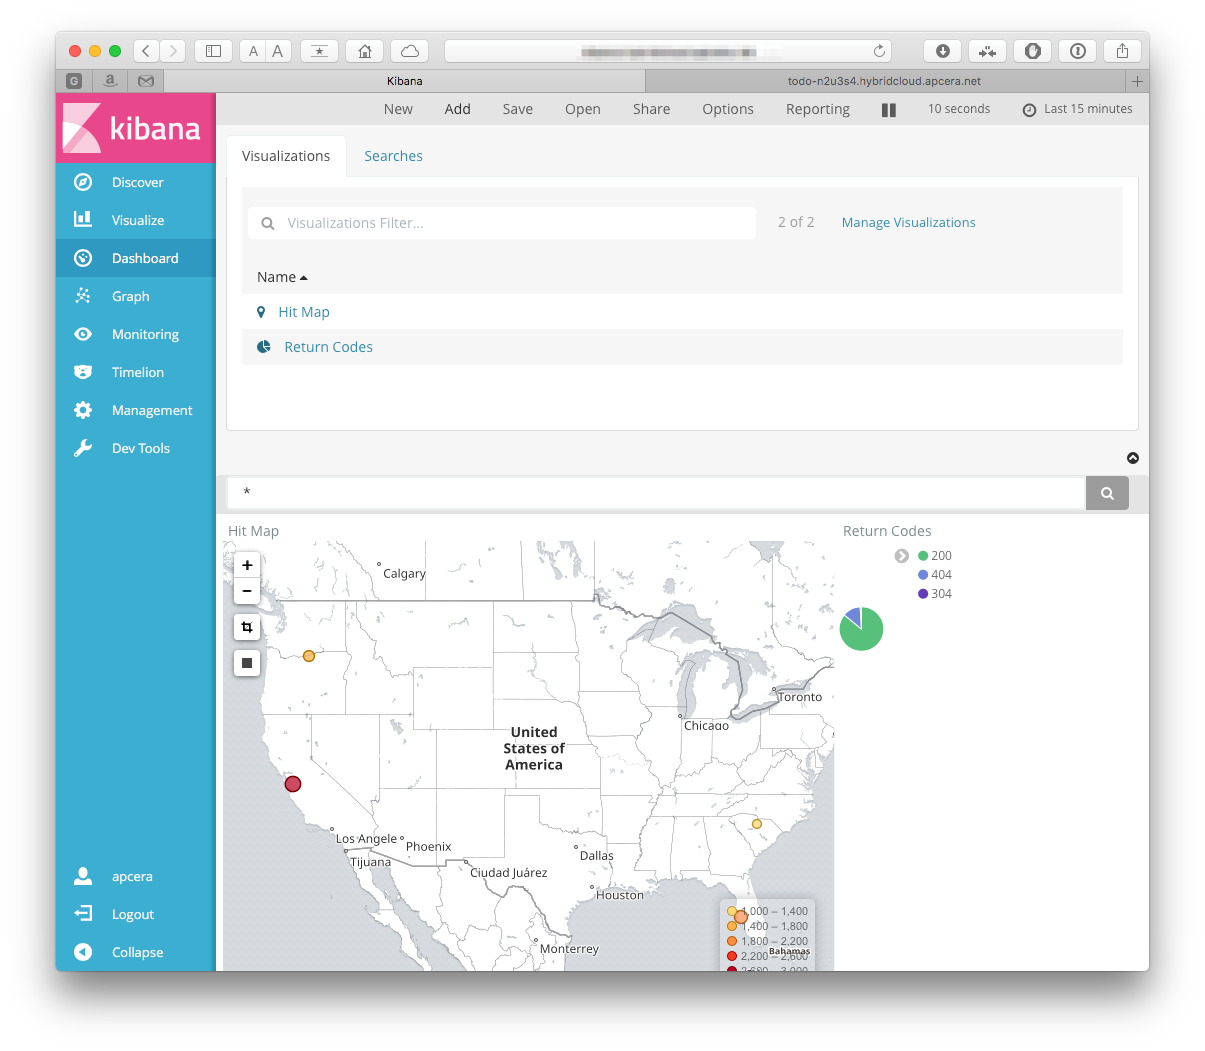
Click on the "Dashboard" tab in the left toolbar, then click the add button. You should be prompted to add visualizations to your dashboard -
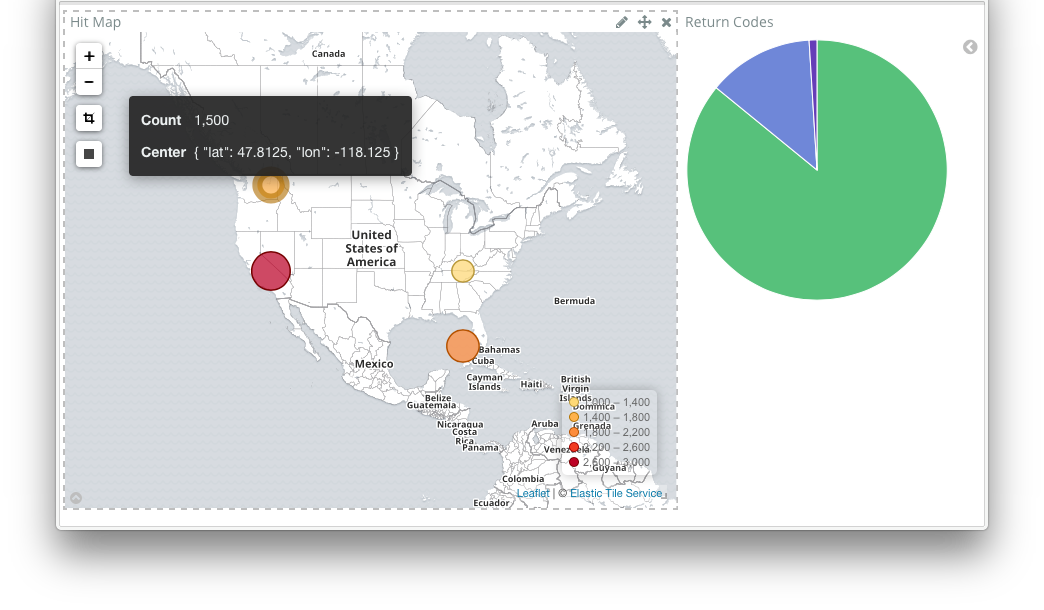
Add both of the ones that we just created. When they are on the dashboard you can resize them:
or edit them:
Make sure to save it so you can use it later!
Starting from scratch we have built and used a complete elk stack, including binding our application directly to our own logstash instance, defining our own format. It even helped me learn something about my application (the 304 errors, which I still haven't looked in to, but it seems like they are OK).
The patterns don't need to stop there- the platform doesn't care where elasticsearch is- the other components could easily be reconfigured to point elsewhere.
While this is a pretty long set of instructions, most of what is in here is directly reusable. Multiple logstash instances can log to the same elasticsearch instance, while using only one kibana viewer. It is also very flexible- each developer can set up their own stack- either as discrete applications, or one large bundle. Remember - you only need to create the packages once for your team to leverage the stack.
Now that we have a set of packages for the ELK stack we want to make them the default for our cluster. We can do this using policy to enforce the package resolution
My new policy for these packages will be:
// Elk Stack
//
if (dependency equals package.elasticsearch)
{
	package.default "package::/apcera/pkg/packages::elasticsearch-5.0.0"
}
if (dependency equals package.logstash)
{
	package.default "package::/apcera/pkg/packages::logstash-5.0.0"
}
if (dependency equals package.kibana)
{
	package.default "package::/apcera/pkg/packages::kibana-5.0.0"
}
There is a great deal more you can do with filters and codecs then we have covered. You can set up multiple filters to handle for many different message typese coming in, and handle them accordingly. You can enrich, delete, or anonymize data.
For more information on filters and related topics on logstash, take a look at:
Also new to the ELK stack is Beats, Elastic's "platform for single-purpose data shippers". Beats are lightweight shippers that sit at the edge, sending data from tens, hundreds, or even thousands of machines to Logstash or Elasticsearch. Look for a future post on incoporating these with your ELK stack on the Apcera platform!
What we have covered here is a great way to for developers to spin up their own ELK stack for their own use, and it also serves as a foundation for a production way to deploy the stack. Use multiple instances of elasticsearch in a virtual network to form a cluster; attach persistent disk to them using APCFS. Even take them to the next level and incorporate watcher or graph.
When all is said and done, this is what the directory hierarchy looks like for our project:
├── README.md
├── elasticsearch
│   ├── elasticsearch-5.0.0.conf
│   ├── elasticsearch.yml
│   ├── roles.yml
│   ├── sample-app
│   │   ├── bash_start.sh
│   │   └── continuum.conf
│   └── start-elasticsearch.sh
├── kibana
│   ├── kibana-5.0.0.conf
│   ├── sample-app
│   │   ├── bash_start.sh
│   │   └── continuum.conf
│   └── start-kibana.sh
├── logstash
│   ├── logstash-5.0.0.conf
│   └── syslog-sample-app
│       ├── bash_start.sh
│       ├── continuum.conf
│       └── pipeline.conf
├── openjdk
│   └── openjdk-1.8.0-ppa.conf
└── sample-app
    ├── continuum.conf
    ├── package.json
    └── server.js
This is now availble in the sample applications repository on Apcera's github, see https://github.com/apcera/sample-apps/tree/elk-stack. To copy, simply do:
git clone https://github.com/apcera/sample-apps.git
cd example-elk-stackIf, when installing or running, you run in to a problem with a keystore that looks like this:
[staging] Failed: SSLException[java.lang.RuntimeException: Unexpected error: java.security.InvalidAlgorithmParameterException: the trustAnchors parameter must be non-empty]; nested: RuntimeException[Unexpected error: java.security.InvalidAlgorithmParameterException: the trustAnchors parameter must be non-empty]; nested: InvalidAlgorithmParameterException[the trustAnchors parameter must be non-empty];
Then try with a newer version of the openjdk or oraclejdk. You can find a sample
openjdk java package specification in openjdk/openjdk-1.8.0-ppa.conf:
name:      "openjdk-1.8.0-ppa"
version:   "1.8.0"
namespace: "/apcera/pkg/runtimes"

depends  [ { os: "linux" } ]
provides [ { runtime: "java" },
           { runtime: "java-1.8" },
           { runtime: "java-1.8.0" },
           { runtime: "java-1.8.0-ppa" } ]

environment { "PATH": "/usr/lib/jvm/java-8-openjdk-amd64/bin:$PATH",
              "JAVA_HOME": "/usr/lib/jvm/java-8-openjdk-amd64" }

build (
	apt-get update
	apt-get install --yes software-properties-common python-software-properties
	add-apt-repository --yes ppa:openjdk-r/ppa
	apt-get update
	apt-get --yes --no-install-recommends install openjdk-8-jdk
)
then import the package:
cd openjdk/
apc package build openjdk-1.8.0-ppa.conf
then add or update your package resolution policy to have the java-1.8 resolve to the package that we just created:
if (dependency equals runtime.java-1.8)
{
	package.default "package::/apcera/pkg/runtimes::openjdk-1.8.0-ppa"
}
Now that we have taken care of that, jump back to where you probably were
