FIO is a tool for benchmarking storage devices. FIO helps to assess the storage performance in terms of IOPS and latency.
Fio-plot generates charts from FIO storage benchmark data. It can process FIO output in JSON format. It can also process FIO log file output (in CSV format).
To get to these charts, you need to follow this process:
- Run your tests, maybe use the included benchmark script
- Determine which information you would like to show
- Run fio-plot to generate the images with the appropriate command line options
This kind of chart shows both IOPs and Latency for multiple queue depths.
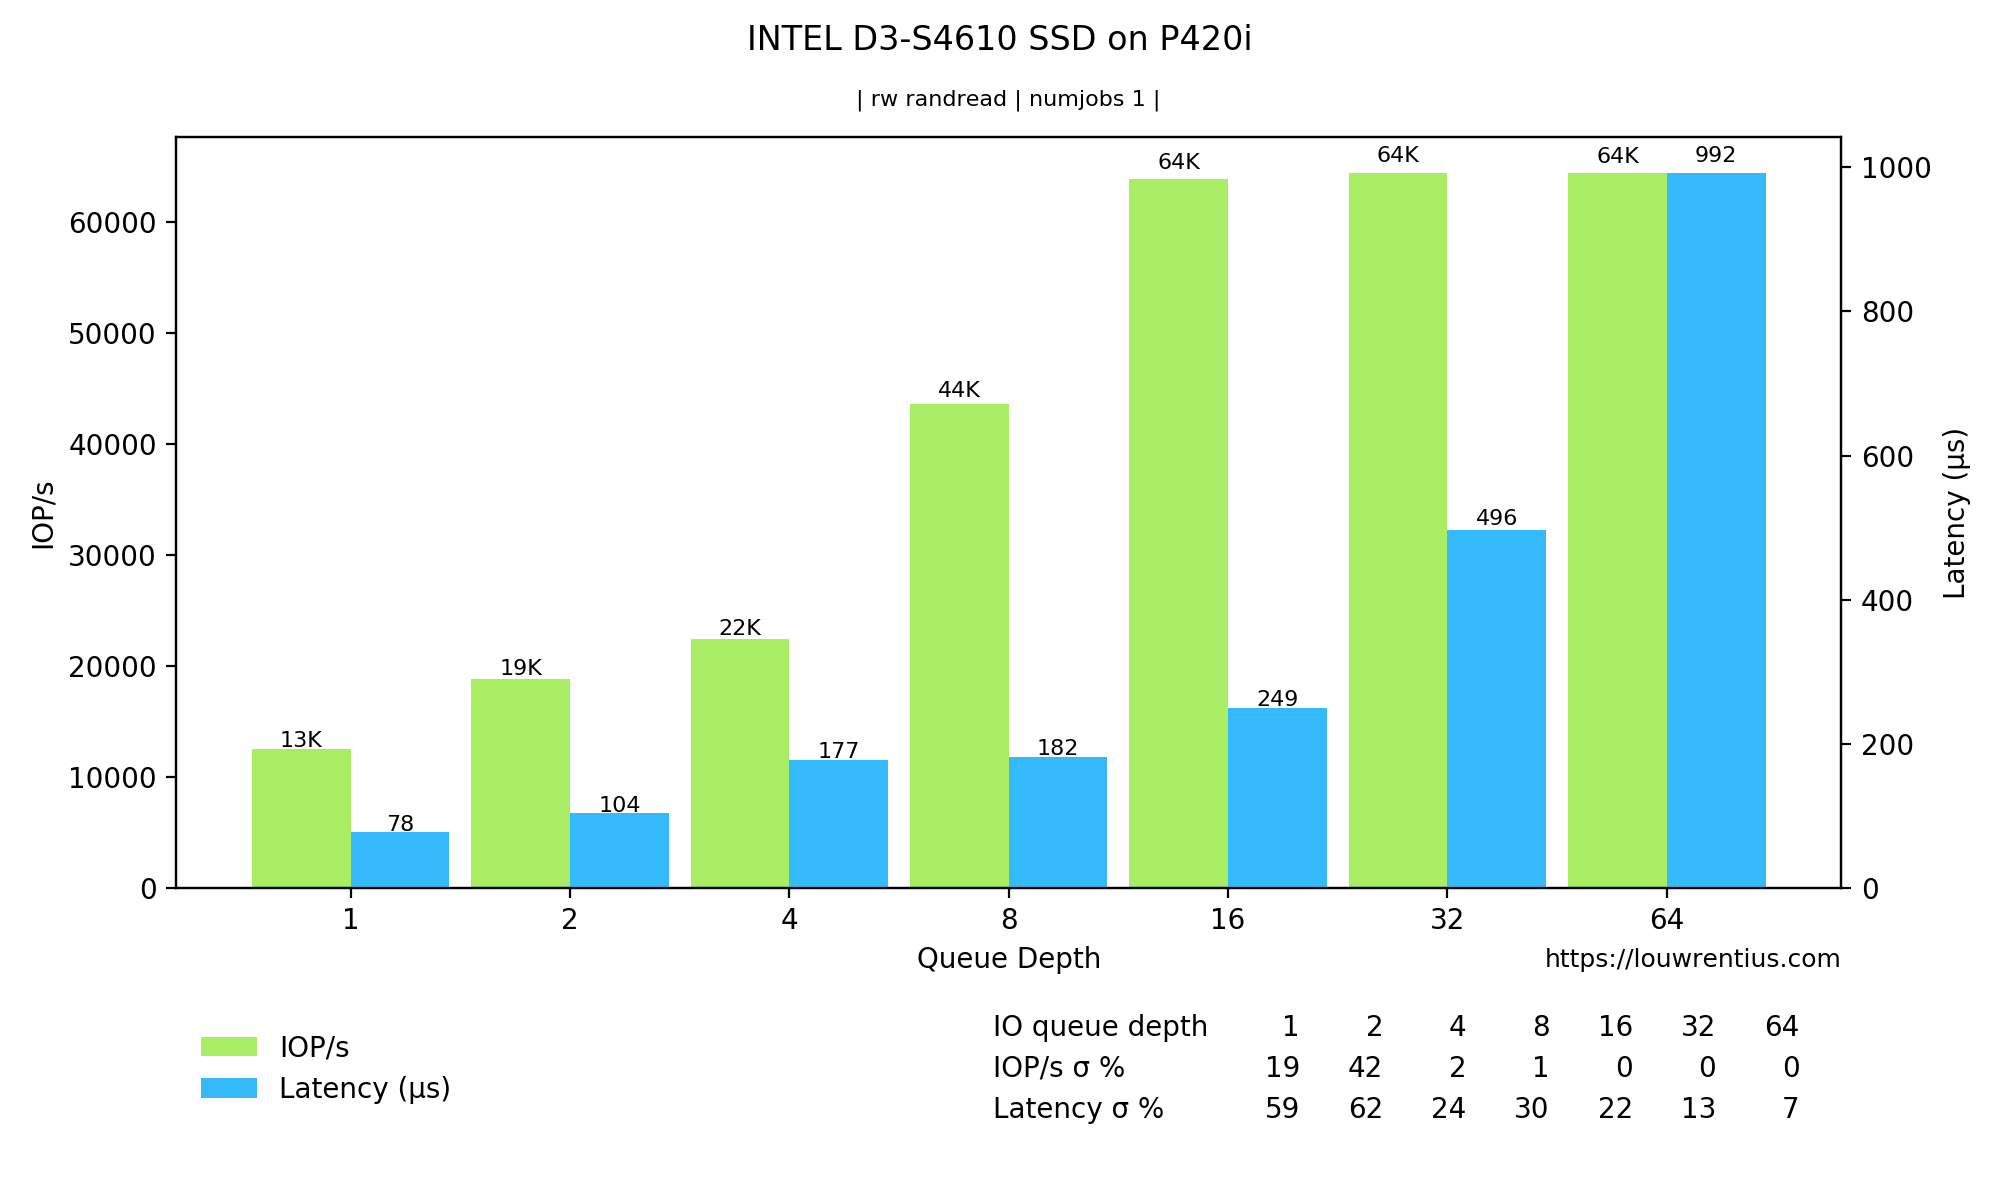
Please note that these benchmark numbers are not representative of the capabilities of the SSD as the RAID controller is the bottleneck.
A 3D bar chart that plots both queue depth an numjobs against either latency or IOPs.
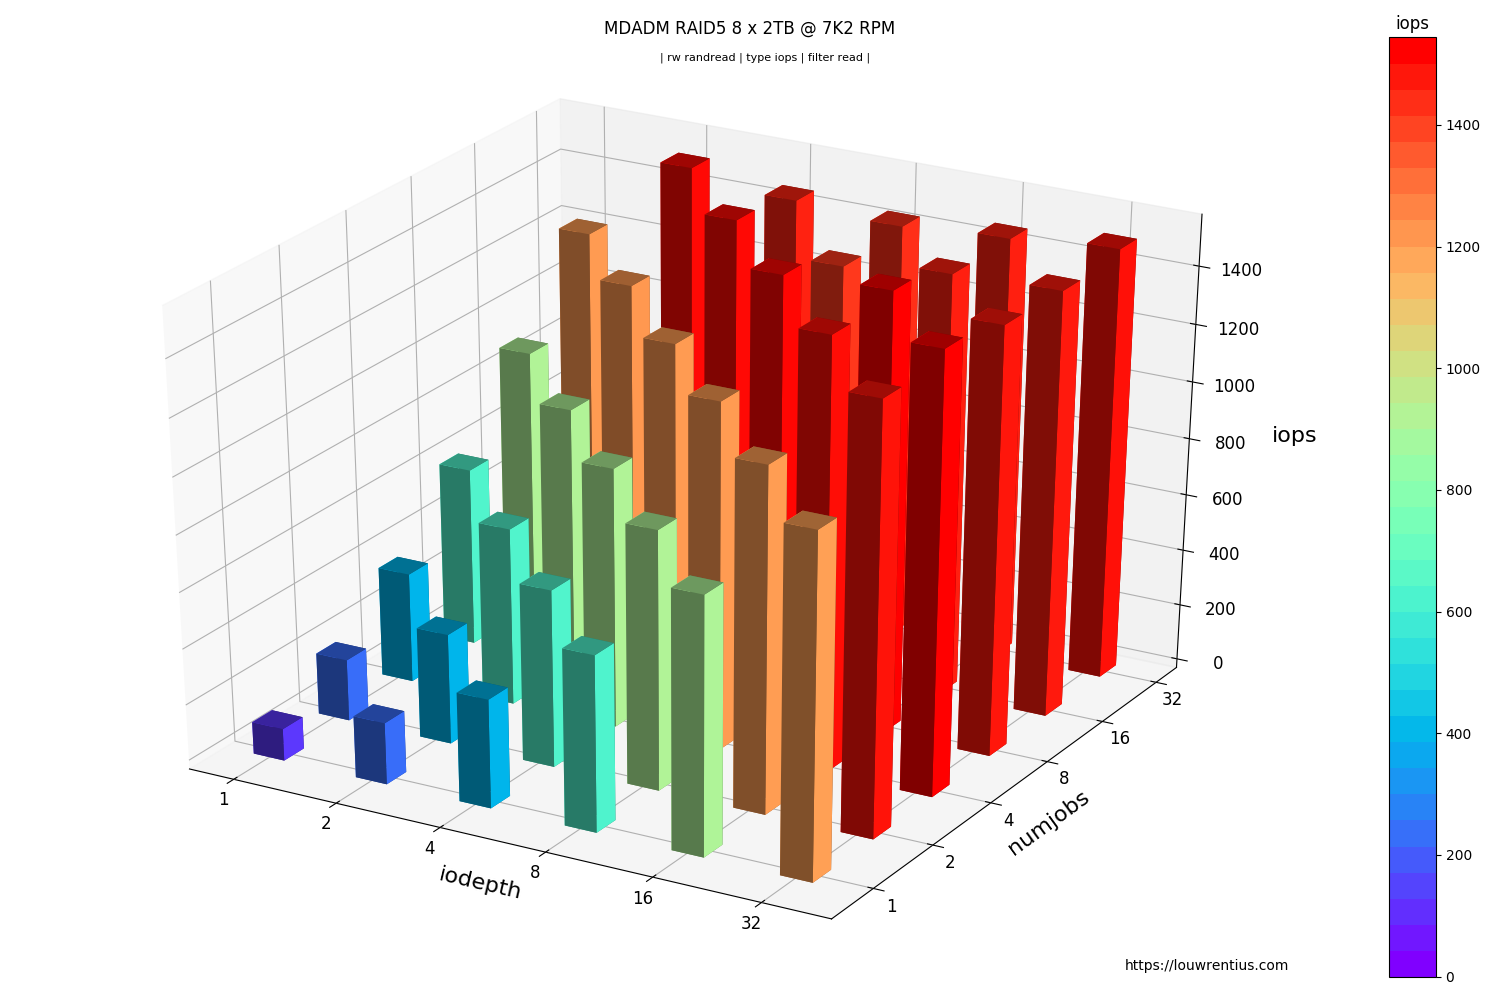
To create this graph, the FIO log data is parsed to show how the device / file
performed during a benchmark run. Latency IOPS and bandwidth can be shown.

The command line options control which data is shown, so it is possible to customize the graph to only show the information you're interested in.
tip: with the latest version of fio-plot, you can combine log data with the same properties by specifying multiple directories with the -i option.
This could be very handy if you made some performance tweaks and want to compare results.
The FIO JSON output also contains latency histogram data. It's available in a ns, us and ms scale.
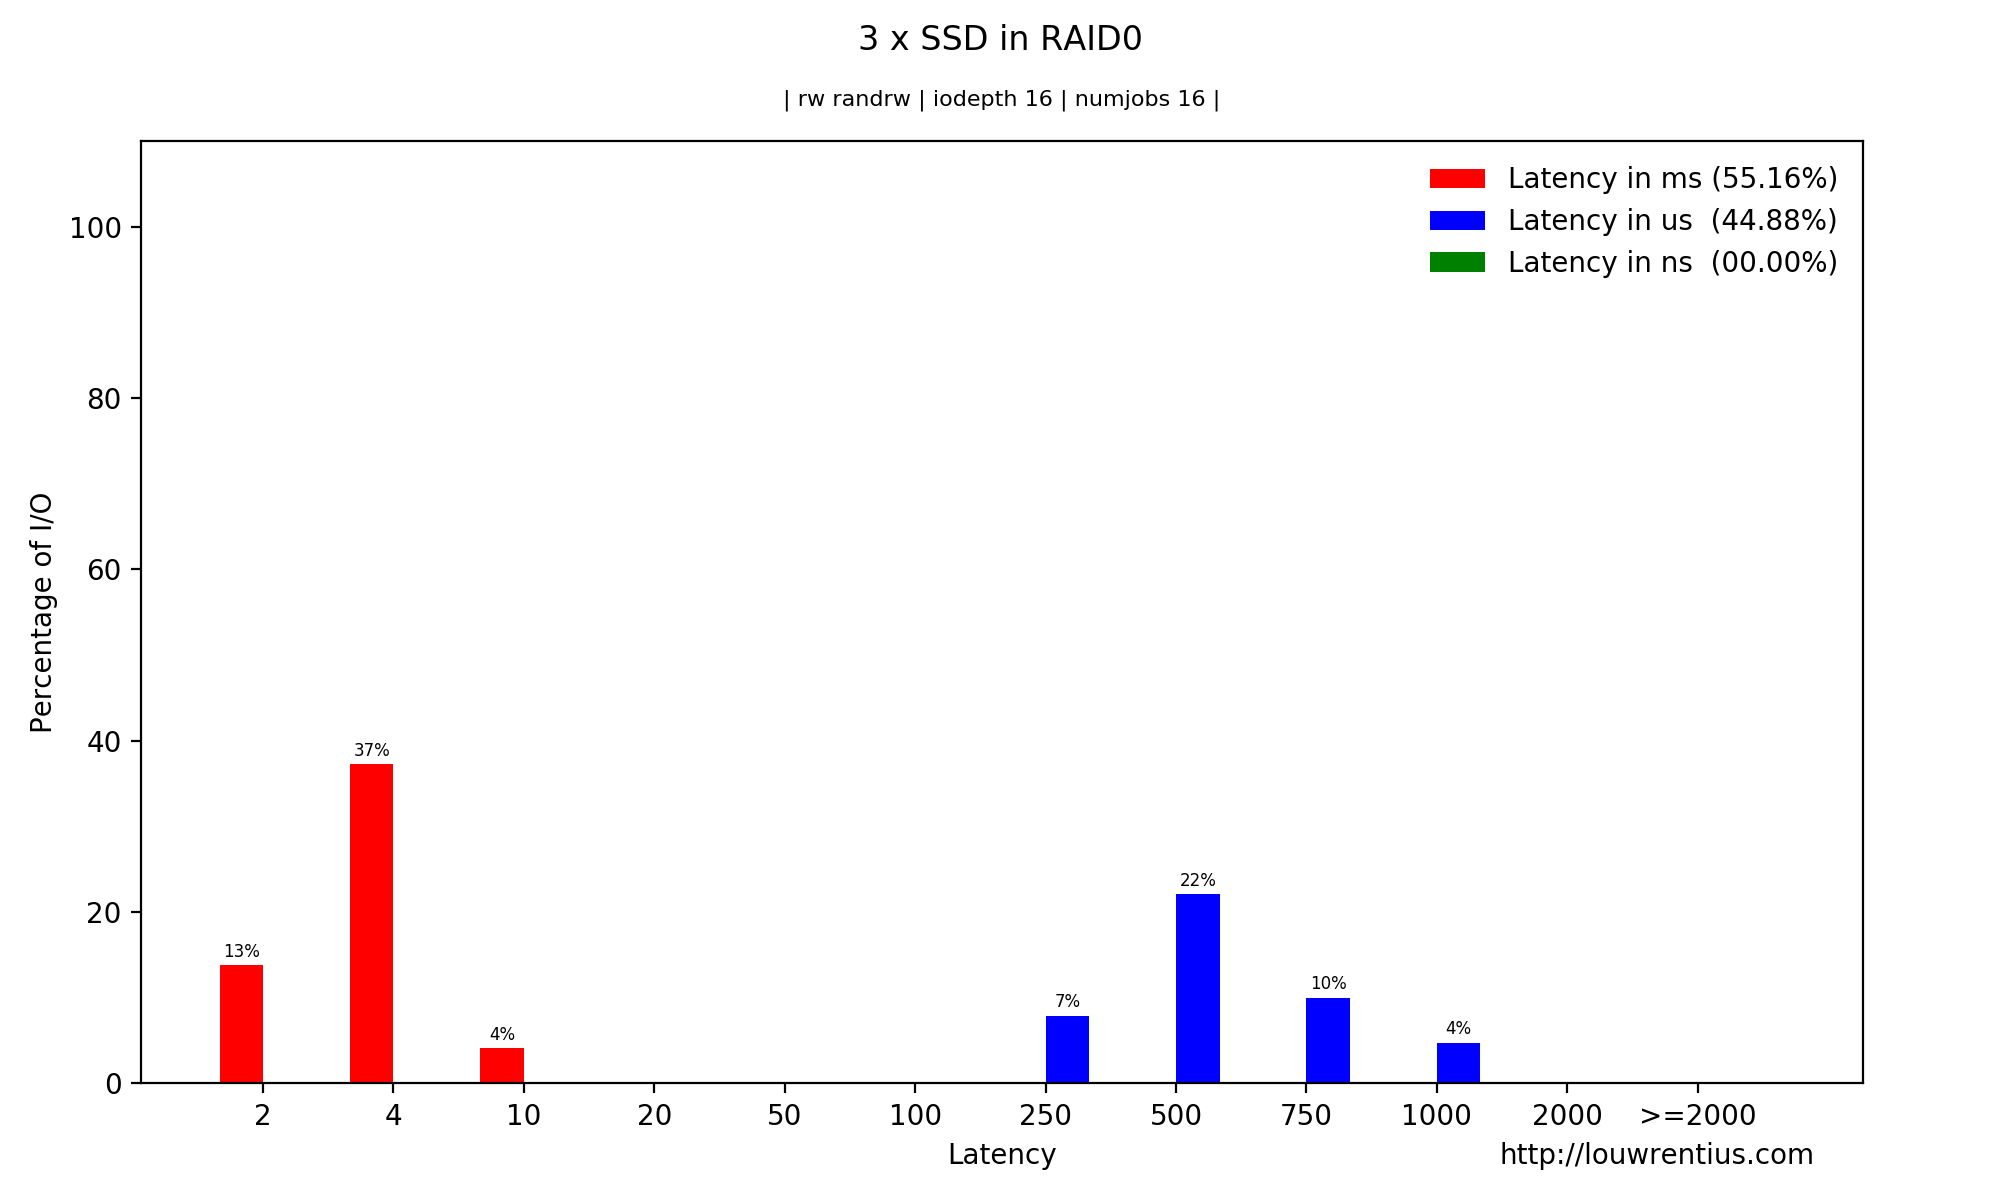
This is the only chart type that requires / can only show the results of a single benchmark.
A benchmark script is provided alongside fio-plot, that automates the process of running multiple benchmarks with different parameters. For example, it allows you to gather data for different queue depths and/or number of simultaneous jobs. The benchmark script shows progress in real-time.
████████████████████████████████████████████████████
		+++ Fio Benchmark Script +++

Job template:                  fio-job-template.fio
I/O Engine:                    libaio
Number of benchmarks:          98
Estimated duration:            1:38:00
Devices to be tested:          /dev/md0
Test mode (read/write):        randrw
IOdepth to be tested:          1 2 4 8 16 32 64
NumJobs to be tested:          1 2 4 8 16 32 64
Blocksize(s) to be tested:     4k
Mixed workload (% Read):       75 90

████████████████████████████████████████████████████
4% |█                        | - [0:04:02, 1:35:00]-]
This particular example benchmark was run with these parameters:
./bench_fio --target /dev/md0 --type device --template fio-job-template.fio --mode randrw --output RAID_ARRAY --readmix 75 90
In this example, we run a mixed random read/write benchmark. We have two runs, one with a 75%/25 read/write mix and one with a 90%/10% mix.
You can run the benchmark against an entire device or a file/folder. Alongside the benchmark script, a Fio job template file is supplied (fio-job-template.fio). This file can be customised as desired.
For more examples, please consult the separate README.md
Fio-plot requires 'matplotlib' and 'numpy' to be installed.
Please note that Fio-plot requires at least matplotlib version 3.3.0
usage: fio_plot [-h] -i INPUT_DIRECTORY [INPUT_DIRECTORY ...] -T TITLE [-s SOURCE] (-L | -l | -H | -g)
                [--disable-grid] [--enable-markers] [--subtitle SUBTITLE] [-d IODEPTH [IODEPTH ...]] [-M [MAXDEPTH]]
                [-D [DPI]] [-p [PERCENTILE]] [-J [MAXJOBS]] [-n NUMJOBS [NUMJOBS ...]] -r
                {read,write,randread,randwrite,randrw} [-m MAX] [-y MAX_Y] [-x MIN_Y] [-e MOVING_AVERAGE]
                [-t {bw,iops,lat,slat,clat} [{bw,iops,lat,slat,clat} ...]] [-f {read,write} [{read,write} ...]]
                [-c LABEL_DEPTH] [--label-segment-size LABEL_SEGMENT_SIZE] [-w LINE_WIDTH]

Generates charts/graphs from FIO JSON output or logdata.

optional arguments:
-h, --help            show this help message and exit

Generic Settings:
-i INPUT_DIRECTORY [INPUT_DIRECTORY ...], --input-directory INPUT_DIRECTORY [INPUT_DIRECTORY ...]
                        input directory where JSON files or log data (CSV) can be found.
-T TITLE, --title TITLE
                        specifies title to use in charts
-s SOURCE, --source SOURCE
                        Author
-L, --iodepth-numjobs-3d
                        Generates a 3D-chart with iodepth and numjobs on x/y axis and iops or latency on the z-axis.
-l, --latency-iops-2d
                        Generates a 2D barchart of IOPs and latency for a particular queue depth and numjobs value.
-H, --histogram       Generates a latency histogram for a particular queue depth and numjobs value.
-g, --loggraph        This option generates a 2D graph of the log data recorded by FIO.
--disable-grid        Disables the dotted grid in the output graph.
--enable-markers      Enable markers for the plot lines when graphing log data.
--subtitle SUBTITLE   Specify your own subtitle or leave it blank with double quotes.
-d IODEPTH [IODEPTH ...], --iodepth IODEPTH [IODEPTH ...]
                        The I/O queue depth to graph.
-M [MAXDEPTH], --maxdepth [MAXDEPTH]
                        Maximum queue depth to graph in 3D graph.
-D [DPI], --dpi [DPI]
                        The chart will be saved with this DPI setting. Higher means larger image.
-p [PERCENTILE], --percentile [PERCENTILE]
                        Calculate the percentile, default 99.99th.
-J [MAXJOBS], --maxjobs [MAXJOBS]
                        Maximum number of jobs to graph in 3D graph.
-n NUMJOBS [NUMJOBS ...], --numjobs NUMJOBS [NUMJOBS ...]
                        Specifies for which numjob parameter you want the 2d graphs to be generated. You can specify
                        multiple values separated by spaces.
-r {read,write,randread,randwrite,randrw}, --rw {read,write,randread,randwrite,randrw}
                        Specifies the kind of data you want to graph.
-m MAX, --max MAX     Optional maximum value for Z-axis in 3D graph.
-y MAX_Y, --max-y MAX_Y
                        Optional maximum value for y-axis.
-x MIN_Y, --min-y MIN_Y
                        Optional minimal value for y-axis. Use 'None' to disable.
-e MOVING_AVERAGE, --moving-average MOVING_AVERAGE
                        The moving average helps to smooth out graphs, the argument is the size of the moving window
                        (default is None to disable). Be carefull as this setting may smooth out issues you may want
                        to be aware of.
-t {bw,iops,lat,slat,clat} [{bw,iops,lat,slat,clat} ...], --type {bw,iops,lat,slat,clat} [{bw,iops,lat,slat,clat} ...]
                        This setting specifies which kind of metric you want to graph.
-f {read,write} [{read,write} ...], --filter {read,write} [{read,write} ...]
                        filter should be read/write.
-c LABEL_DEPTH, --label-depth LABEL_DEPTH
                        use the parent folder(s) to make the label unique. The number represents how many folders up
                        should be included. Used with -g.
--label-segment-size LABEL_SEGMENT_SIZE
                        Truncate folder names to make labels fit the graph. Disabled by default. The number represents
                        how many characters per segment are preserved. Used with -g.
-w LINE_WIDTH, --line-width LINE_WIDTH
                        Line width for line graphs. Can be a floating-point value. Used with -g.
Creating a 2D Bar Chart based on randread data and numjobs = 1.
./fio_plot -i <benchmark_data_folder> -T "Title" -s https://louwrentius.com -l -n 1 -r randread
Creating a 3D graph showing IOPS.
./fio_plot -i <benchmark_data_folder> -T "Title" -s https://louwrentius.com -L -r randread -t iops
Creating a 3D graph with a subselection of data
./fio_plot -i <benchmark_data_folder> -T "Title" -s https://louwrentius.com -L -r randread -t iops -J 16 -M 16
Creating a latency histogram with a queue depth of 1 and numjobs is 1.
./fio_plot -i <benchmark_data_folder> -T "Title" -s https://louwrentius.com -H -r randread -d 1 -n 1
Creating a line chart from different benchmark runs in a single folder
./fio_plot -i <benchmark_data_folder> -T "Test" -g -r randread -t iops lat -d 1 8 16 -n 1
The same result but if you want markers to help distinguish between lines:
./fio_plot -i <benchmark_data_folder> -T "Test" -g -r randread -t iops lat -d 1 8 16 -n 1 --enable--markers
Create a line chart based on data from two different folders (but the same benchmark parameters)
./fio_plot -i <benchmark_data_folder A> <benchmark_data_folder B> -T "Test" -g -r randread -t iops lat -d 8 -n 1
I'm assuming that the benchmark was created with the (included) bench_fio tool.
For example, you can run a benchmark on a RAID10 setup and store data in folder A. Store the benchmark data for a RAID5 setup in folder B and you can compare the results of both RAID setups in a single Line graph.
Please note that the folder names are used in the graph to distinguish the datasets.
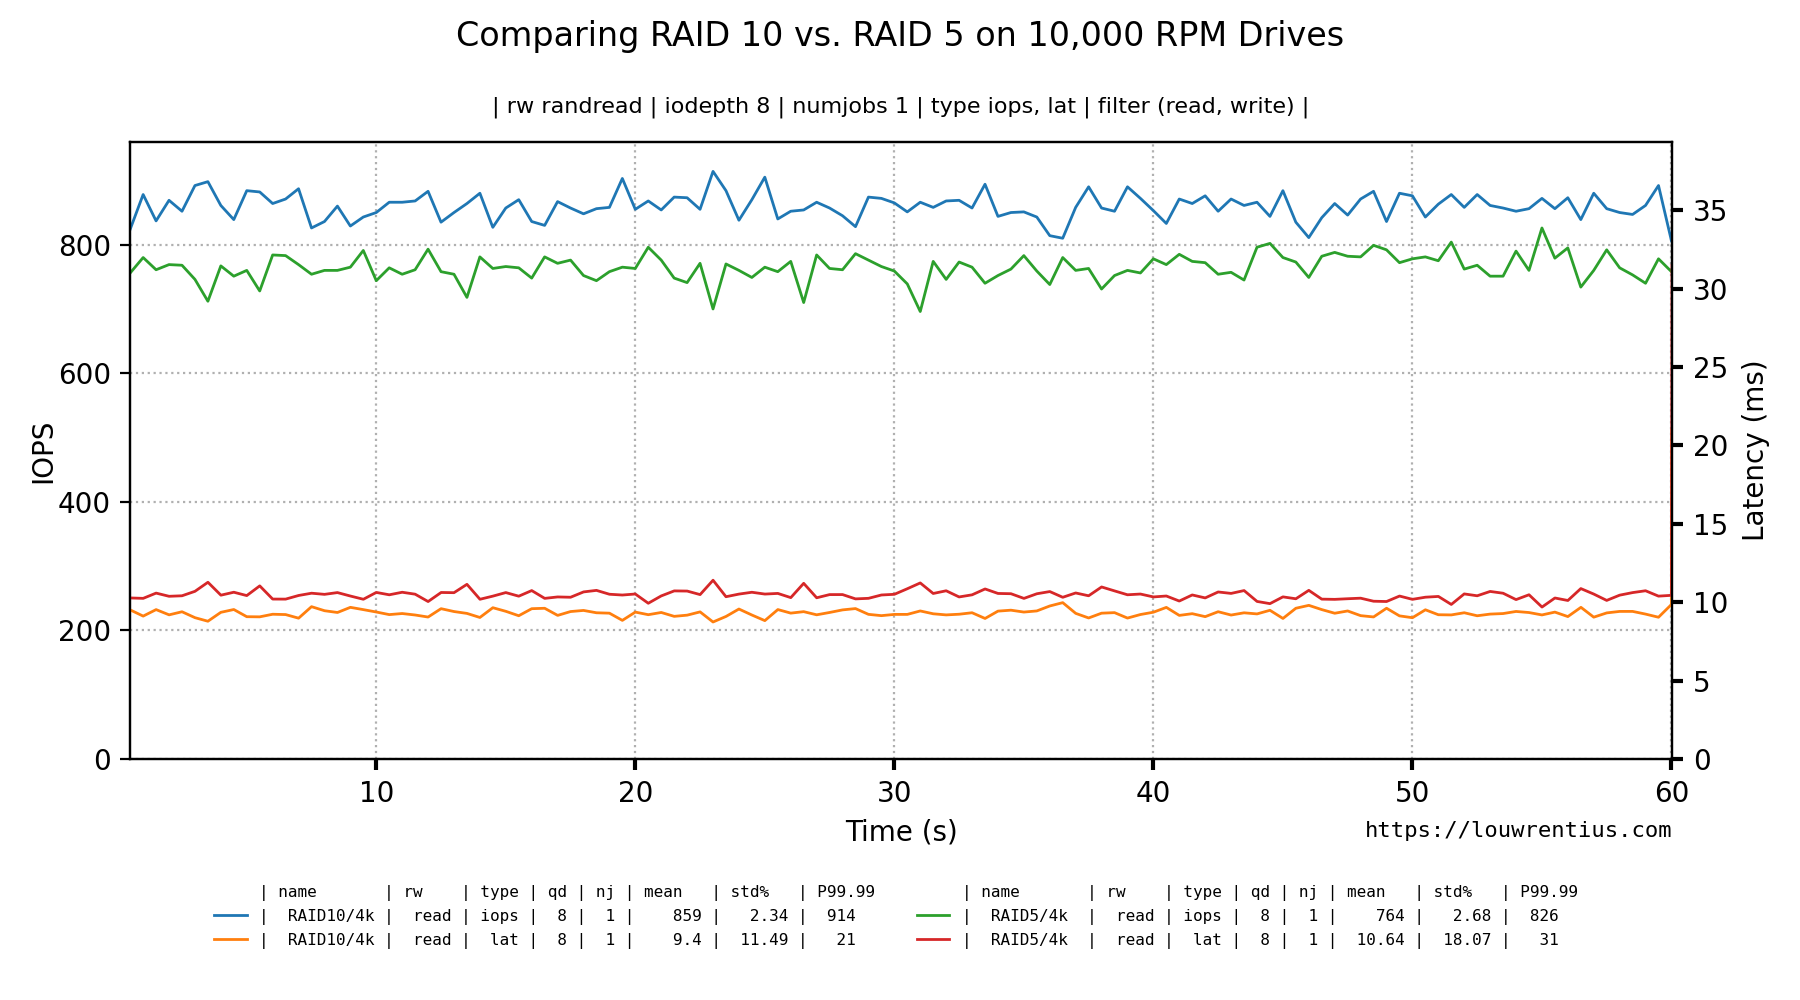
Command used:
fio_plot -i ./IBM1015/RAID10/4k/ ./IBM1015/RAID5/4k/ -T "Comparing RAID 10 vs. RAID 5 on 10,000 RPM Drives" -s https://louwrentius.com -g -r randread -t iops lat -d 8 -n 1
If you use the bench_fio tool to generate benchmark data, you may notice that you end up with folders like:
IBM1015/RAID10/4k
IBM1015/RAID5/4k
Those parent folders are used to distinguish and identify the lines from each other. The labels are based on the parent folder names as you can see in the graph. By default, we use only one level deep, so in this example only RAID10/4k or RAID5/4k are used. If we want to include the folder above that (IBM1015) we use the --label-depth parameter like so:
fio_plot -i ./IBM1015/RAID10/4k/ ./IBM1015/RAID5/4k/ -T "Comparing RAID 10 vs. RAID 5 on 10,000 RPM Drives" -s https://louwrentius.com -g -r randread -t iops lat -d 8 -n 1 -w 1 --label-depth 2
This would look like:

Fio-plot parses the filename of the generated .log files. The format is:
[rwmode]-iodepth-[iodepth]-nujobs-[numjobs]_[fio generated type].[numbjob job id].log
An example:
randwrite-iodepth-8-numjobs-8_lat.1.log
randwrite-iodepth-8-numjobs-8_lat.2.log
randwrite-iodepth-8-numjobs-8_lat.3.log
randwrite-iodepth-8-numjobs-8_lat.4.log
randwrite-iodepth-8-numjobs-8_lat.5.log
randwrite-iodepth-8-numjobs-8_lat.6.log
randwrite-iodepth-8-numjobs-8_lat.7.log
randwrite-iodepth-8-numjobs-8_lat.8.log
In this example, there are 8 files because numjobs was set to 8. Fio autoamatically generates a file for each job. It's important that - if you don't use the included benchmark script - to make sure files are generated with the appropriate file name structure.