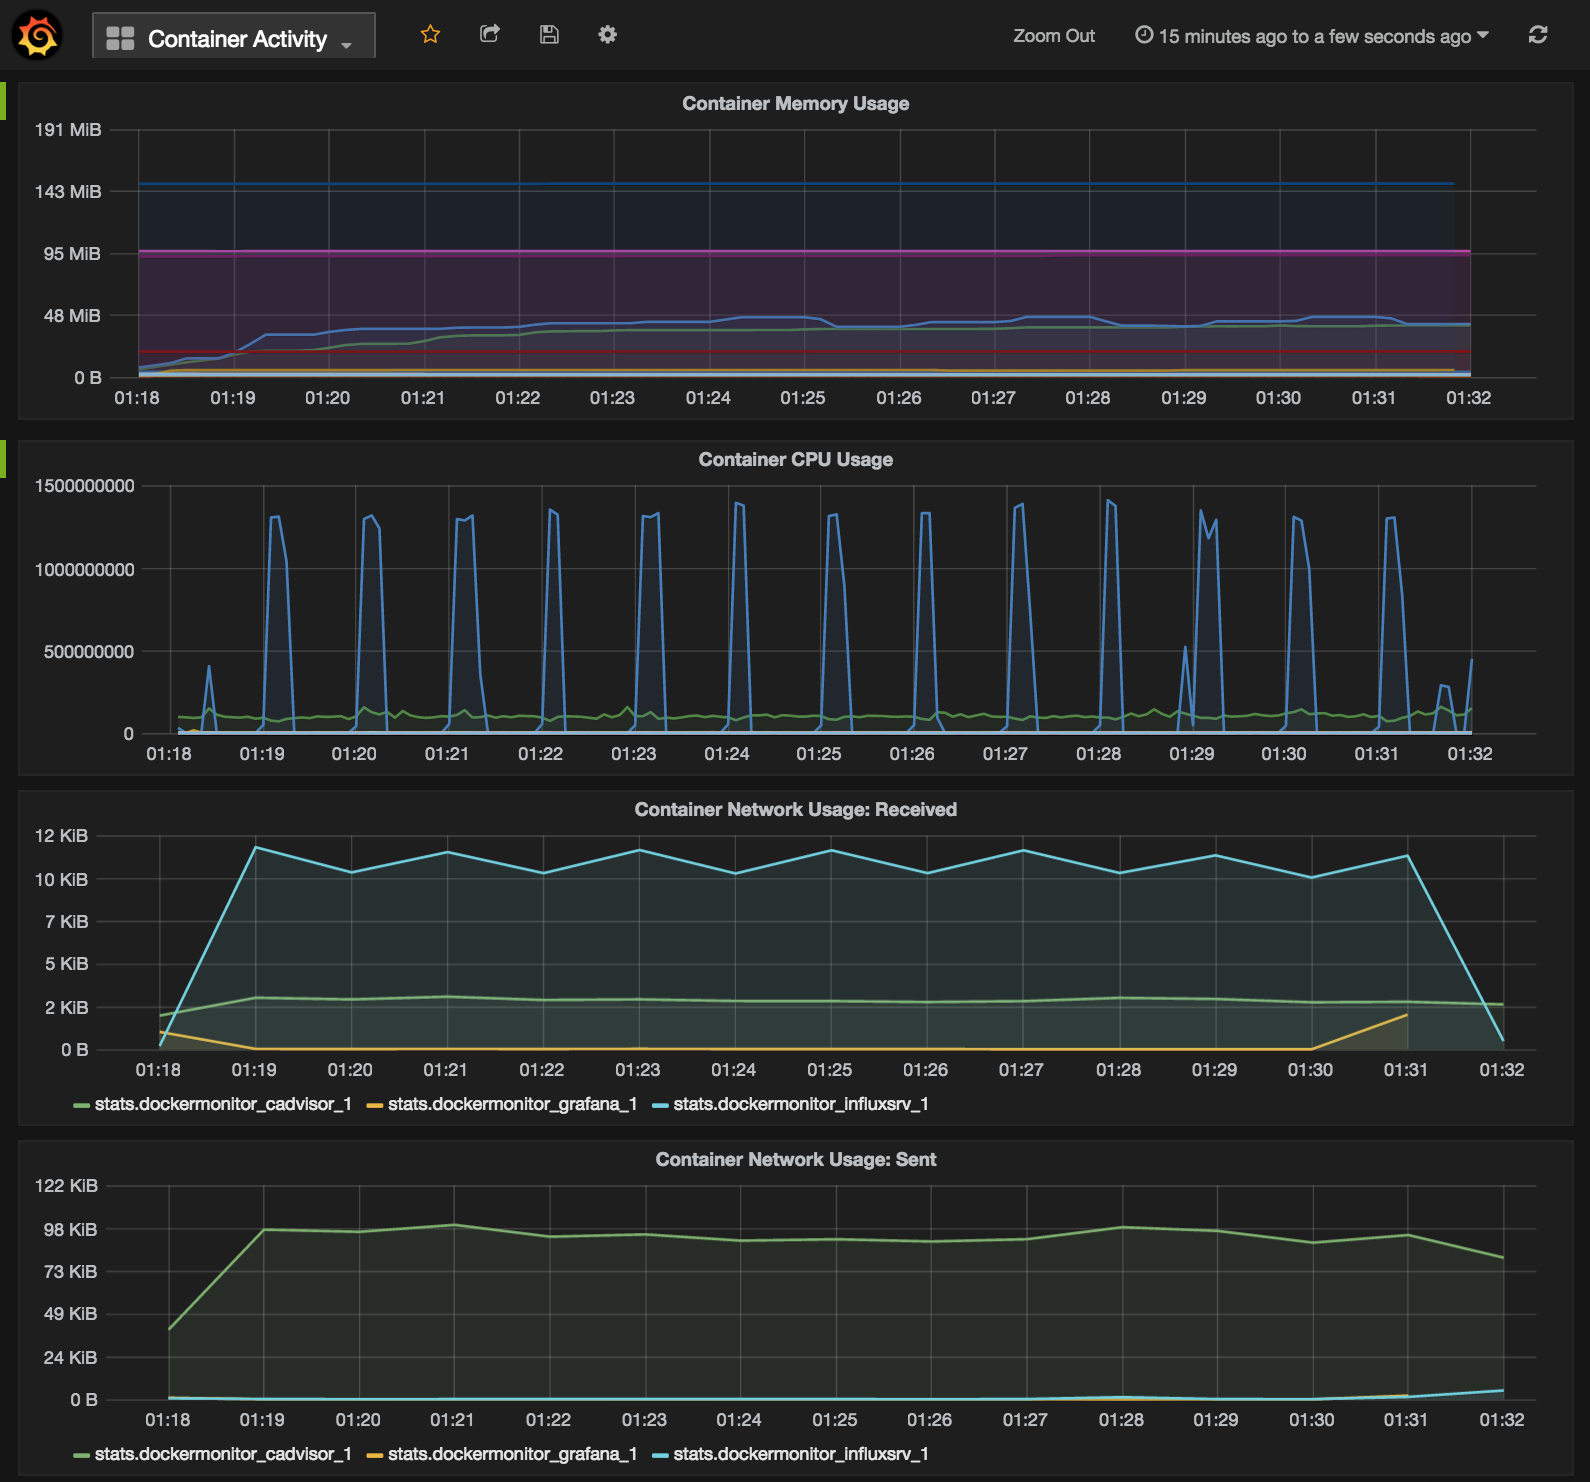
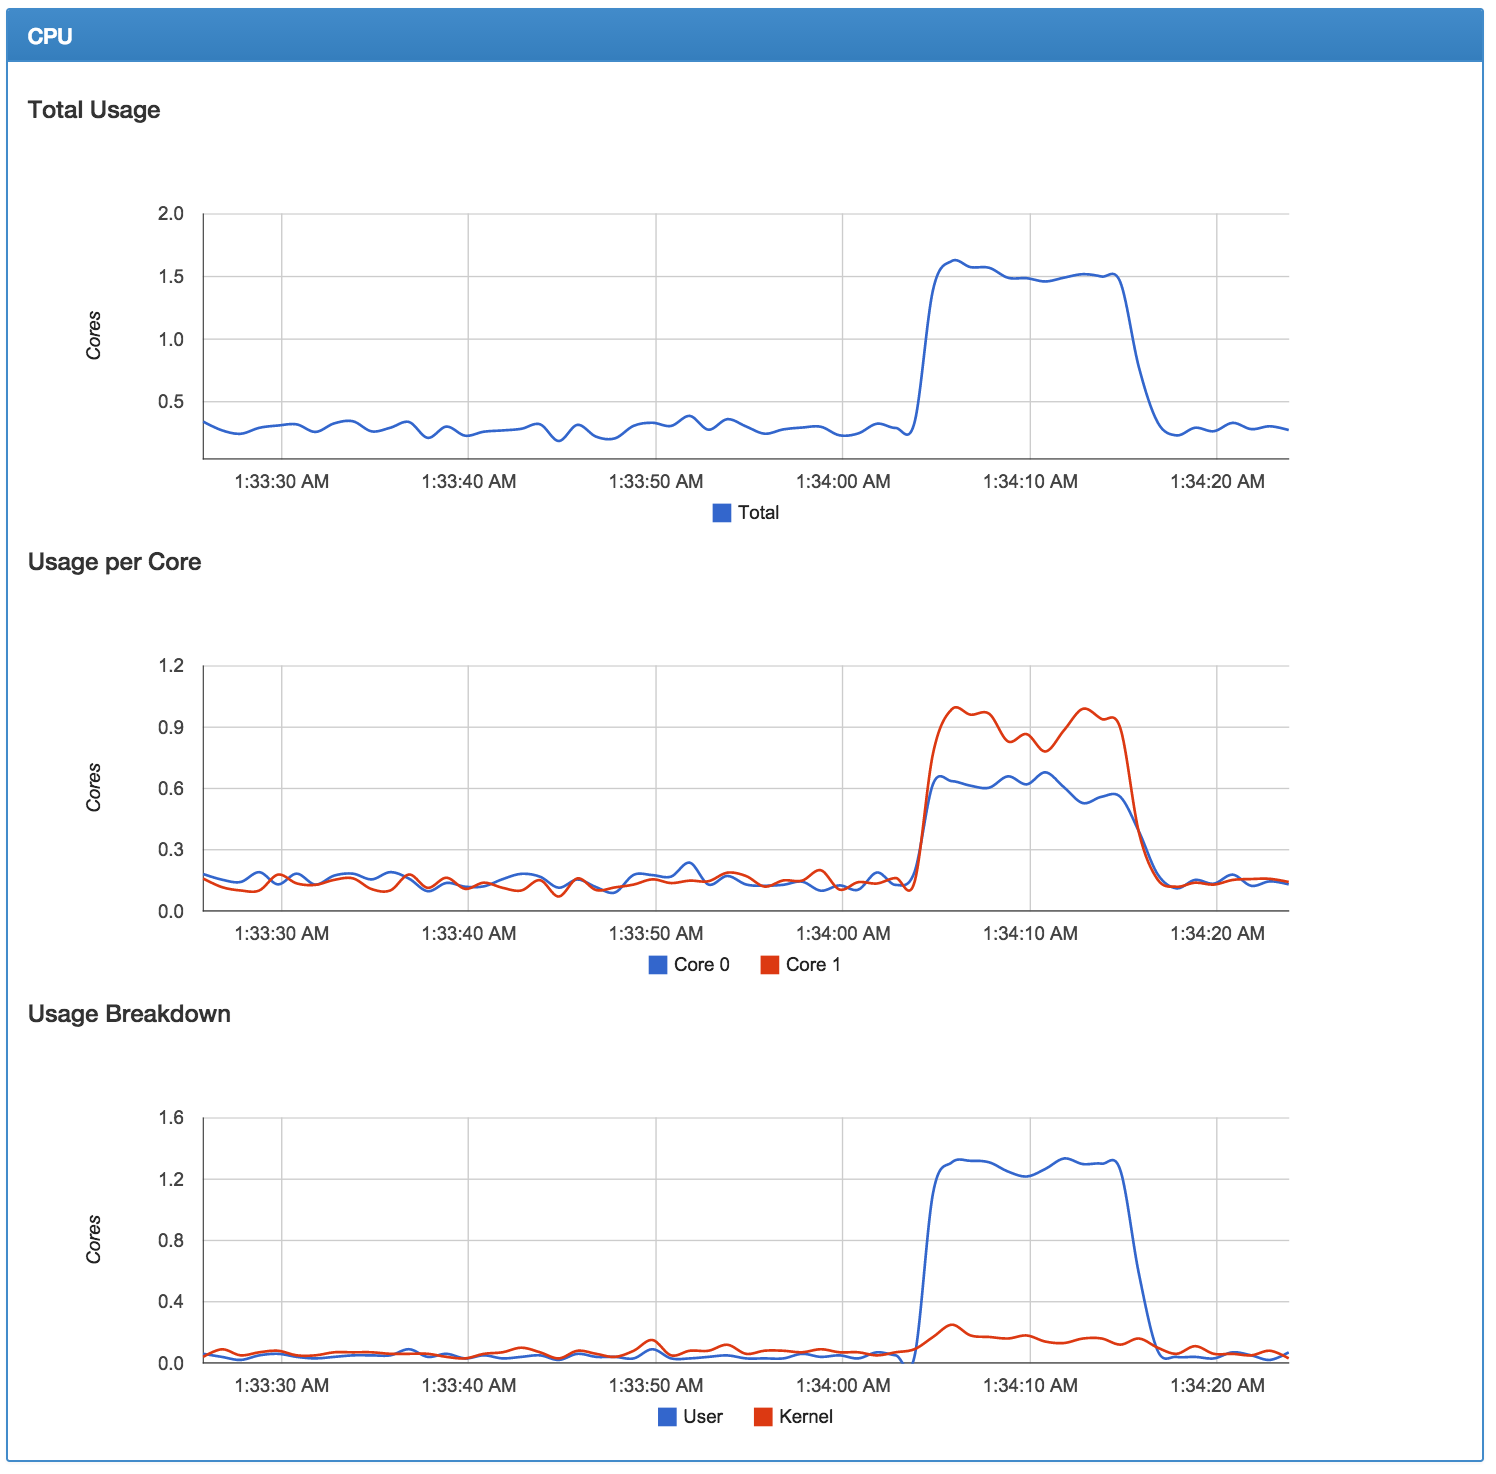
Monitor real-time and historical memory, cpu, and network usage of your Docker containers.
Launch the cAdvisor monitoring service with an InfluxDB storage backend and Grafana web-based dashboard with a simple command. Everything runs in Docker containers, so you don't need to install anything. Several Grafana dashboards are created for you: one showing all containers, and one for each.
docker-compose.yml is a Docker Compose definition that starts the three services in containers and wires them together for you.
Read docker-compose.README.md for details.
Once cAdvisor is writing to InfluxDB, you'll need to configure Grafana to connect to InfluxDB, then load up your team's shared Dashboards.
create-dashboareds.sh ensures that an InfluxDB database and user exists, that Grafana has a data store that points to it, and all Grafana dashboards are created.
Read create-dashboards.README.md for details.
TODO: Update screenshots
Try out the "All Containers (Stacked)" dashboard, which shows the CPU, memory, and network activity for all of your Docker containers.
Note about Container Network Usage: if you use --net=host option in Docker,
each container is reporting all traffic on the shared network interface, so you'll
lose per-container visibility. You'll need to click on a single container to see
the proper sum of all.
-
Start your monitoring Docker cluster. The first time you run this might take a little while, since Composer will need to download Docker images from the Docker Hub:
docker-compose up -
Wait 10 seconds, so the services have time to start.
-
Run this command, which will set up Grafana to talk with InfluxDB, and create dashboards for any existing Docker containers:
./create-dashboards.sh -
View your new Grafana dashboard at http://localhost:3000 with admin/admin
- View your new cAdvisor realtime performance monitoring dashboard at
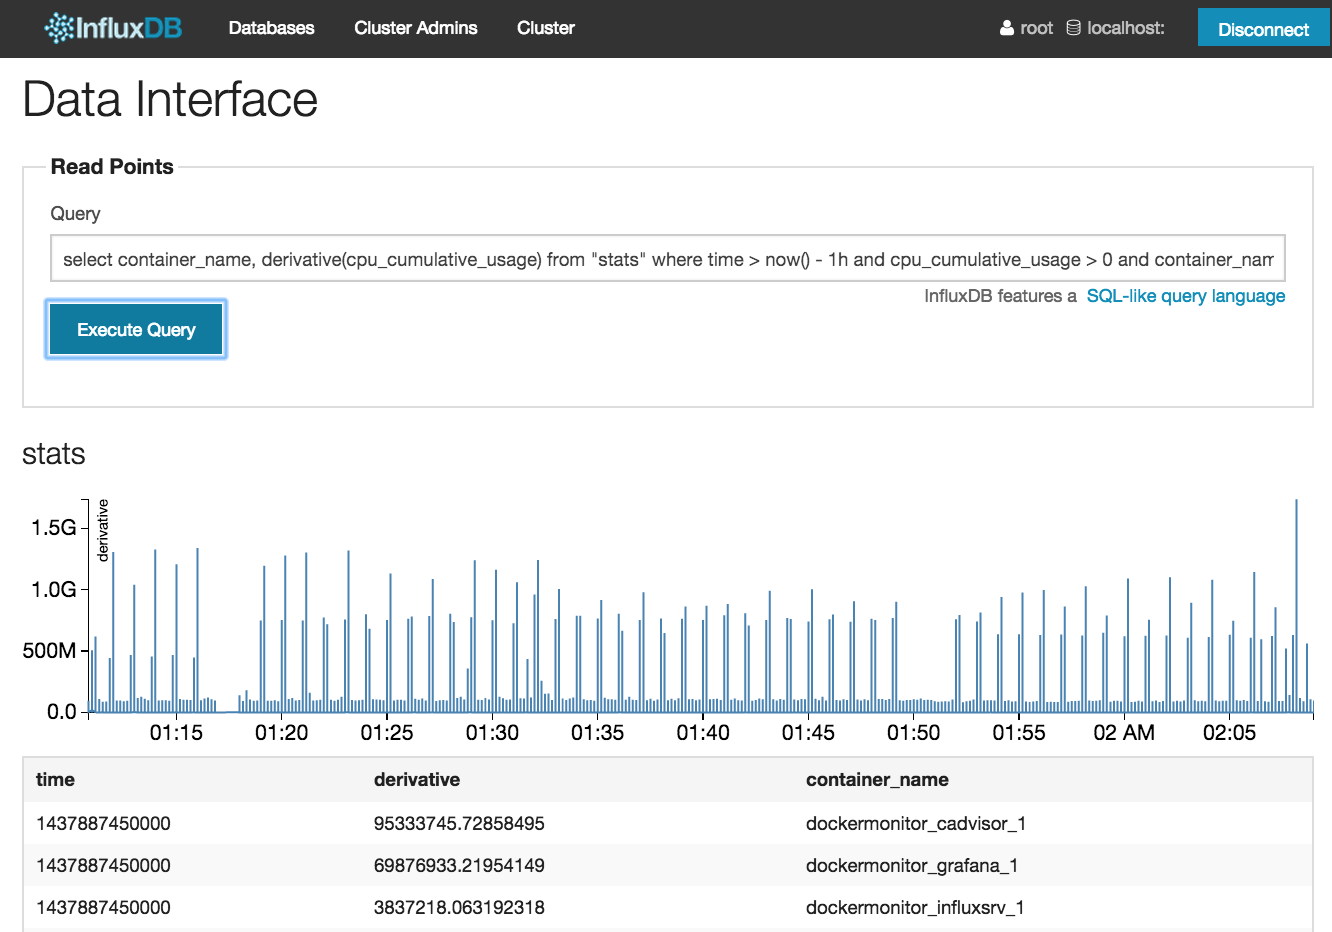
- Query for specific metrics using your new InfluxDB instance at http://localhost:8083.
-
Re-run the shell script at any point, to create dashboards for all of the currently-running Docker containers
./create-dashboards.sh


