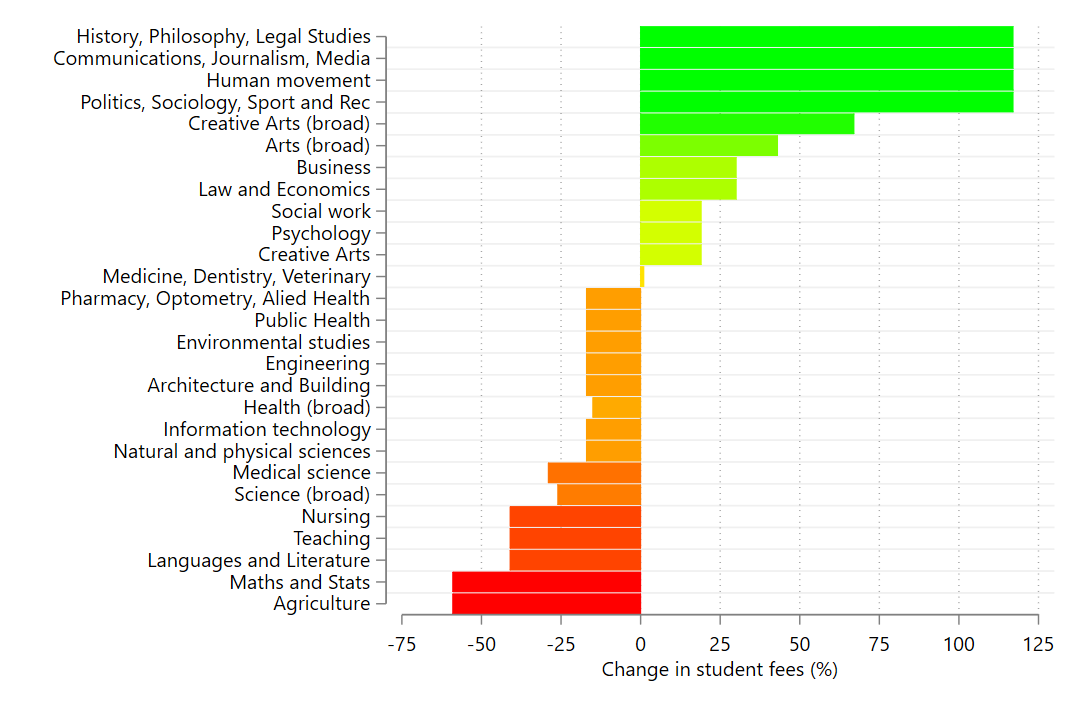
This is an example of the code needed to create a Stata bar chart with conditional colouring of the plotted bars.
Note: colour gradients were introduced only in Stata 18. The code will not work with earlier versions of Stata.
You can either download the do-file in the repo, or paste the following code directly into Stata.
webuse set https://www.jankabatek.com/datasets/
webuse gradient_data, clear

twoway bar FEE_CHANGE id, colorvar(FEE_CHANGE) colorstart(red) colorend(lime) colorcuts(-75(1)75) clegend(off) barwidth(0.9) horizontal ylabel(1(1)27,val labs(small)) ytitle("") xtitle("Change in student fees (%)") xlabel(-75(25)125) name(GRDNT1,replace)
The same command using the do-file syntax:
webuse set https://www.jankabatek.com/datasets/
webuse gradient_data, clear

twoway bar FEE_CHANGE id, colorvar(FEE_CHANGE) colorstart(red) colorend(lime)    /// essential colour gradient options
   colorcuts(-75(1)75)                                                           /// finer gradient options. Try adding: colorrule(lin)
   clegend(off)                                                                  /// getting rid of the colour legend (it's messy)
   barwidth(0.9)                                                                 /// making the bars look nicer
   horizontal ylabel(1(1)27,val labs(small)) ytitle("")                          /// twoway options
   xtitle("Change in student fees (%)") xlabel(-75(25)125) name(GRDNT1,replace)
We can make the same chart using the plot suite. This way, we can combine the chart with other complex visual elements:
webuse set https://www.jankabatek.com/datasets/
webuse gradient_data, clear
net install plottabs, from("https://raw.githubusercontent.com/jankabatek/plotsuite/master/ado/") replace
ssc install schemepack

plotmeans FEE_CHANGE, over(id) clear gr(bar) ci(off) colorvar(y_val1) colorstart(red) colorend(lime) colorcuts(-75(1)75) clegend(off) scheme(white_tableau)	barwidth(0.9) horizontal ylabel(1(1)27,val labs(small)) ytitle("") xtitle("Change in student fees (%)") xlabel(-75(25)125) name(GRDNT2,replace)
The same command using the do-file syntax:
webuse set https://www.jankabatek.com/datasets/
webuse gradient_data, clear
net install plottabs, from("https://raw.githubusercontent.com/jankabatek/plotsuite/master/ado/") replace
ssc install schemepack

plotmeans FEE_CHANGE, over(id) clear gr(bar) ci(off)                    /// plotmeans options
   colorvar(y_val1) colorstart(red) colorend(lime)                      /// essential colour gradient options (note the different variable in colorvar - this is because plotmeans stores the plotted data in a separate frame with standardized variable names)
   colorcuts(-75(1)75)                                                  /// finer gradient options. Try adding: colorrule(lin)
   clegend(off)                                                         /// getting rid of the colour legend (it's messy)
   barwidth(0.9)                                                        /// making the bars look nicer
   scheme(white_tableau)                                                /// nicer scheme, thx to Asjad
   horizontal ylabel(1(1)27,val labs(small)) ytitle("")                 /// twoway options
   xtitle("Change in student fees (%)") xlabel(-75(25)125) name(GRDNT2,replace)
We can also make the same chart using the coefplot. Doing so however requires running regressions / creating matrices (see below):
webuse set https://www.jankabatek.com/datasets/
webuse gradient_data, clear
ssc install coefplot
ssc install schemepack

reg FEE_CHANGE ibn.id, nocons

coefplot, recast(bar) grid(between glpattern(solid) glcolor(gs15)) colorvar(FEE_CHANGE) colorstart(red) colorend(lime) colorcuts(-75(1)75) clegend(off) barwidth(0.9) scheme(white_tableau)	 xtitle("Change in student fees (%)") xlabel(-75(25)125) name(GRDNT3,replace)
The same command using the do-file syntax:
webuse set https://www.jankabatek.com/datasets/
webuse gradient_data, clear
ssc install coefplot
ssc install schemepack

reg FEE_CHANGE ibn.id, nocons

coefplot, recast(bar) grid(between glpattern(solid) glcolor(gs15))      /// coefplot options (incl. nicer horizontal grid lines)
   colorvar(FEE_CHANGE) colorstart(red) colorend(lime)                  /// essential colour gradient options
   colorcuts(-75(1)75)                                                  /// finer gradient options. Try adding: colorrule(lin)
   clegend(off)                                                         /// getting rid of the colour legend (it's messy)
   barwidth(0.9)                                                        /// making the bars look nicer
   scheme(white_tableau)                                                /// nicer scheme, thx to Asjad
   xtitle("Change in student fees (%)") xlabel(-75(25)125) name(GRDNT3,replace)
