Installation | Documentation | Blog | Slack | Twitter
Debugging microservices applications is a difficult task. The state of an application is spread across multiple processes, often on different nodes. It is hard to get the holistic view of an application's state. Certain tools exist for troubleshooting microservice issues. OpenTracing can be used to produce transaction or workflow logs for post-mortem analysis. Service meshes like Istio can be used to monitor the network to identify latency problems. Unfortunately, these tools are passive, the feedback loop is slow, and they do not allow you to monitor and alter the application during run time.
In contrast, "traditional" debuggers for monolithic applications provide devs with powerful real-time investigation features. A developer working with monolithic applications has the powerful ability to set breakpoints throughout the application, follow variable values on the fly, step through the code, and change values during run time.
Squash brings the power of modern debuggers to developers of microservice apps. Squash bridges between the apps running in a Kubernetes environment (without modifying them) and the IDE. Users are free to choose which containers, pods, services or images they are interested in debugging, and are allowed to set breakpoints in their codes, follow values of their variables on the fly, step through the code while jumping between microservices, and change these values during run time.
Squash is built to be easily extensible. It is easy to add support for more languages, debuggers and IDEs.
To learn more about the motivation behind project squash, read our blog post or watch session (slides). We also encourage you to read squash technical overview blog.
To stay up-to-date with Squash, follow us @soloio_inc and join us on our slack channel.
- Debug running microservices
- Debug container in a pod
- Debug a service
- Set breakpoints
- Step through code
- View and modify values of variables
- ...anything you could do with a regular debugger, and more!
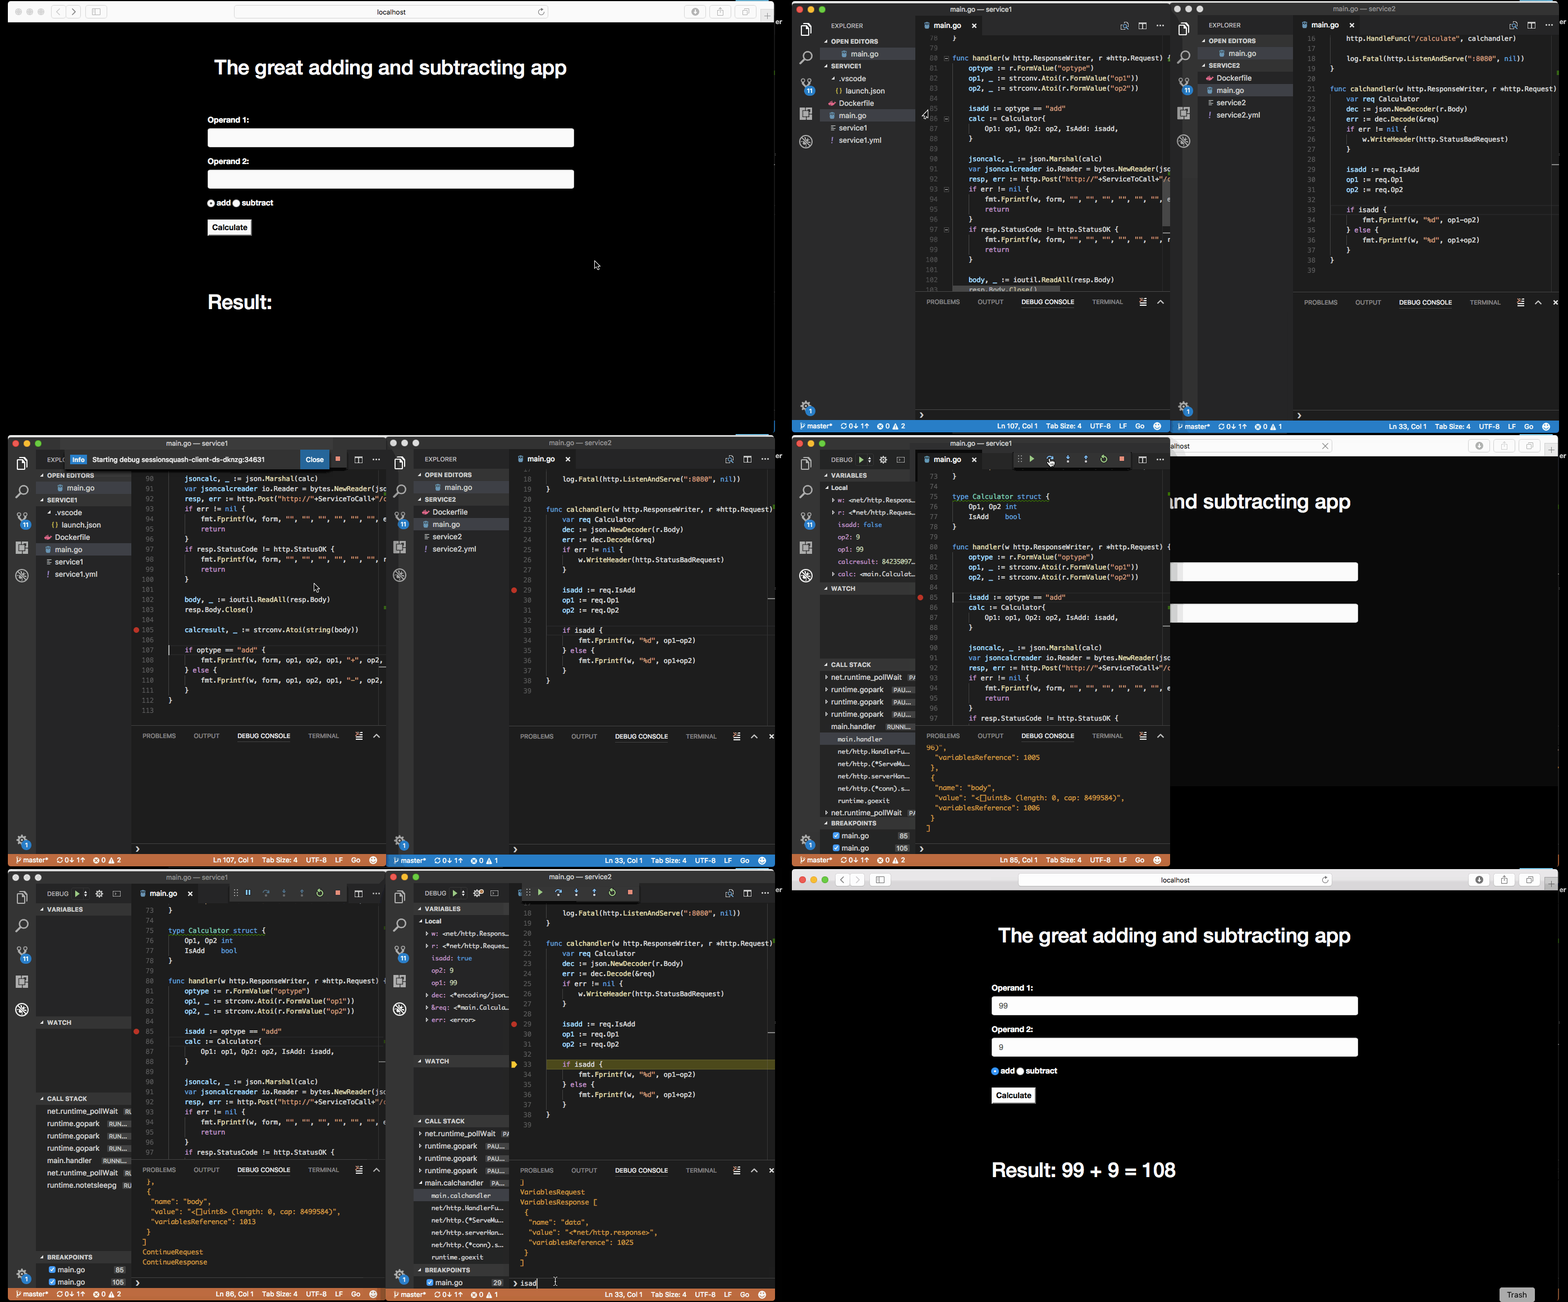
In the following demo we debug an application that adds two numbers. As you can see, it currently fails miserably at adding 9 to 99. The application is composed of two microservices. We set breakpoints in both, then step through the application, while monitoring its variables. At some point we identify the problem, and test it by changing the value of the variable isadd before resuming the execution of the application.
An annotated version of this demo can be found here.
Please visit squash.solo.io for documentation.
- dlv
- Java
- gdb (2019)
- Nodejs (2019)
- Python - ptvsd (2019)
- Kubernetes
- OpenShift
- Istio (2019)
Service Mesh
- Squash integrates with Envoy. Read about the Squash HTTP filter, now part of Envoy here. This allows Squash to open debug sessions as a request flows through a microservice. Support for Istio will be added in 2019.
Debuggers
- We will be adding support to several additional debuggers in early 2019, including gdb, nodejs, and python.
IDEs
- We have simplified the
squashctl --machineinterface so it is easier to add support for additional IDEs. We will be updating our Intellij extension in early 2019.
We welcome community support for enabling more debuggers and IDEs.
Squash is under active development. APIs and compatibility are subject to change. We welcome community participation to help identify potential bugs and compatibility issues. Please open a Github issue for any problems you may experience, and join us on our slack channel
Squash would not be possible without the valuable open-source work of projects in the community. We would like to extend a special thank-you to Kubernetes, gdb and dlv.

