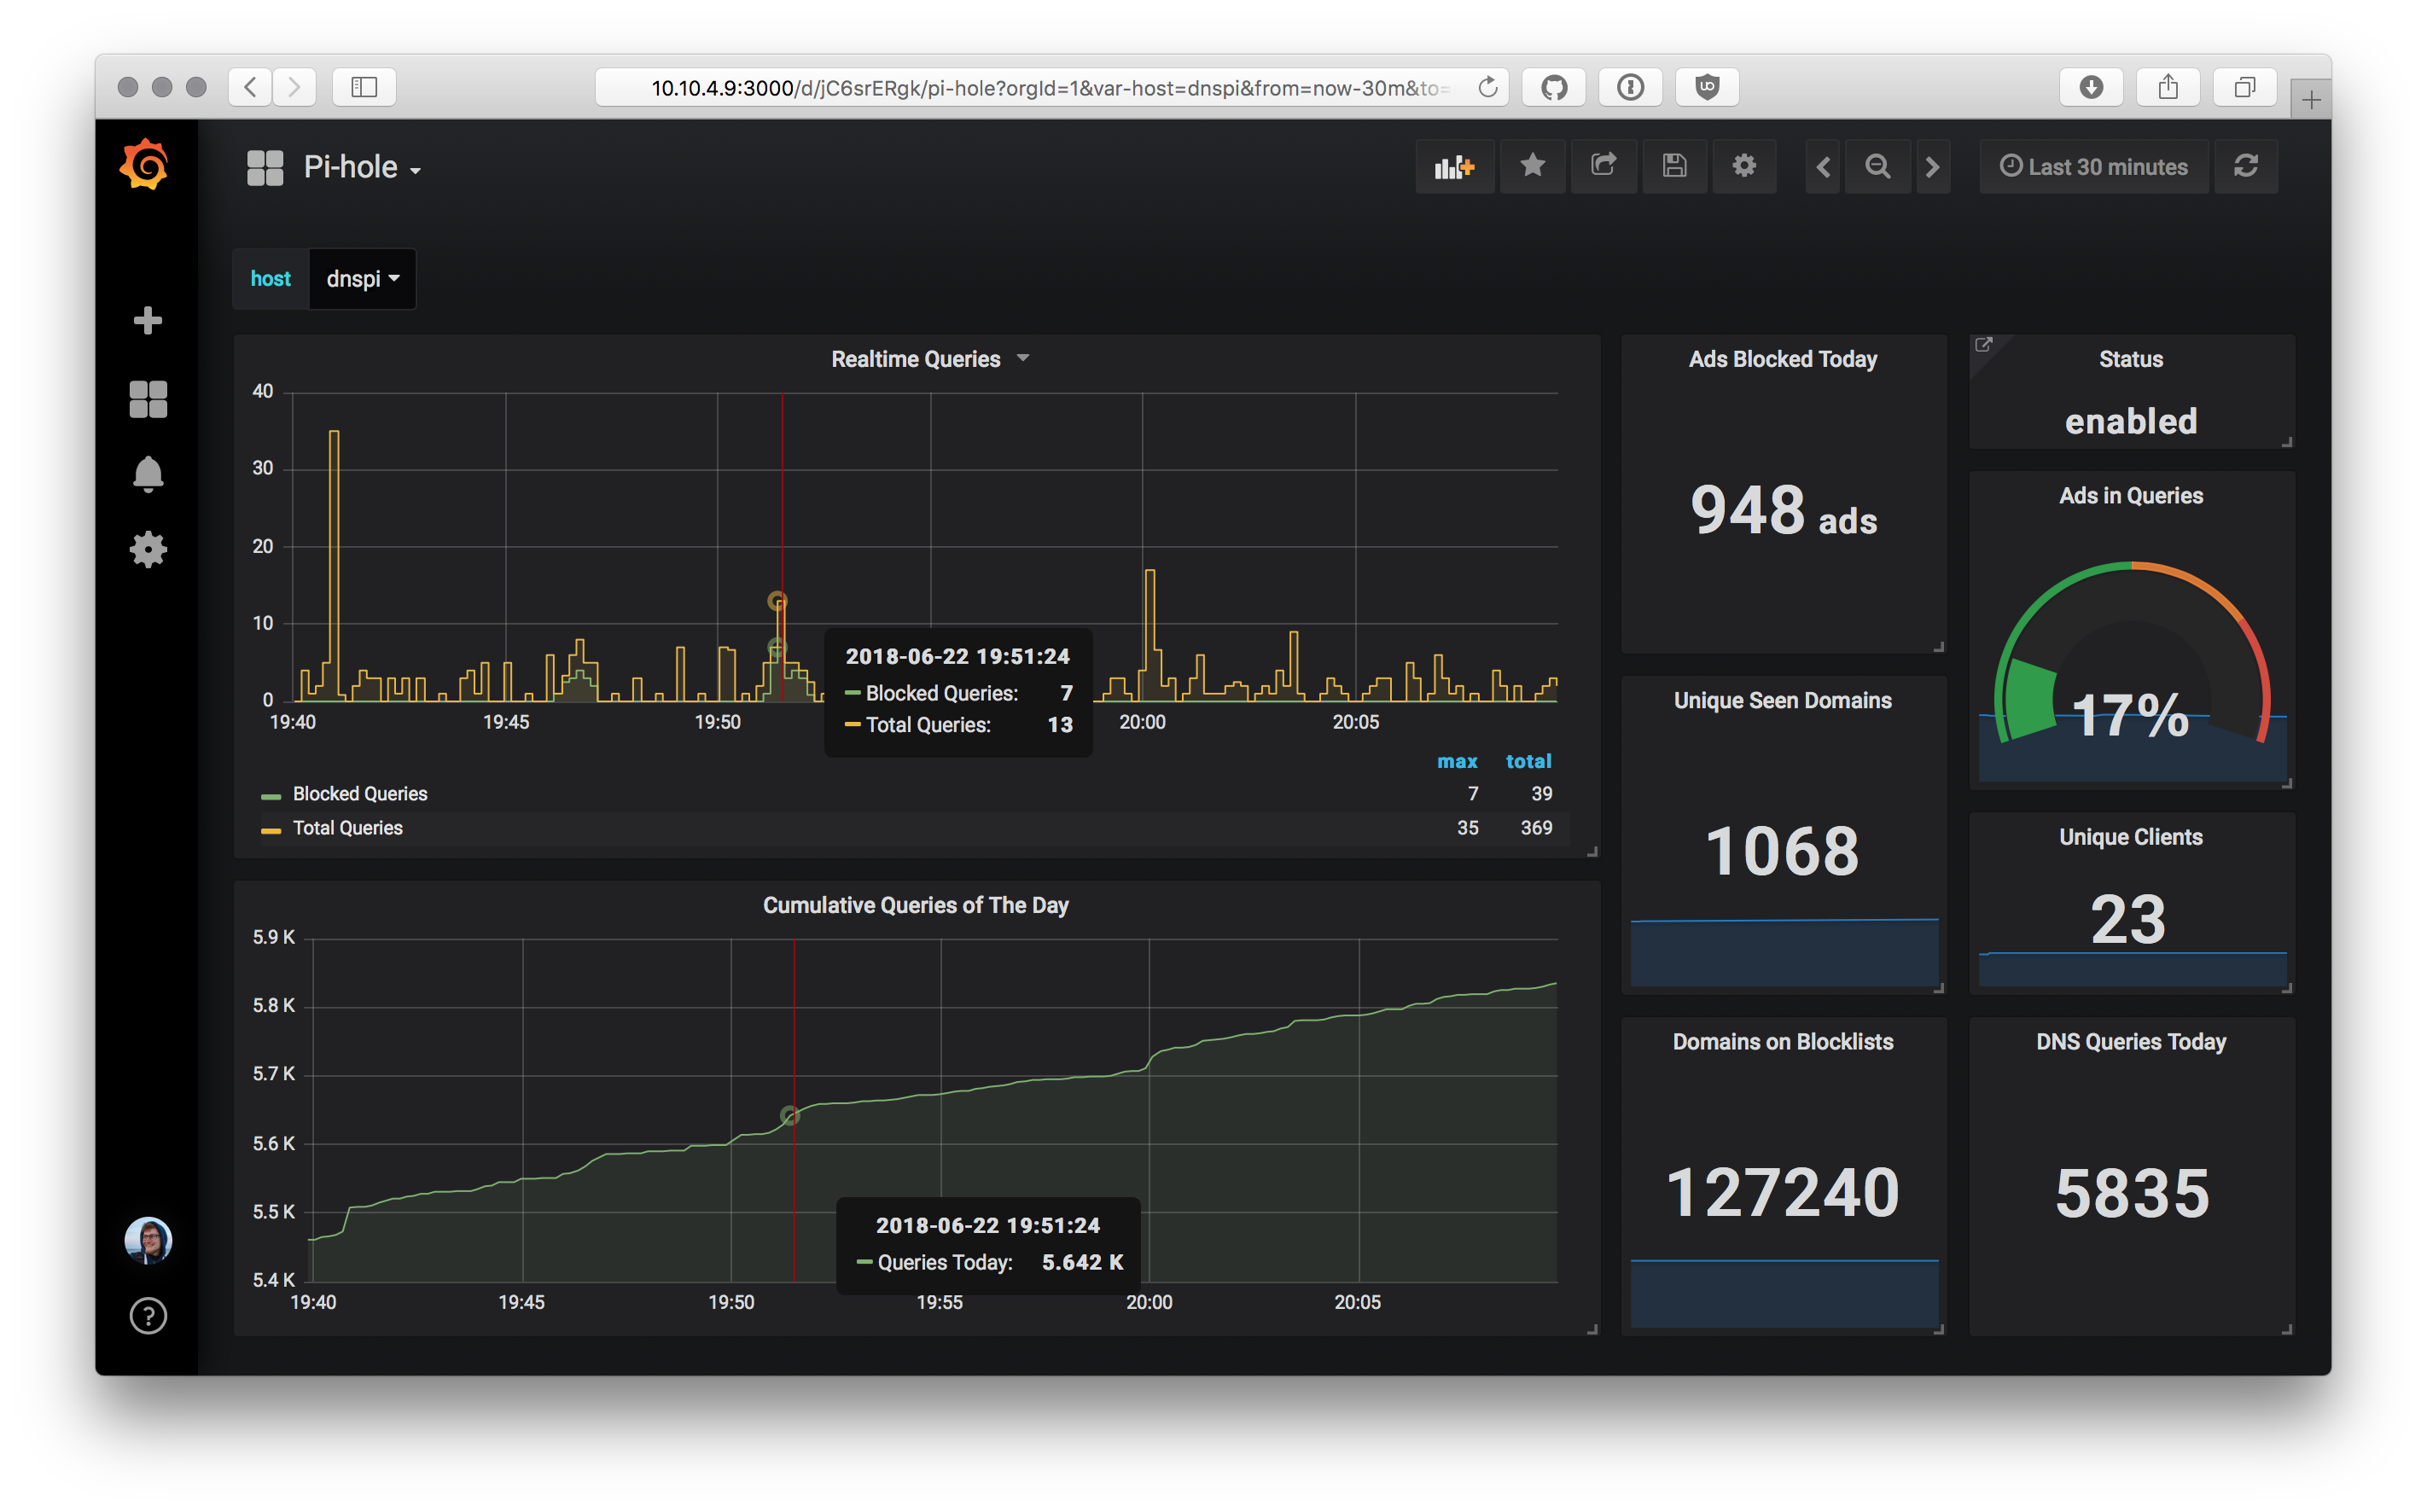
A simple daemonized script to report Pi-Hole stats to an InfluxDB v2 instance, ready to be displayed via Grafana.
ghcr.io/janw/pi-hole-influx. Please update your deployment accordingly. If you are still using InfluxDB v1, please use version 1.0 (ghcr.io/janw/pi-hole-influx:v1) of Pi-hole-Influx. Newer versions (tagged :v2 and :latest) only support InfluxDB v2.
-
To use docker for running the daemon, use the following command:
docker run \
  -e PIHOLE_INFLUXDB_URL=https://127.0.0.1:8086 \
  -e PIHOLE_INFLUXDB_BUCKET=mybucket \
  -e PIHOLE_INFLUXDB_TOKEN=mytoken \
  -e PIHOLE_INFLUXDB_ORG=myorg \
  -e PIHOLE_INSTANCES='[{
        "name": "pihole",
        "base_url": "http://127.0.0.1",
        "api_token": "<your_pihole_api_token>"
      }]' \
  --network host \
  ghcr.io/janw/pi-hole-influx:v2
where PIHOLE_INSTANCES is a JSON-formatted list of instances to monitor with required fields of name and base_url and an (theorically optional but generally required) api_token (see below).
Newer versions of Pi-hole require authentication when accessing the API of an instance that has been configured with a web-interface password. If that is the case for your instance (as it should be), please make sure to include the api_token in the instance config. You can find in the Pi-hole admin panel under Settings -> API / Web interface -> Show API token.
An alternative to configure Pi-hole-Influx through environment variables is a TOML-formatted configuration file. See user.toml.example for an example configuration. It can be mounted into the container under /config/user.toml to provide the configuration instead.
If you want to run the daemon through Docker-compose, you might appreciate the configuration example below.
version: "2"
services:
  piholeinflux:
    image: ghcr.io/janw/pi-hole-influx:v2
    container_name: piholeinflux
    restart: unless-stopped
    environment:

      # Replace details with your InfluxDB's hostname and credentials
      PIHOLE_INFLUXDB_URL: "http://10.10.10.1:8086"
      PIHOLE_INFLUXDB_TOKEN: "mytoken"
      PIHOLE_INFLUXDB_BUCKET: "pihole"
      PIHOLE_INFLUXDB_ORG: "eee0001234asdf"

      # Replace with your Pi-Hole's base_url and api_token below
      PIHOLE_INSTANCES: |
        [{
          "name": "pihole",
          "base_url": "https://127.0.0.1",
          "api_token": "<your_pihole_api_token>"
        }]

      # Additional options that can be adjusted
      PIHOLE_REQUEST_TIMEOUT: "15"  # seconds
      PIHOLE_REQUEST_VERIFY_SSL: "False"
      PIHOLE_REPORTING_INTERVAL: "90"  # seconds

    # OPTIONAL: Instead of the aobove environment variables,
    #           use a custom copy of the user.toml config file.
    volumes:
- ./custom/config.toml:/config/user.tomlAs Pi-hole (as the name suggests) is built specifically with the Raspberry Pi in mind, the following steps assume an instance of Pi-hole running on a Raspbian installation, with no additional modifications. Pi-hole-Influx will be configured to run on the same Pi.
First install the necessary packages via apt as Raspbian Lite does have neither git nor pip installed.
sudo apt update
sudo apt install git python3-pip -y
Now clone the repo, install the Python dependencies, and make sure to copy and adjust the example configuation file to match your setup.
git clone https://github.com/janw/pi-hole-influx.git ~/pi-hole-influx
cd ~/pi-hole-influx

# Install requirements via pip
pip3 install -r requirements.txt

# Copy config.example and modify it (should be self-explanatory)
cp user.toml.example user.toml
vi user.toml
Before starting the daemon for the first time, symlink the systemd service into place, reload, and enable the service. Note that if you are using a user that isn't pi, you must edit piholeinflux.service and change the User and WorkingDirectory to match yours.
sudo cp piholeinflux.service /etc/systemd/system/
sudo systemctl --system daemon-reload
sudo systemctl enable piholeinflux.service
Now you're ready to start the daemon. Wait a few seconds to check its status.
$ sudo systemctl start piholeinflux.service
$ sudo systemctl status piholeinflux.service

● piholeinflux.service - Pi-hole-Influx - Send Pi-hole statistics to InfluxDB for visualization
     Loaded: loaded (/etc/systemd/system/piholeinflux.service; enabled; vendor preset: enabled)
     Active: active (running) since Sat 2023-02-11 22:22:30 CET; 56s ago
       Docs: https://github.com/janw/pi-hole-influx
   Main PID: 776022 (python3)
      Tasks: 3 (limit: 1830)
        CPU: 1.059s
     CGroup: /system.slice/piholeinflux.service
└─776022 /usr/bin/python3 ./piholeinflux.pyThe example dashboard seen at the top uses the collected data and displays it in concise and sensible graphs and single stats. The dashboard can be imported into your Grafana instance from the dashboard.json file included in the repo, or by using ID 6603 to import it from Grafana's Dashboard Directory.
The script originally created by Jon Hayward, adapted to work with InfluxDB by /u/tollsjo in December 2016, and improved and extended by @johnappletree. "If I have seen further it is by standing on the shoulders of giants". 🤓

