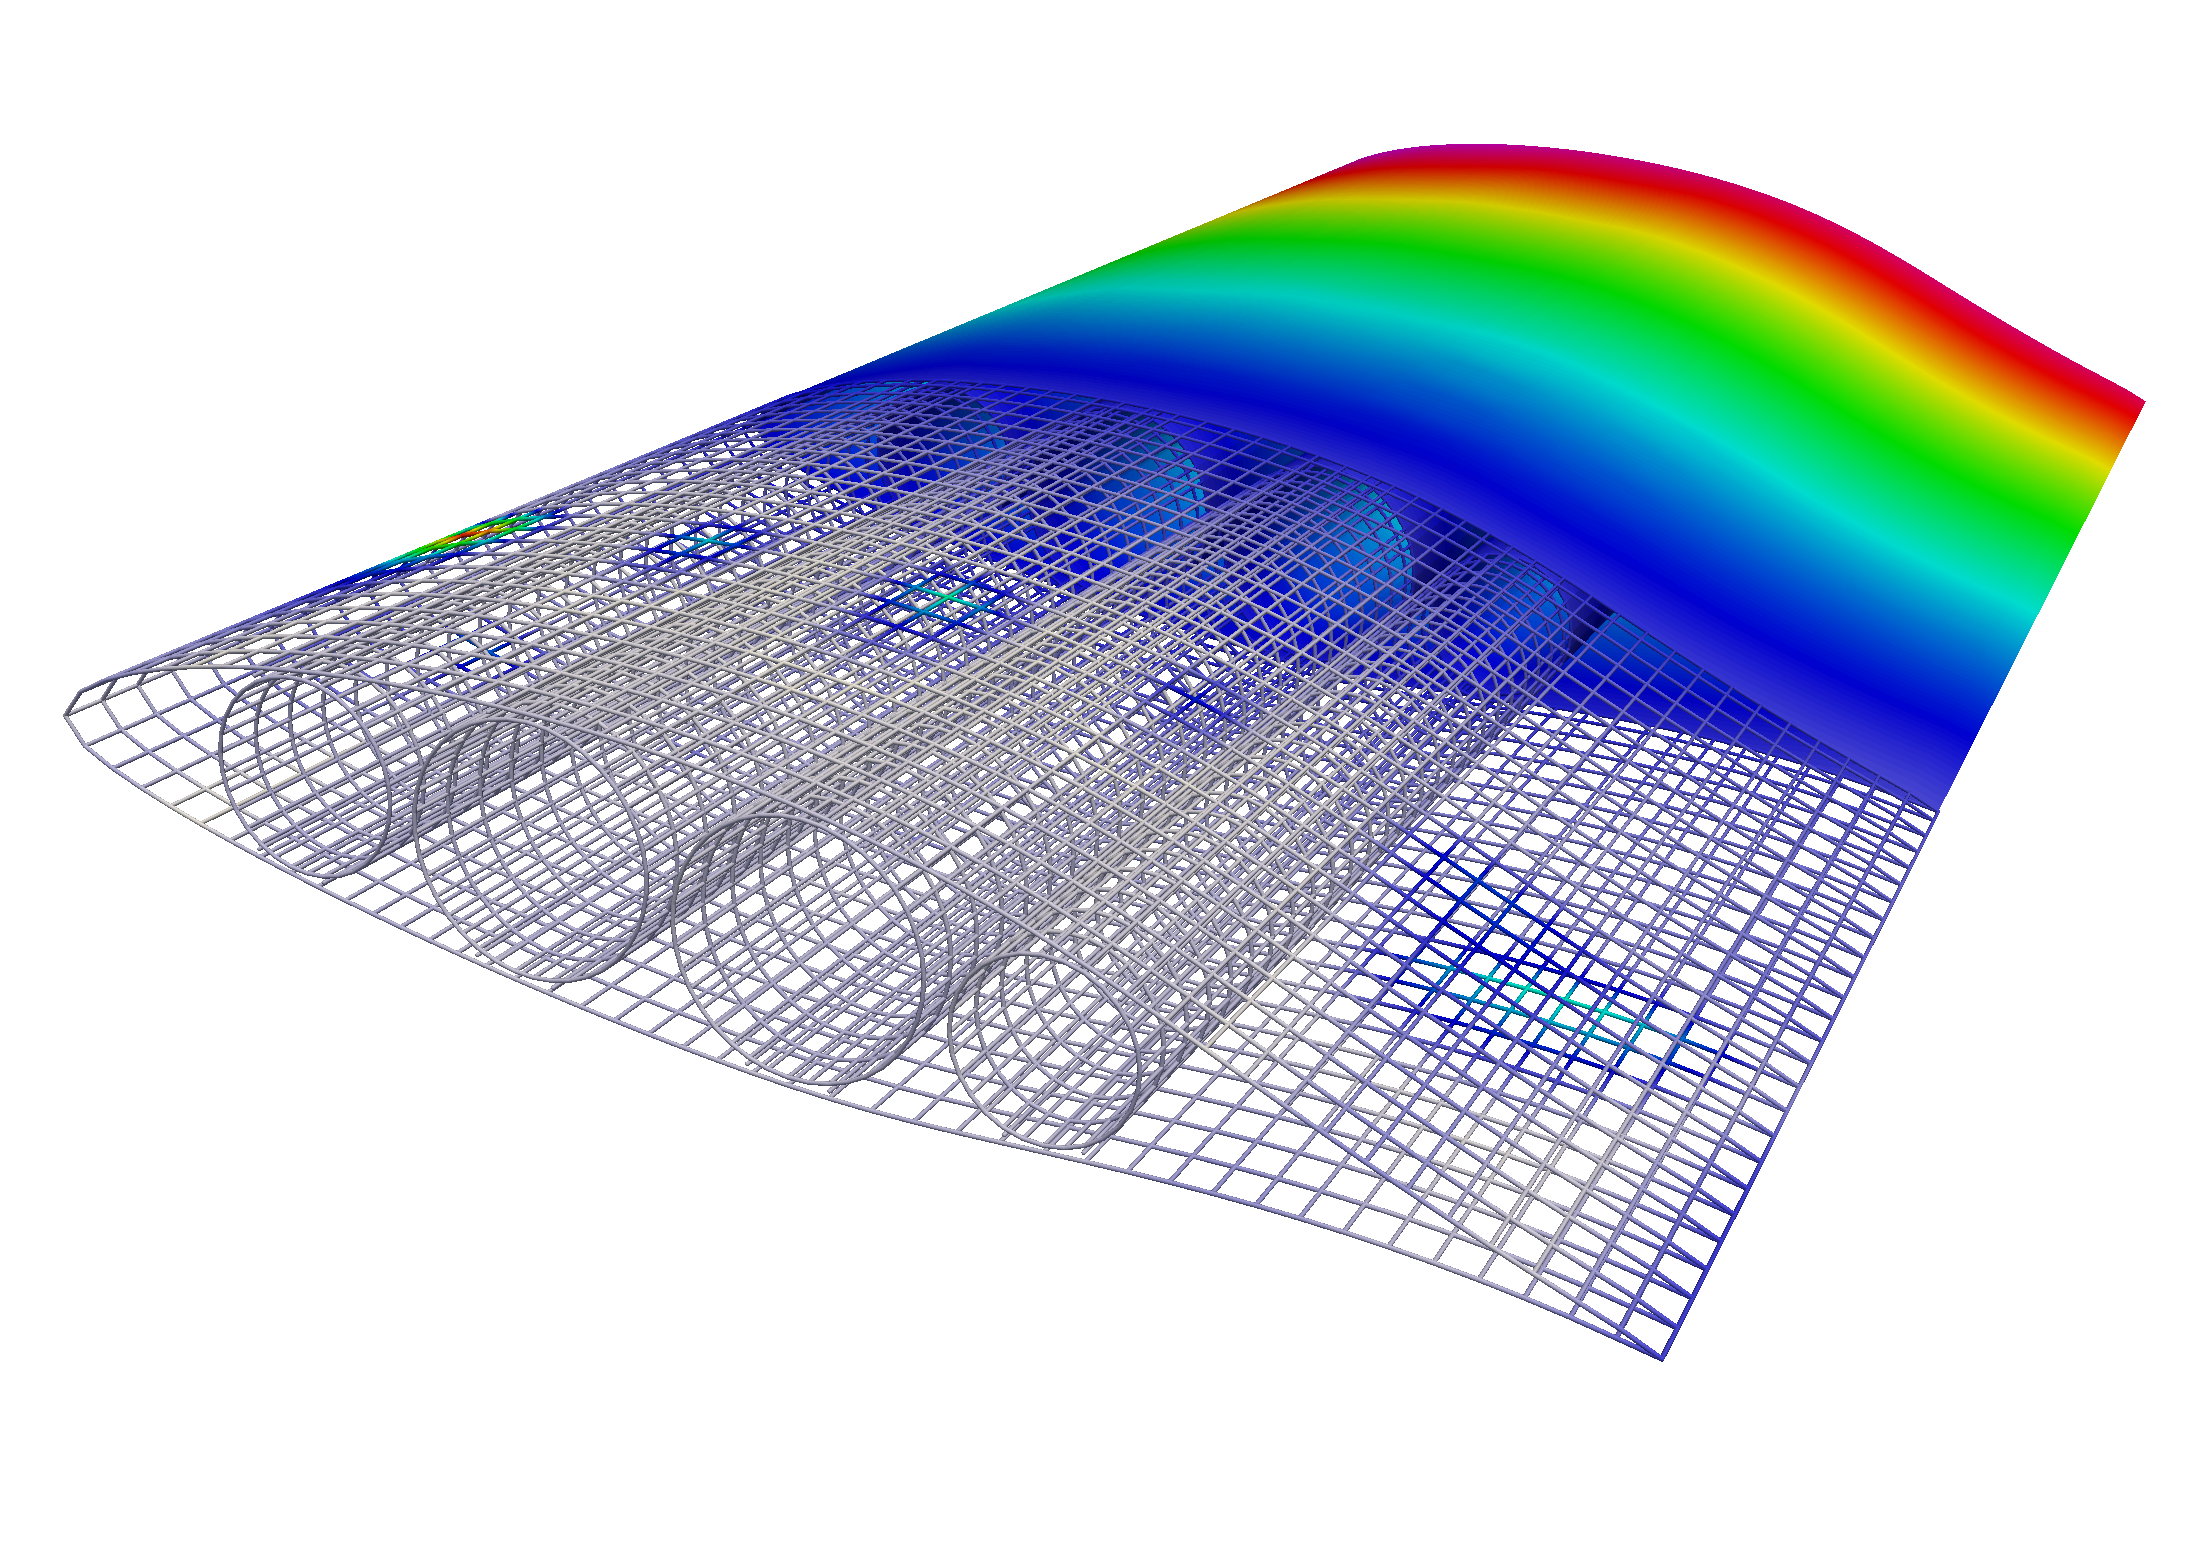
This code is part of the paper that is submitted, please find additional information on that here. Basically, research has been conducted regarding a new type of airplane that very much depends on hydrogen. An illustrative example of this aircraft can be found below.
Given that these aircraft are intended to be propelled by hydrogen, understanding the impact of hydrogen within this configuration is of great importance. In the context of SWITHs, several aspects highlight its innovative nature:
- There are no existing regulations or norms,
- No SWITHs are currently available in the open market,
- Tanks are integrated into the structure, thereby bearing structural loads,
- It's likely that these tanks will be made of composite material,
- Among other factors.
To understand why these points above were listed, what other points were skipped and what their consequences are, please be invited to read the paper.
The output of the code is an interactive html file that will show the density-pressure-temperature relationship of hydrogen. The output will be generated inside the folder Output. You can find an online example here. The plot's legend can be used to selectively display or hide desired hydrogen (H2) data sets as needed. When the word interactive is used for the html display, it means, among other things, that a pop-up appears in which the values for current density, pressure and temperature are displayed.
- Make sure to have installed Python, we tested it with python v. 3.10.6
- Download it directly though the GUI provided by Github (Click on Code and then on Download Zip) or via git
- Install the required dependencides
- Run the main.py file with Python
- Find the output in the folder called Output
git clone https://github.com/jav-ed/H2O_Plot.git
cd H2O_Plot
pip install -r Others/require.txt
python main.py
xdg-open Output/h2_Desnity_Plt.html
xdg-open Output/z_Compres_Fact.html- open main.py
- adjust 'step_P' and step_T, the smaller the values, the finer the resolution for which evaluations are returned
- open main.py
- change p_Min, p_Max for the min and max values for the pressure
- change T_Min, T_Max for the min and max values for the temperature
- [220; 1000] K = [-53; 727]°C and p [0;70] MPa with 0.01%
- [255; 1000] K = [-18; 727]°C and p [0;120] MPa with 0.01%
- [200; 1000] K = [-73; 727]°C and p [0;200] MPa with 0.1%
For more detailed information about this topic, please refer to the original paper
Lemmon, E.W.; Huber, M.L.; Friend, D.G.; Paulina, C.; et al. Standardized equation for hydrogen gas densities for fuel consumption applications. In Proceedings of the SAE World Congress, 2006, pp. 3–6.
Find a full copy in LICENSE.md or
You are free to use the content of this webpage for whatever you like, including modification, sale, distribution, and more. However, please note that there are some important restrictions: You can do whatever you like with this content as long as it is halal or morally supportable. If you are unsure about a topic, please consult the license agreement.
First, you are not allowed to insult, target minorities or religious groups, support Israel's government, assist India in its oppression in Kashmir, assist the Chinese government's oppression against Uighurs, and so on. Second, there is a copyleft - it basically means, your work is mandated to have the same license, i.e., you as well want to make sure that your work cannot be misused.
PEP 8 guide style? - no, thank you

