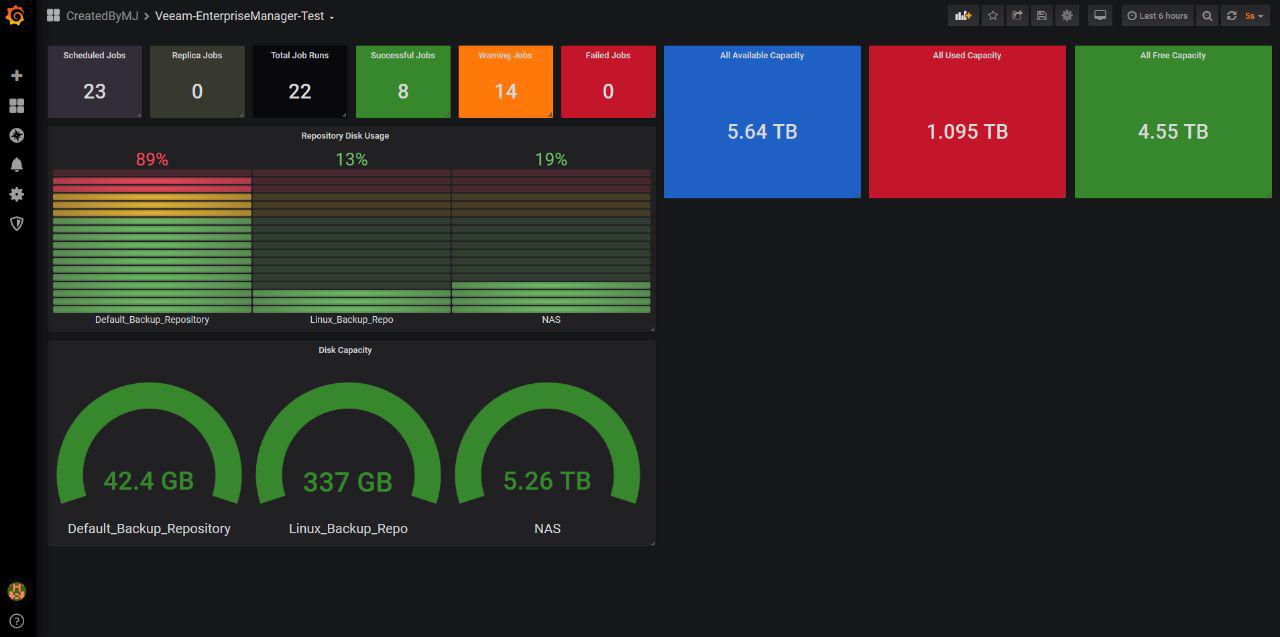
If you wanted to monitor your Veeam Backup and Replication with Grafana, you can do it by using Veeam Enterprise Manager API.
This project inspired by a project by Jorge de la Cruz which is using a Powershell Script to fetch information from Veeam EM RESTful API. 👍
You can see Veeam EM API reference here https://helpcenter.veeam.com/docs/backup/rest/overview.html?ver=95u4
This project is using a Shell-script to fetch information from Veeam Enterprise Manager RESTfulAPI and store them in InfluxDB using Telegraf.
Shell-script uses jq to extract information from JSON objects This link https://stedolan.github.io/jq/download/ will guide you how to install jq on your machine.
- Download get-veeam-ent.sh from this github repository. https://github.com/javadmohebbi/Veeam-EnterpriseManager-api-Grafana/blob/master/get-veeam-ent.sh.
- Change SERVER_ADDRESS, SERVER_PORT, USERNAME & PASSWORD in the downloaded Shell-script
- Make it executable
$ chmod +x get-veeam-ent.sh
- Use Telegraf config file to run Shell-script - An example of conf file is availabe at: https://github.com/javadmohebbi/Veeam-EnterpriseManager-api-Grafana/blob/master/Veeam-Telegraf.example.conf
[[inputs.exec]]
  commands = ["bash /path/to/get-veeam-ent.sh" ]

  interval = "60s"
  timeout = "60s"
  data_format = "influx"
Currently I am working on creating a template dashboard and this is the sample screenshot. The JSON file for the dashboard **is available in this Repo. **
