Using MLR modeling to analyze housing sales
Centurion Appraisals conducts residential appraisals, divorce appraisals, estate appraisals, and retroactive and relocation appraisals, helping you to make sure that you get an accurate valuation for any of your property valuation needs.
Imagine there was an easier way for Centurion Appraisal to estimate housing prices using an algorithm to assist in the process of property valuation. By inputting the features of the property, the appraiser can quickly generate an appraisal. Understanding the predictive power of the different features will allow appraisers to better understand what home features need to be examined more closely in person and create a more efficient appraisal process overall. Note that Centurion only appraises homes greater than $250k and less than $15M.
This analysis utilizes the King County house sales data from 2021-2022 from the King County assessors data portal. This data set contains features of home including but not limited to square footage, floors, bathrooms and condition. In this analysis, our target variable is 'Sale Price'.
Local education data was also collected from the Washington State 2021-2022 Report Card Data set per each district in the county.
Location data (latitude and longitude) for Amazon, University of Washington, and Microsoft was collected from Wikipedia.
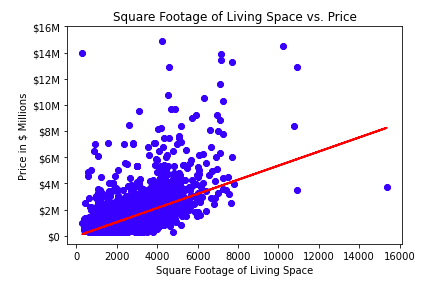
Our Baseline model ran a single linear regression model of square footage of living against sale price because sqft_living had the highest correlation coefficient for predicting price of home.
Data Cleaning & Preprocessing:
Filtered out rows <$250k and >$15M for sale price.
Extracted ZIP code from address column as a new column.
Convert string columns to boolean (yr_renovated) and convert ordinal/nominal columns to numeric (waterfront, nuisance, greenbelt, view, condition, grade).
Drop null values, drop clear data entry errors (i.e. house that is 3 square feet), drop unneeded column (ID and address), date column to datetime format.
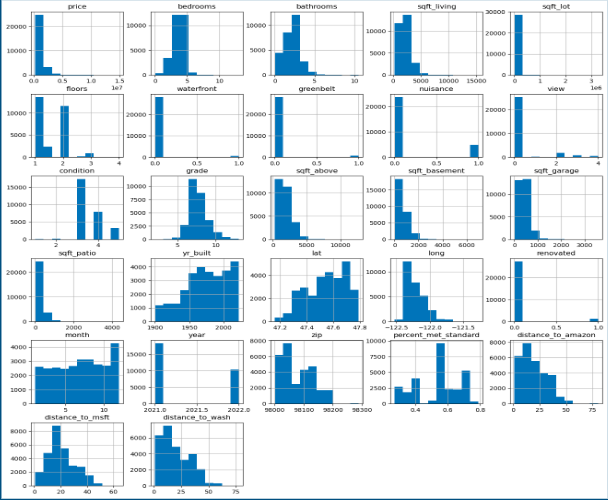
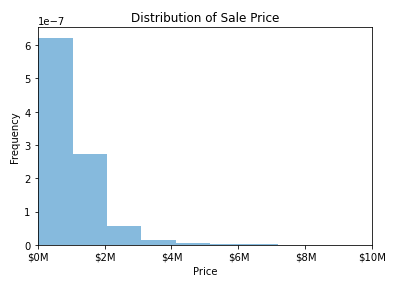
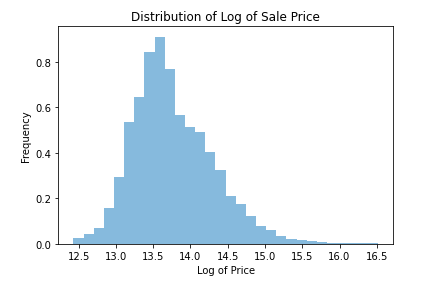
Log scale the square footage columns and the target price variables. See distributions:
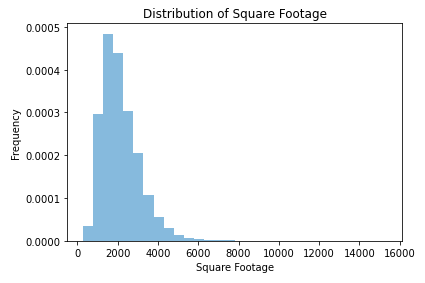
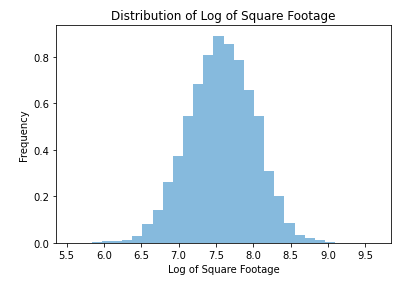
Join education table by shared ZIP per distrcit code to map percent_met_standard (metric of education) to each row in data set.
Use latlong to compute distance from each address to Amazon HQ, Microsoft HQ and University of Washington and pull into master data set.
Onehot encoded dummy variables for nominal categories: sewer, heat and ZIP.
Our Baseline model (single regression model of square footage of living against sale price)
R-Squared: 0.3882
Model #2: Looking at the relationship between all original numeric features vs. price including education data and distance to key landmarks
R squared: .555
Model #3: Power transformed (log) values for price of home
R squared : .734
Model #4: Power transformed all square footage variables
R squared: .735
Model #5: Encoded all categorical variables including ZIP codes, heat and sewer data and standard scaling
R squared: .793
Analysis of our final model
-
Low (nearly zero) p-values of for all variables besides sewer system, ZIP and nuisance (neighborhood noise) categories
-
Mean squared error of 0.2018
-
Coefficients with greatest impact:
-
Square footage of living space: every 1 increase in log of Square Footage (living) results in 0.2 increase in log of Price
-
Distance to University of Washington: every 1 standard deviation increase of Distance to UWash results in 0.63 decrease in log of Home Price
-
Grade of the home: every 1 standard deviation increase of Home Grade results in 0.144 increase in log of Home Price
Home appraisals are significantly impacted by the size, status of home health and distance to UWash - be aware of these key factors! If there is a discrepancy between home valuation and one of these factors, you can highlight this home as needing more hands-on analysis for that home.
Next Steps:
Looking into localized crime data
Looking at home data beyond years 2021 - 2022
Adding visualizations for final model expected vs. actual
Troubleshooting the log un-transform
Looking at distinction in statistical significance for homes > 10 miles away from our key landmarks
