Project to add Prometheus and Grafana monitoring to an existing Red Hat Process Automation Manager 7 demo installation on OpenShift
This project requires an existing RH PAM 7 demo (e.g. the RH PAM 7 Install Demo or the RH PAM 7 Mortgage Demo) installed on OpenShift
NOTE
This add-on requires an OpenShift version 3.10 or higher. This is due to the fact that the Prometheus JMX Exporter Java Agent JAR is copied as a binary file to a ConfigMap. Binary files in ConfigMaps are supported in OpenShift 3.10+
-
Install a RH PAM 7 Demo on OpenShift
-
Make sure that your
occlient is connected to the OpenShift instance on which you installed your RH PAM 7 demo. Make sure that the current 'ocproject of the logged-in user is the project in which you want to install this monitoring component (this can be verified using the commandoc project). -
Run
init-openshift.sh -d {demo-name}(Linux/macOS, Windows support will be added later), where{demo-name}is the name of the demo to which you want to add monitoring. For examplerhpam7-installfor the Install Demo andrhpam7-mortgagefor the Mortgage Demo. (the demo name is used to patch the correct RHPAM KIE-Server deployments to enable Prometheus monitoring).
The installation script:
- Patches the KIE-Server deployment, enabling Prometheus JMX scraping on port 58080. The script:
- installs the required Prometheus JMX Exporter Java Agent JAR (in a ConfigMap).
- copies the JMX Exporter configuration file to an OpenShift ConfigMap.
- configures the KIE-Server JAVA_OPTS to enable the KIE MBeans and Prometheus JMX Exporter.
- opens port 58080 on the KIE-Server container image and service.
- Installs Prometheus and:
- configures it to scrape data from the KIE-Server instance.
- enables Bearer token authentication on the OpenShift OAuth proxy to enable communication between Grafana and Prometheus.
- Installs Grafana and:
- creates the Prometheus datasource, configured to use Bearer token authentication.
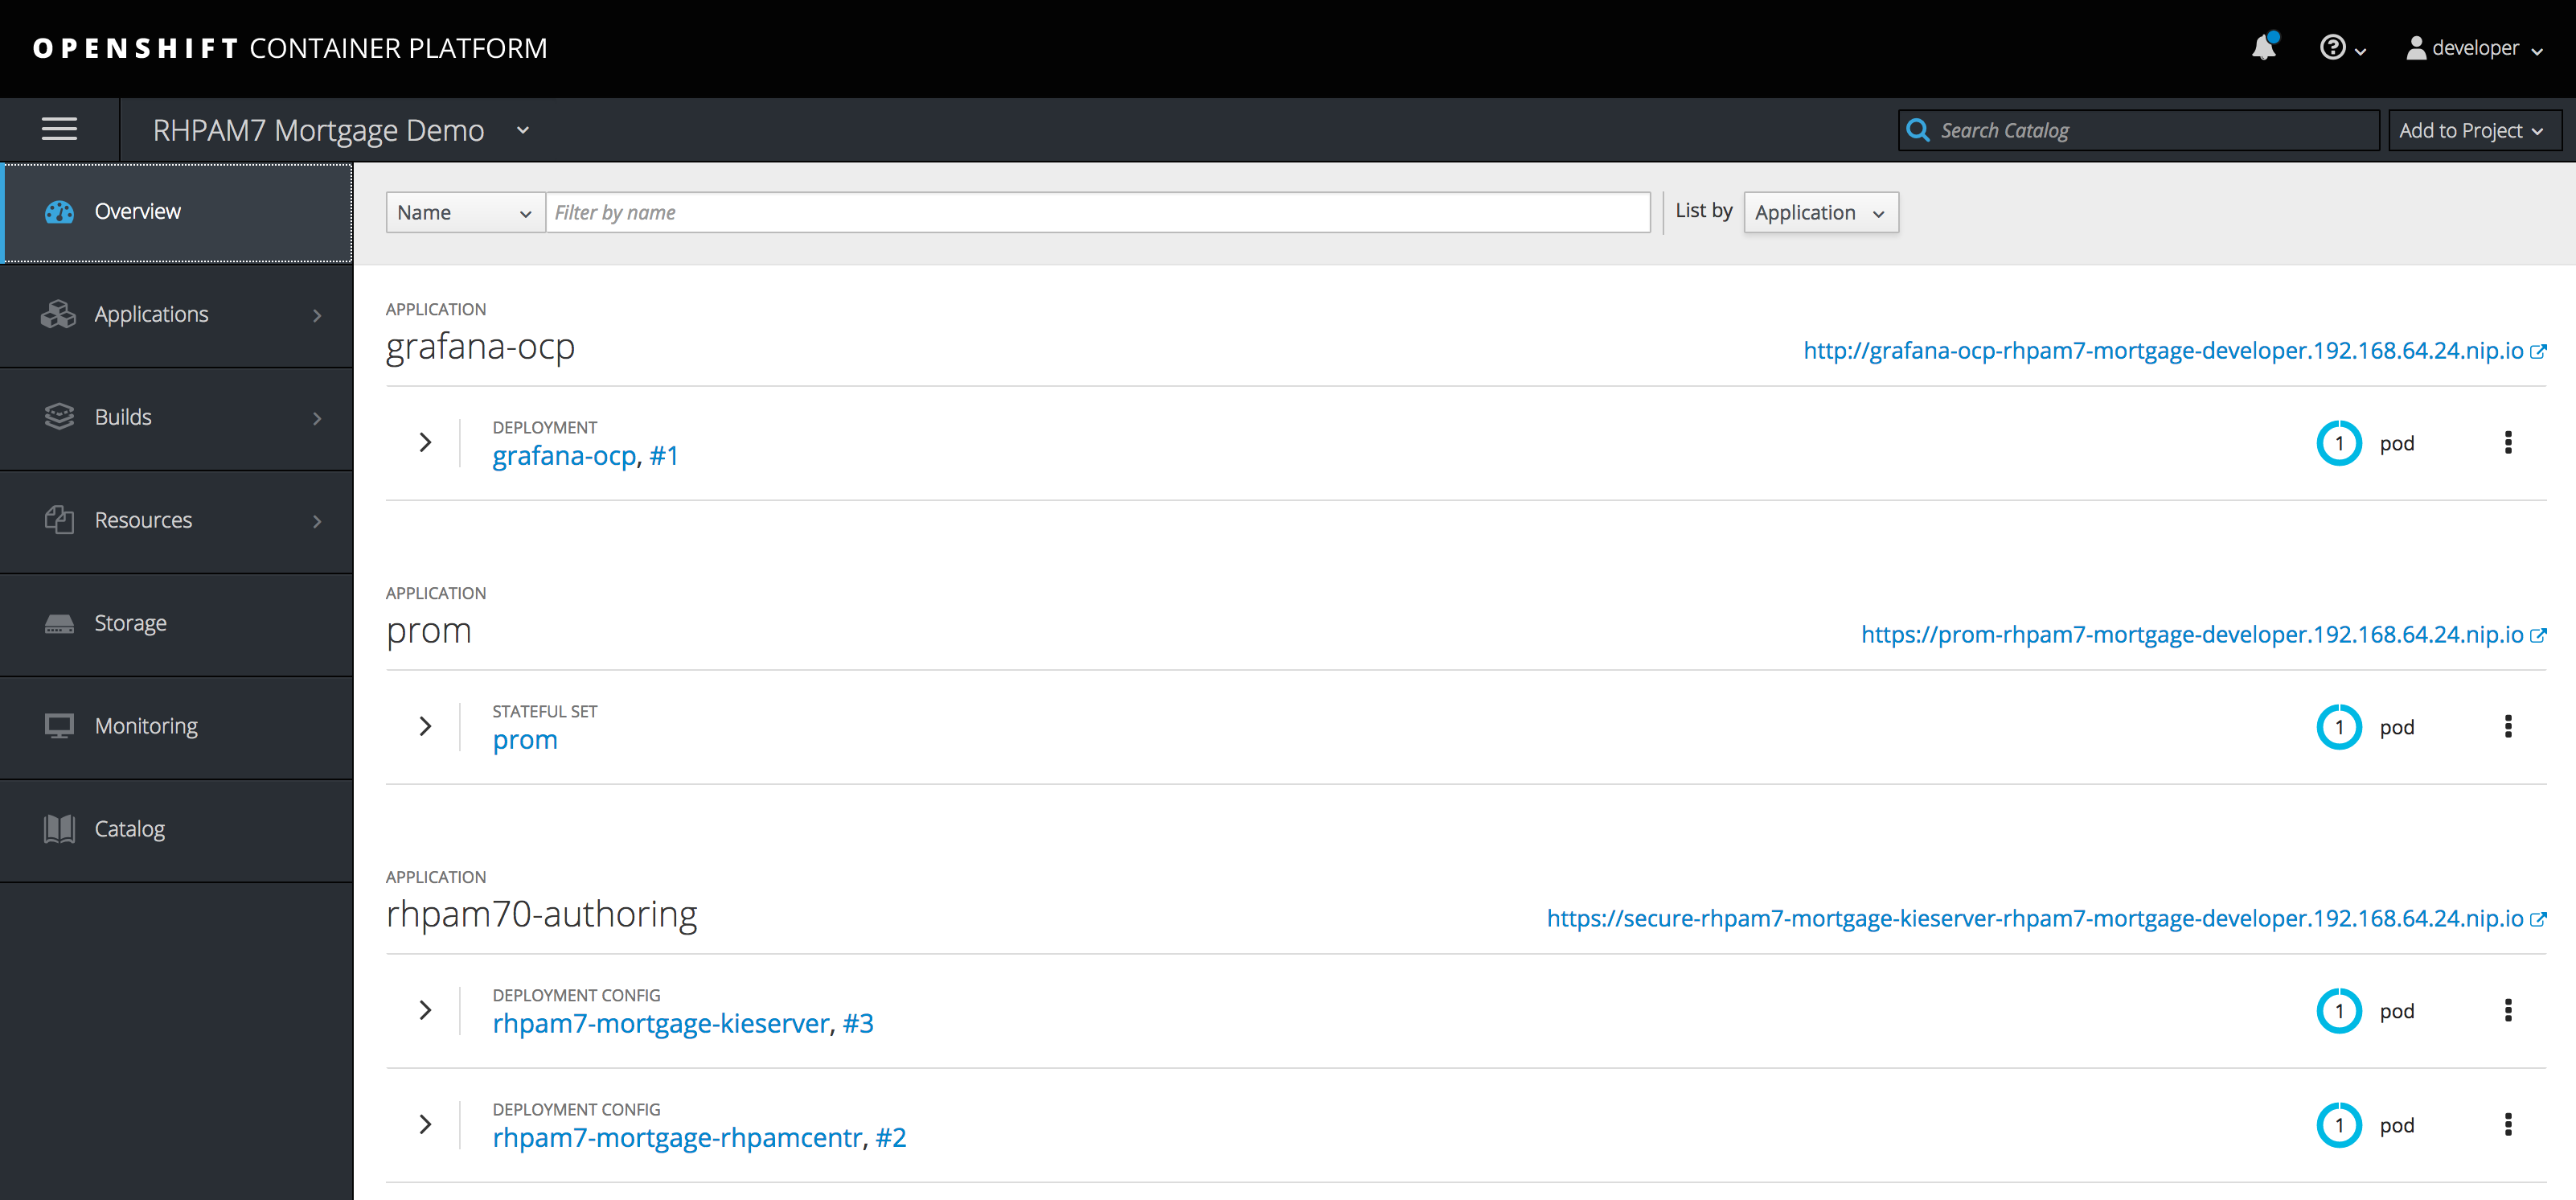
After the installation, the environment Overview in OpenShift will look like this:
This demo installs a Prometheus and Grafana environment that has been completely pre-configured to monitor the KIE-Servers in the given project. However, the dashboards in Grafana still need to be created.
-
Install a KJAR (Deployment Unit of the pre-installed demo) onto the KIE-Server. Please refer to the documentation of the given demo for instructions. A KJAR needs to be installed onto the KIE-Server to start the KIE MBeans, and thus make them visible in Grafana.
-
Open the Grafana UI by, in the OpenShift console, clicking the
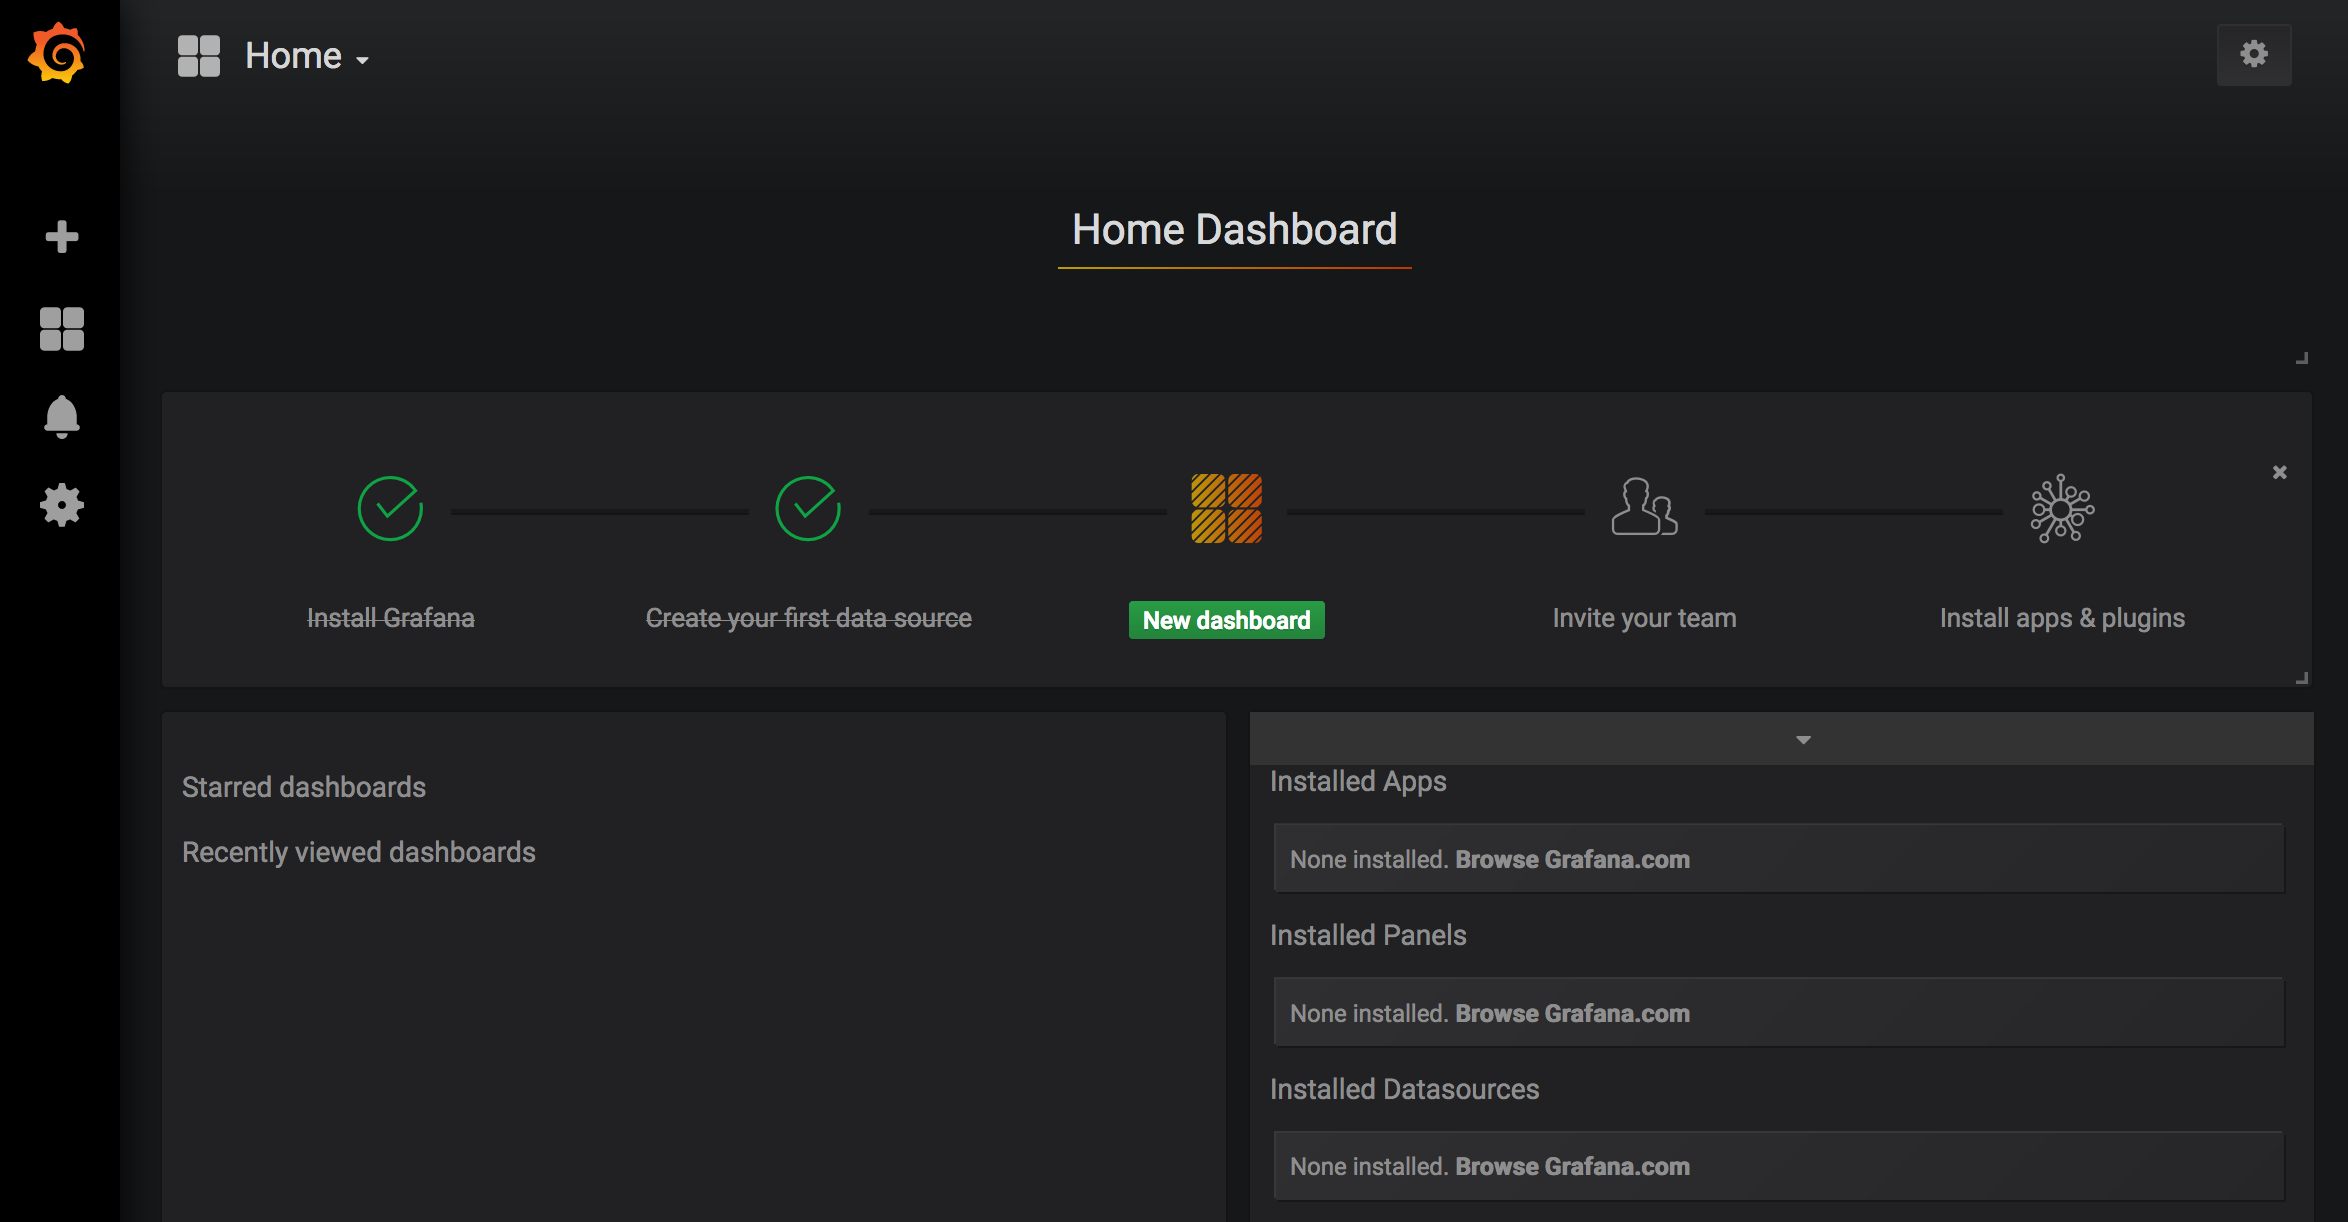
httproute of the "grafana-ocp" application in the OpenShift Overview page. The Grafana UI shows that Grafana has been installed, a datasource has been created (this is the Promethues datasource which has been automatically installed by our installer) and that the user can create his/her first dashboard.
-
Click on "New Dashboard". In the "New Dashboard" page, click on "Graph".
-
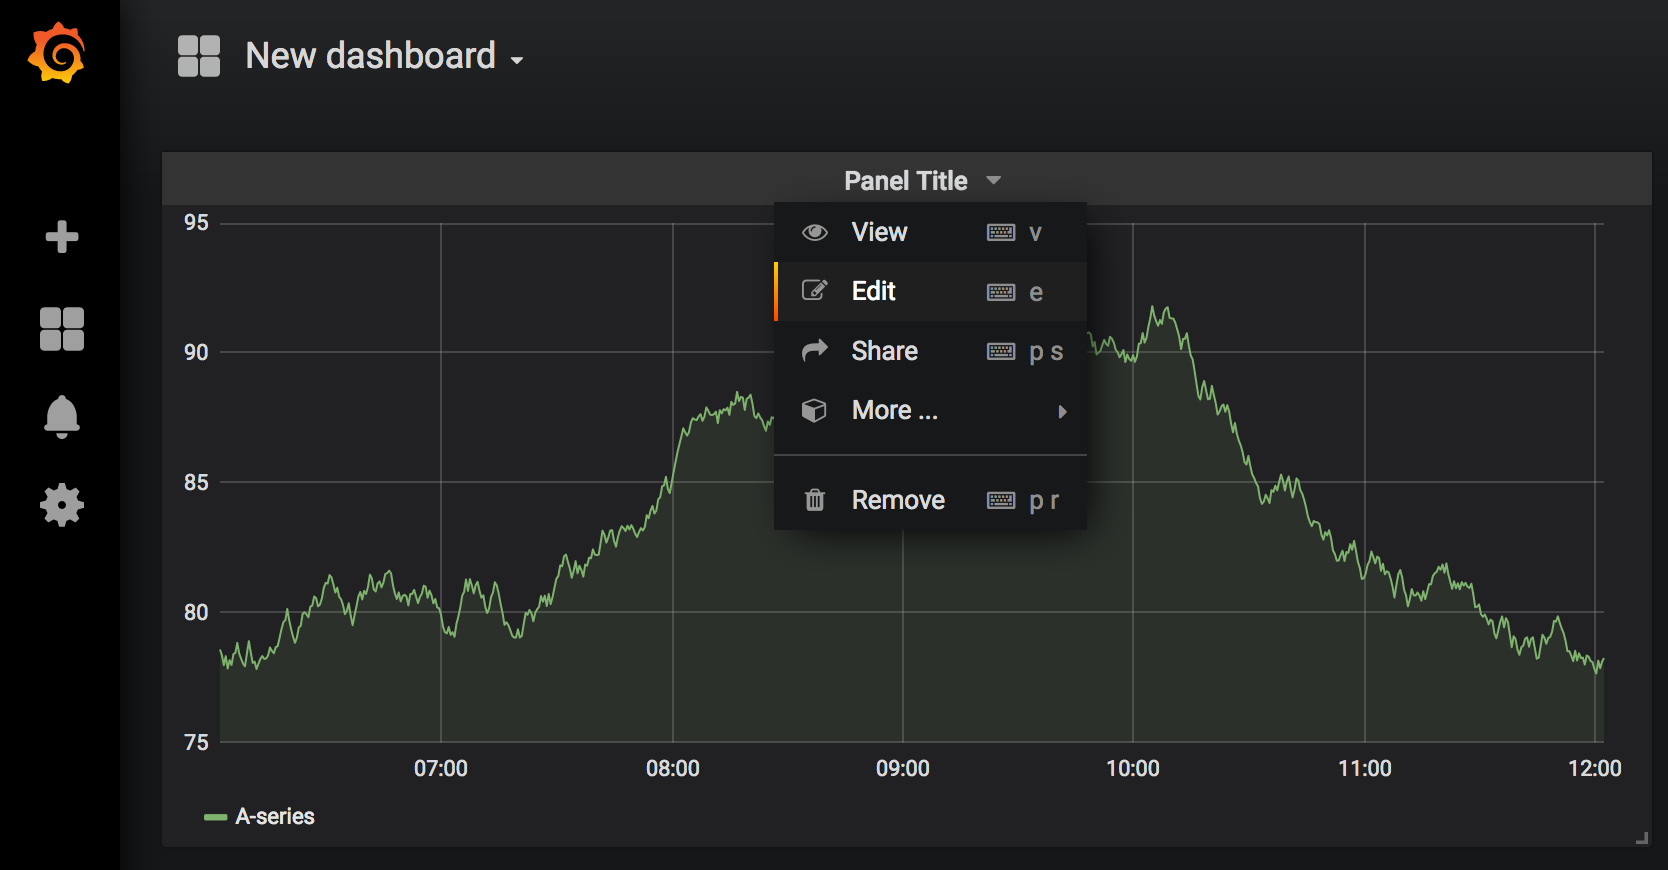
To configure the panel, click on the downward pointig arrow next to "Panel Title" and click on "Edit".
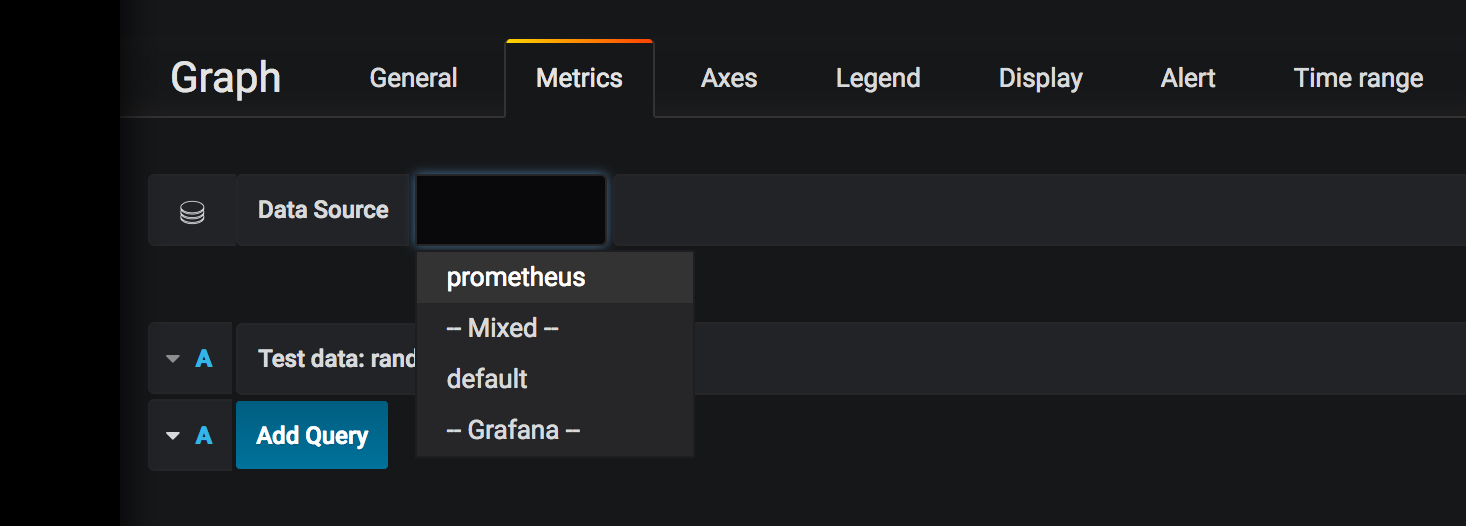
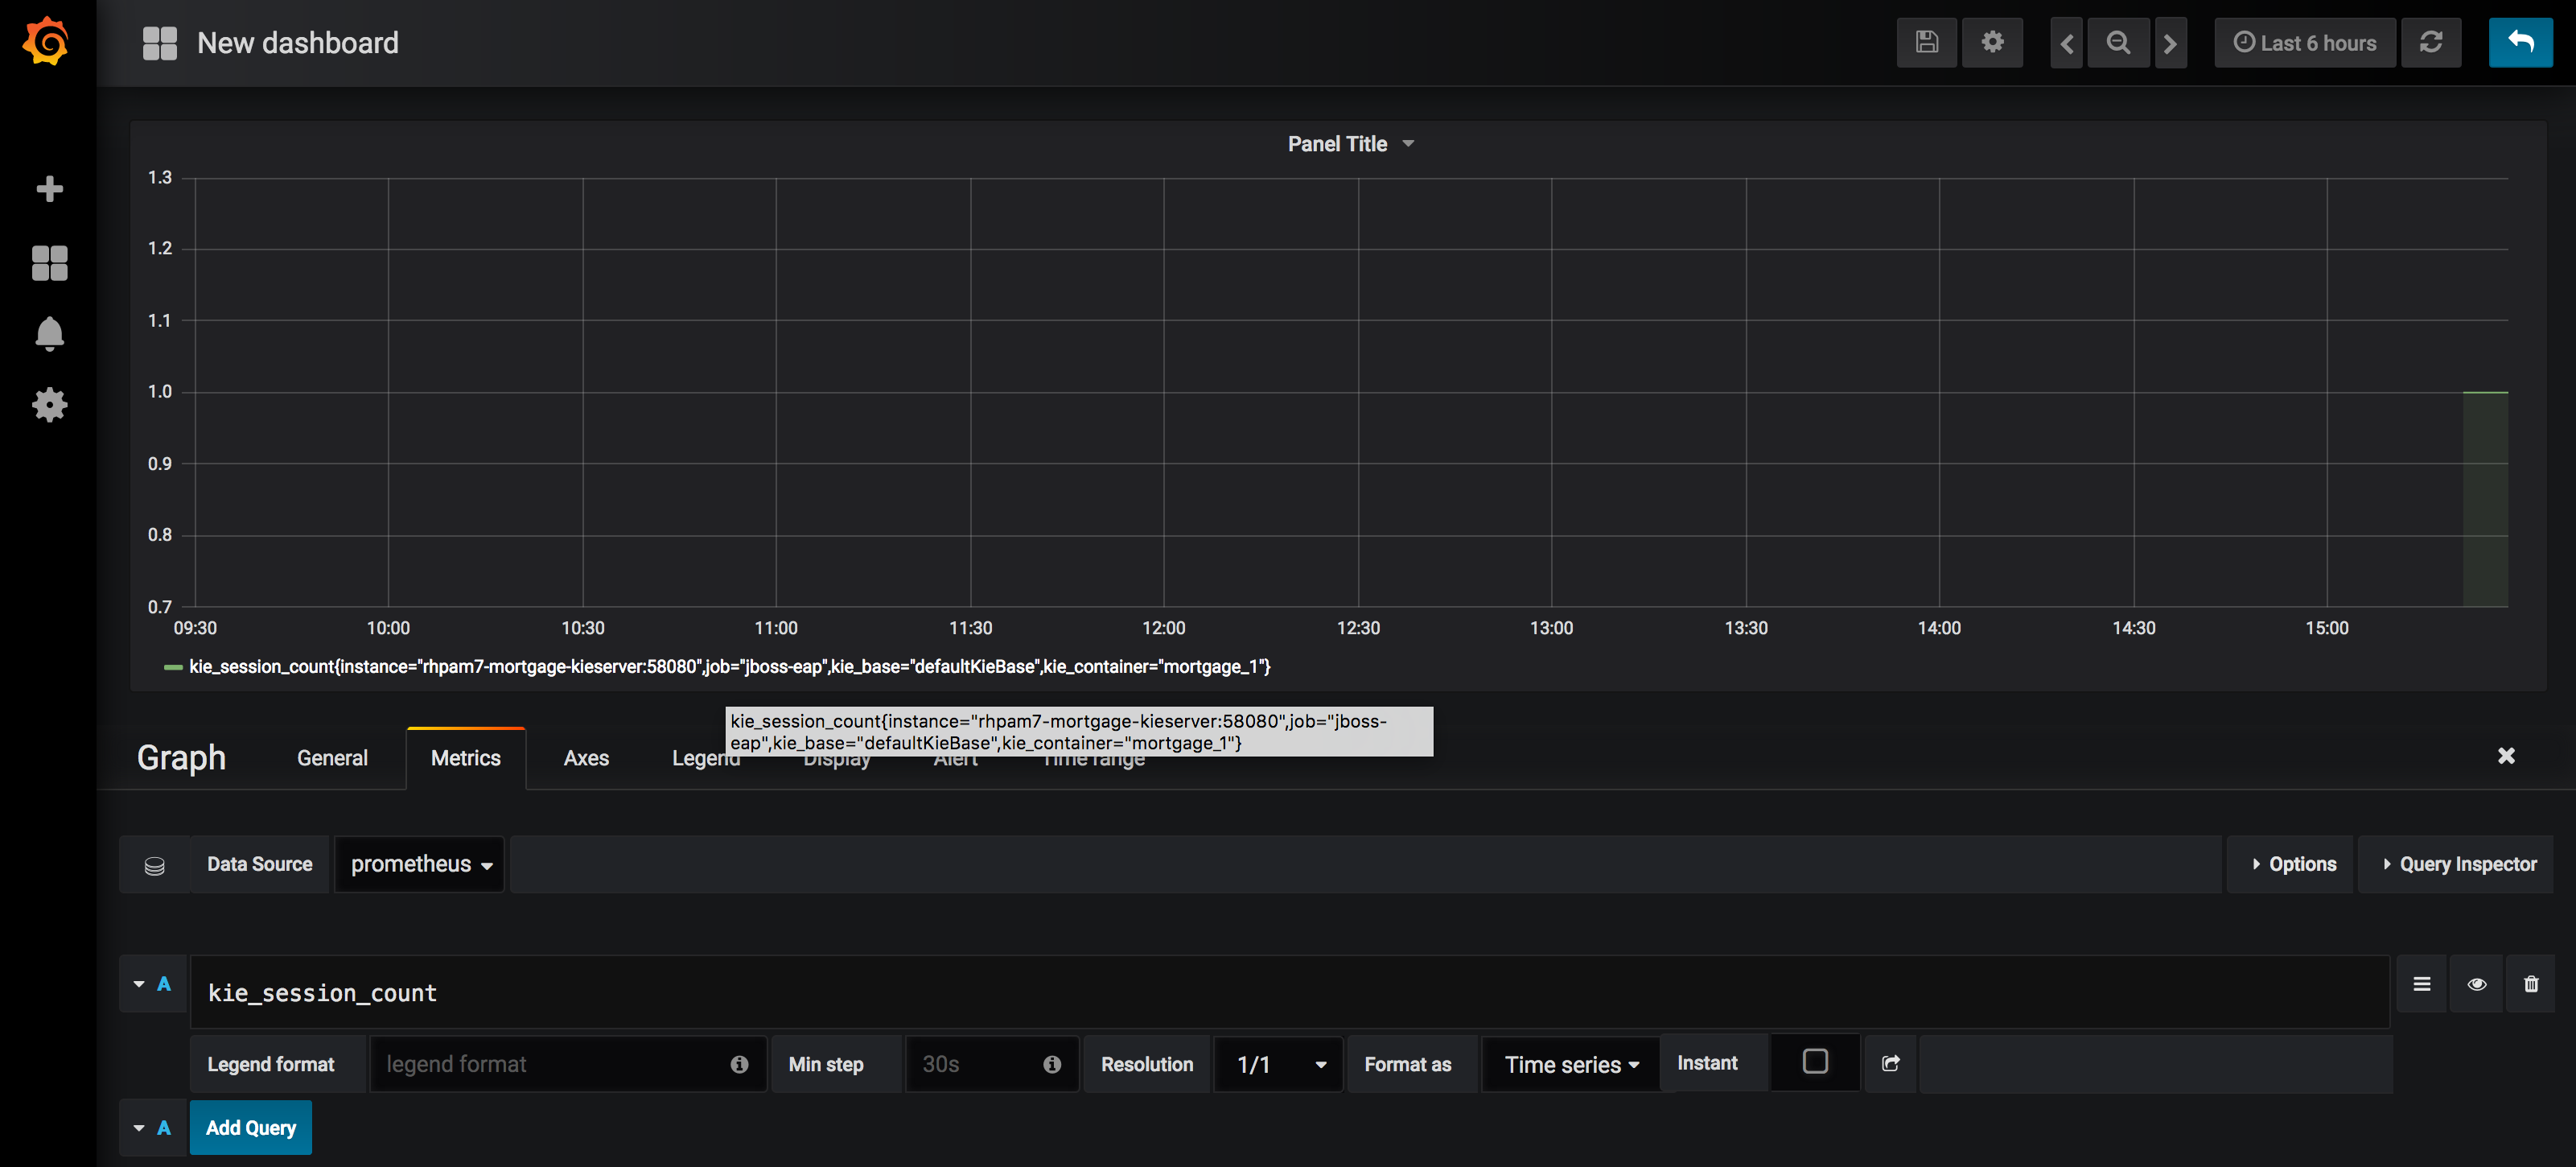
- In the "Metrics" tab, select "prometheus" as the datasource.
- In the "Query" input field, type
kie_session_countto visualize the number of KIE Sessions created on the KIE-Server. If Grafana, Prometheus and KIE-Server have been setup correctly, the query should autocomplete when you start typing the namekie_sesssion_count.
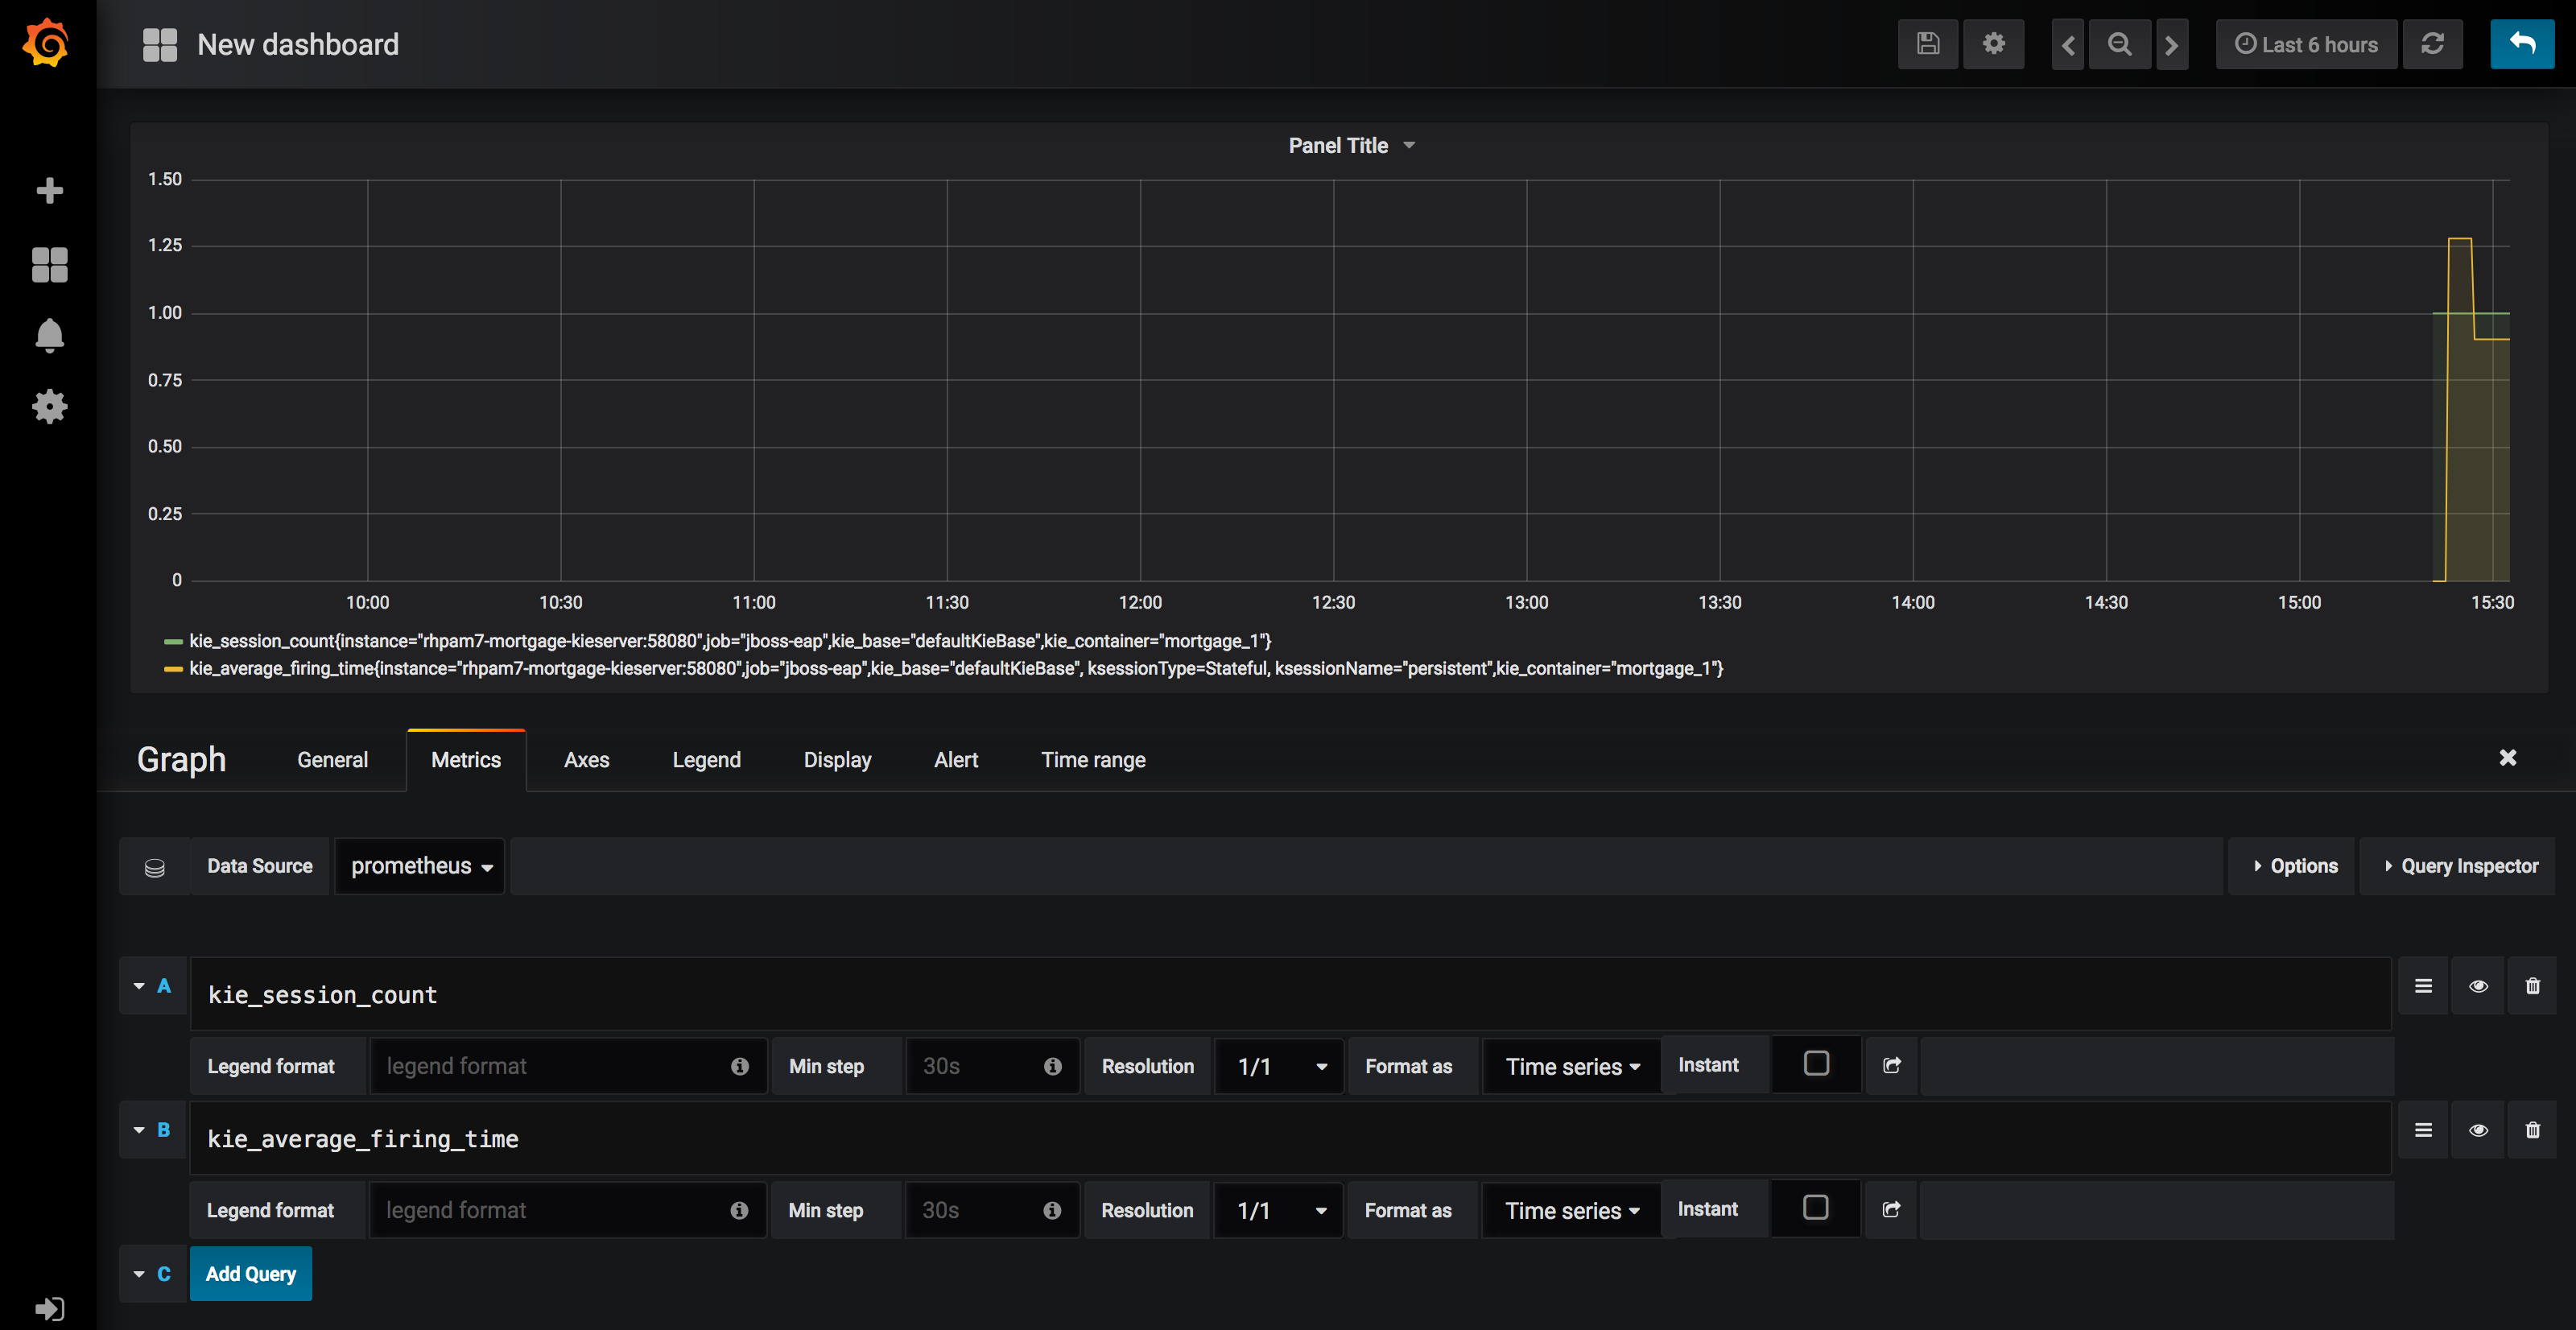
- Add another query by clicking on the Add Query button. Add antoher metric, for example
kie_average_firing_time.
Depending on your requirements, you can create the monitoring panels needed for your use-case.
