PEAKS is a peak detection library meant to locate peaks and valleys in a signal. This library works on both smooth data and on noisy data where other routines, especially those that rely upon derivatives, have difficulties. This library contains routines that are a re-implementation of the peak detection routine presented by Eli Billauer, which can be found here.
This library can be built using CMake. For instructions see Running CMake.
This library can be built using Fortran Package Manager (fpm) using the supplied fpm.toml.
fpm build
fpm test --list
fpm test <test_name, see `fpm.toml` or list>The documentation can be found here.
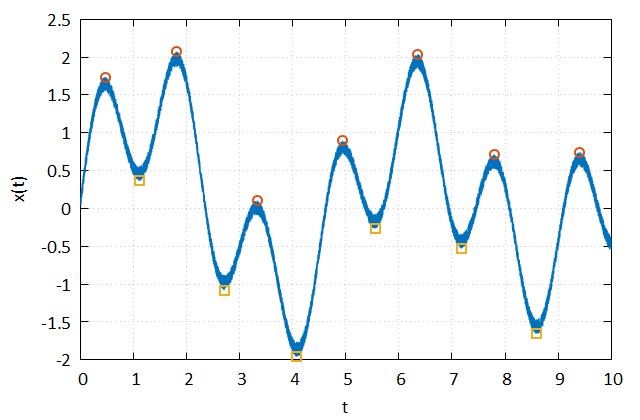
The following graph illustrates the example presented by Eli Billauer, and shows the ability of the library to locate the local maxima and minima, even in the presence of noise.

program example
    use iso_fortran_env
    use peaks
    use fplot_core
    implicit none

    ! Parameters
    integer(int32), parameter :: npts = 10000
    real(real64), parameter :: dt = 1.0d-3
    real(real64), parameter :: delta = 0.5d0

    ! Local Variables
    integer(int32), allocatable, dimension(:) :: imx, imn
    real(real64) :: t(npts), x(npts), r(npts)
    real(real64), allocatable, dimension(:) :: mx, mn, tmx, tmn
    type(plot_2d) :: plt
    type(plot_data_2d) :: d1, d2, d3
    class(plot_axis), pointer :: xAxis, yAxis

    ! Build a signal
    call random_number(r)
    t = linspace(0.0d0, dt * (npts - 1), npts)
    x = 0.3d0 * sin(t) + sin(1.3d0 * t) + 0.9d0 * sin(4.2d0 * t) + 2.0d-1 * r

    ! Locate peaks
    call peak_detect(x, delta, imx, mx, imn, mn)

    ! Get the t values at which the peaks/valleys were found
    tmx = t(imx)
    tmn = t(imn)

    ! Plot
    call plt%initialize()
    xAxis => plt%get_x_axis()
    yAxis => plt%get_y_axis()

    call xAxis%set_title("t")
    call yAxis%set_title("x(t)")

    call d1%define_data(t, x)
    call plt%push(d1)

    call d2%define_data(tmx, mx)
    call d2%set_draw_line(.false.)
    call d2%set_draw_markers(.true.)
    call d2%set_marker_style(MARKER_EMPTY_CIRCLE)
    call d2%set_marker_scaling(1.5)
    call d2%set_line_width(2.0)
    call plt%push(d2)

    call d3%define_data(tmn, mn)
    call d3%set_draw_line(.false.)
    call d3%set_draw_markers(.true.)
    call d3%set_marker_style(MARKER_EMPTY_SQUARE)
    call d3%set_marker_scaling(1.5)
    call d3%set_line_width(2.0)
    call plt%push(d3)

    call plt%draw()
end program