InsideForest is a Supervised Clustering technique which provides a comprehensive AI solution for identifying and describing categories within data, allowing to gain valuable insights and make data-driven decisions.
Supervised clustering definition: A machine learning technique that uses labeled data to group them into different clusters, with the aim that the clustering patterns are consistent with the previously assigned labels. Instead of letting the clustering algorithm find the clustering patterns on its own, supervised information is provided to guide its clustering process.
Whether you're working with customer data, sales figures, or any other type of information, our library can help you better understand your data and make informed decisions.
You could use our library to:
- Analyze customer data to identify the most profitable customer segments for your business based on their buying patterns and demographics.
- Classify patients based on their medical history and symptoms to better understand their health risks and needs.
- Analyze website traffic data to identify the most effective marketing channels for your business.
- Classify images based on their visual features to create more accurate and efficient image recognition systems.
By using our library to build and analyze a random forest, you can gain deep insights into the patterns and relationships within your data. This can help you identify hidden trends and make better-informed decisions, leading to more successful outcomes for your business.
You can install InsideForest using pip:
pip install InsideForestThe following packages are required to use InsideForest:
- scikit-learn
- numpy
- pandas
- collections
- matplotlib
- re
- glob
- random
- seaborn
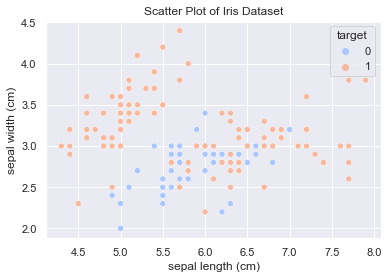
Here, we load the Iris dataset and create a DataFrame with the features and target variable. We modify the target variable to have binary values and plot the first two features.
from InsideForest import *
arboles = trees()
modelos = models()
regiones = regions()
descript = labels()
How is our data?
import seaborn as sns
import matplotlib.pyplot as plt
from sklearn.datasets import load_iris

iris = load_iris()
iris_df = pd.DataFrame(iris.data, columns=iris.feature_names)
iris_df['target'] = pd.Series(iris.target).apply(lambda x: 0 if x==1 else 1)
iris_df.head(5)

df = iris_df.copy()
var_obj = 'target'

# Plot
sns.set(style="darkgrid")
sns.scatterplot(x=df.columns[0], y=df.columns[1], hue=var_obj, data=df, palette="coolwarm")

plt.title('Scatter Plot of Iris Dataset')
plt.xlabel(df.columns[0])
plt.ylabel(df.columns[1])

plt.show()Now we prepare the data for training a Random Forest classifier. We split the data into training and testing sets, and define the parameter grid to perform cross-validation and obtain the best estimator. Then, we use the best estimator to obtain data insights.
X = df.drop(columns=[var_obj]).fillna(0)
y = df[var_obj]
X_train, X_test, y_train, y_test = train_test_split(X, y, test_size=0.25, random_state=161803)
param_grid = {'n_estimators':range(50,450,100),'max_depth':range(2,11,2)}

cv_model = modelos.get_cvRF(X_train, y_train, param_grid)
regr = cv_model.best_estimator_

separacion_dim = arboles.get_branches(df, var_obj, regr)
df_reres = regiones.prio_ranges(separacion_dim,df)

for i, df_r in enumerate(df_reres[:3]):
  if len(df_r['linf'].columns.tolist())>3:
    continue
  regiones.plot_multi_dims(df_r, df, var_obj)
  plt.show()
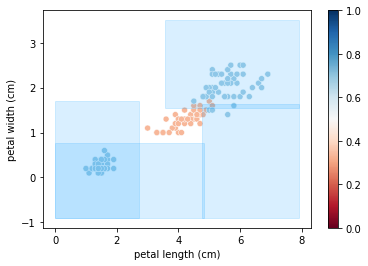
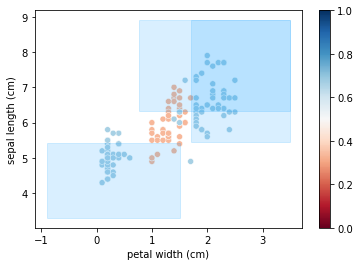
The blue regions depict several branches within the Random Forest, showing the most relevant areas where the target is located.
This project is licensed under the MIT License - see the LICENSE file for details.


