SAS® Viya® Monitoring for Kubernetes provides simple scripts and customization options to deploy monitoring, alerts, and log aggregation for SAS Viya 4.x.
Monitoring and logging may be deployed independently or together. There are no hard dependencies between the two.
The monitoring solution includes these components:
- Prometheus Operator
- Prometheus Exporters
- Alert definitions
- Grafana dashboards
- Kubernetes cluster monitoring
- SAS CAS Overview
- SAS Java Services
- SAS Go Services
- RabbitMQ
- Postgres
- Fluent Bit
- Elasticsearch
- Istio
- NGINX
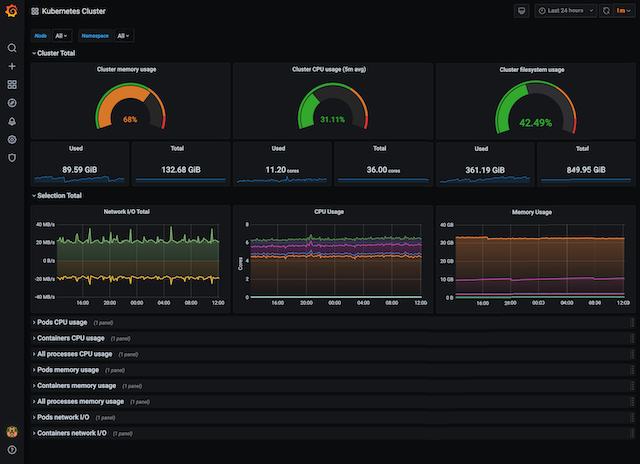
This is an example of a Grafana dashboard for cluster monitoring.

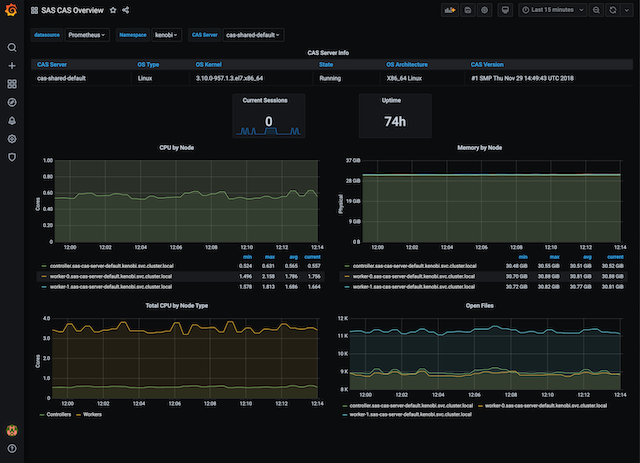
This is an example of a Grafana dashboard for SAS CAS monitoring.

See the documentation at SAS Viya: Monitoring for more information about using the monitoring components.
The logging solution includes these components:
-
- Custom Fluent Bit parsers
-
- Custom index pattern for logs
- Namespace separation
- Elasticsearch Exporter
-
- Custom Kibana dashboards
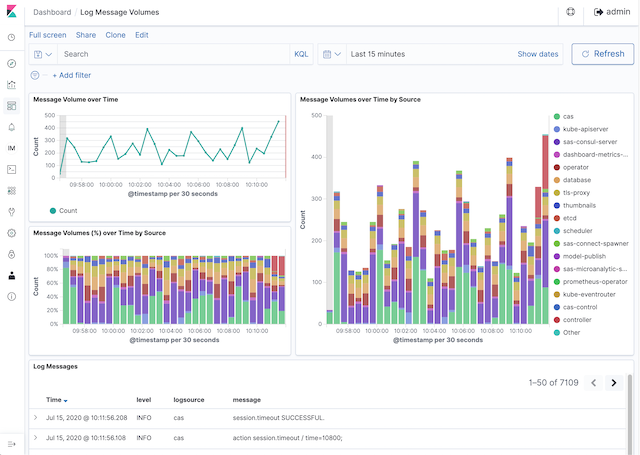
This is an example of a Kibana dashboard displaying log message volumes.
See the documentation at SAS Viya: Logging for more information about using the logging components.
- A Kubernetes cluster that meets the prerequisites for SAS Viya
- Helm version 3.x
kubectlwith cluster-admin access
See the monitoring README to deploy the monitoring components, including Prometheus Operator, Prometheus, Alertmanager, Grafana, metric exporters, service monitors, and custom dashboards.
See the logging README to deploy the logging components, including Fluent Bit, Elasticsearch, and Kibana.
The components that are deployed are highly customizable. The recommended
approach for customization is to set a USER_DIR environment variable. USER_DIR
points to a directory containing user-modified customization files which can exist
outside of your repository. You can use customization files to check in
environment-specific customizations into a separate Git repository, for example.
USER_DIR must refer to a directory. The directory can include any or all of
the following files in the structure below. Additional content is allowed, but
will be ignored.
- user.env
- [monitoring]
  - user.env
  - user-values-prom-operator.yaml
  - user-values-pushgateway.yaml
- [logging]
  - user.env
  - user-values-elasticsearch-open.yaml
  - user-values-es-exporter.yaml
  - user-values-fluent-bit-open.yaml
The default cluster StorageClass is used for both monitoring and logging
unless the value is specifically set in user-*.yaml files for monitoring or
logging. The deployment scripts issue a warning if no default StorageClass is
available, even if the value is properly set by the user. In this case,
you can safely ignore the warning.
