Our goal in this project is to develop machine learning models to predict future wildfire occurrences and severity based on location, local climate, and land surface conditions. Impact-wise, we believe that more powerful modeling techniques made possible with learning and inference-based models can increase the predictive, and ultimately preventative, power of fire risk management. We will explore various different techniques to shed light on optimal model types, as well as useful feature types.
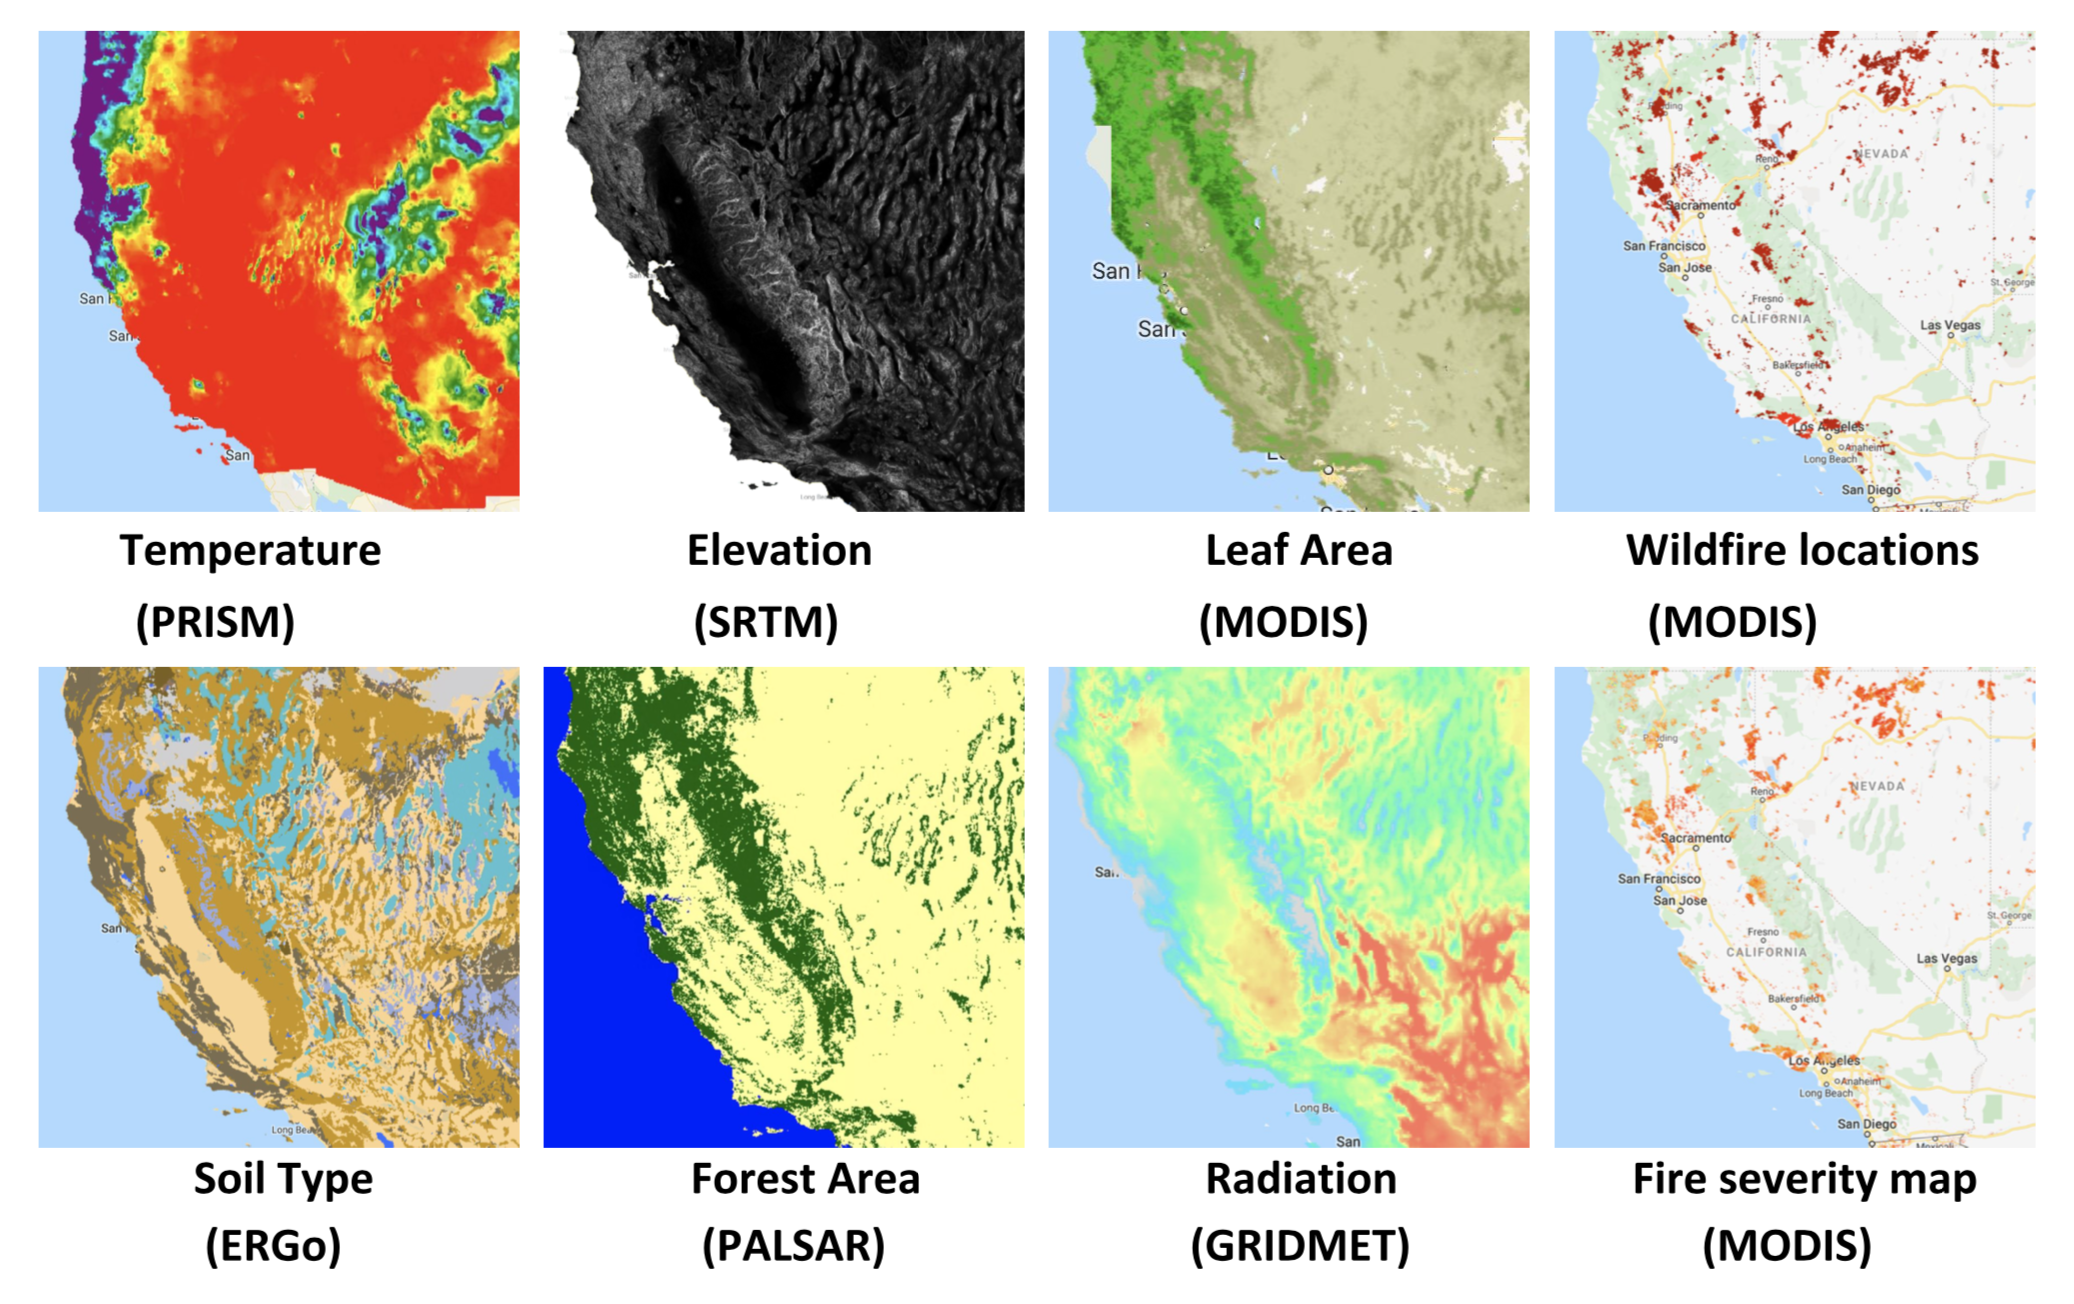
We use datasets from Google Earth Engine where data is collected from 9 satellite imagery and geospatial data sources. Given a latitude/longitude coordinate and date/time range, these sources provide information on temperature, precipitation, elevation, leaf area, soil type, human modification, forest area, radiation, and fire data. We sampled 100,000 random locations from within a bounding region of the State of California, and for each location we gathered a total of 45 features and 2 labels from 2017. The two labels indicate whether a fire has occurred, and the uncertainty/severity level of the fire.
Since we are interested in predicting future fires and the severity of those fires, we split our prediction task into 1) a fire/no-fire classification task and 2) a fire severity prediction task.
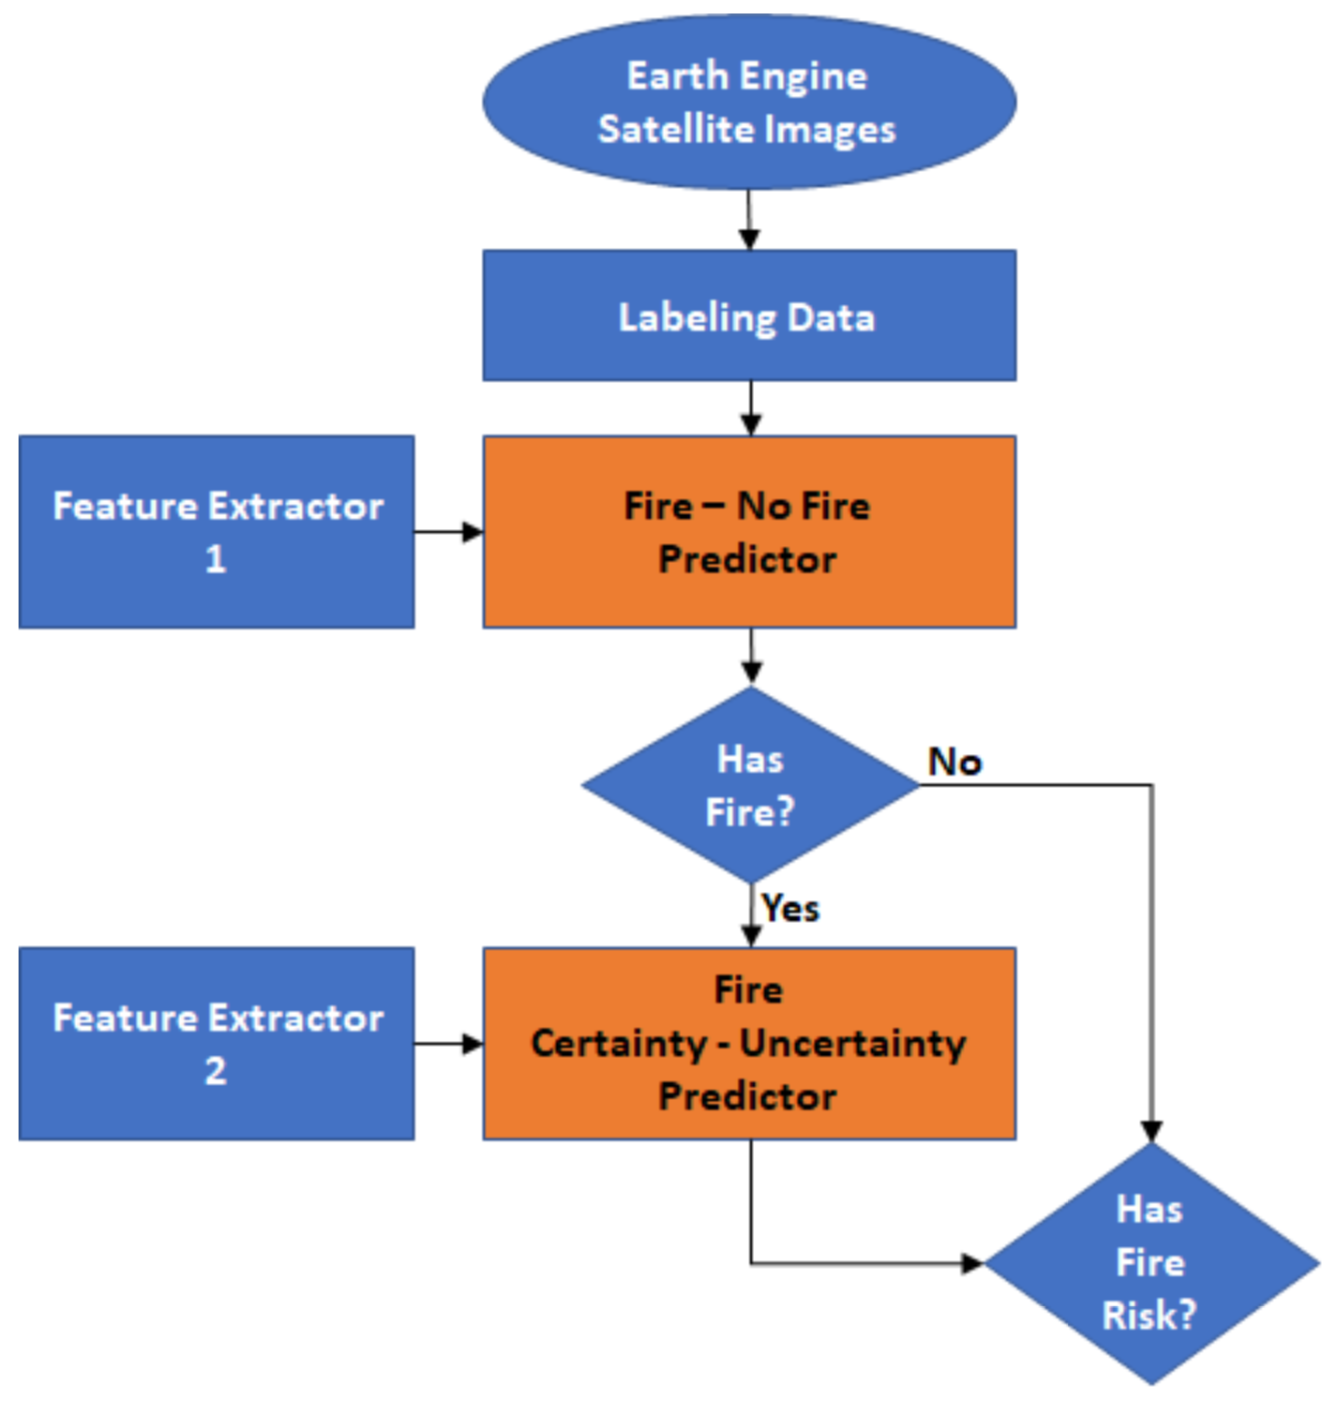
The fire/no-fire classification task uses all 45 features to predict the fire/no-fire label for each location in the training set. However, because the number of no-fire cases greatly outnumbers the fire cases, we train using a smaller dataset consisting of a 50/50 distribution between fire and no-fire cases. This ensures that the model does not simply predict no-fire for every datapoint. After training the fire/no-fire classifier in this way, we then test it using a full dataset consisting of the natural distribution between fire and no-fire cases. The fire severity prediction task also uses all 45 features to predict the fire uncertainty, although this model only trains using fire occurrence data points. The fire uncertainty is a metric from 1-100 (although most are between 1-20). Because we wanted precision and recall metrics that we could compare to the results of the fire/no-fire classifier and because we wanted to test similar models on both, we treated this prediction task as a classification task as well.
For the fire/no-fire classification, we experimented with seven different models to compare the effectiveness of each: Logistic Regression, Decision Tree, Random Forest, Gradient Boosting, AdaBoost, SVM, and Ridge Classifier.
Fire/no-fire model performance
| Model | Fire precision | Fire recall | Fire F1 score | No-fire precision | No-fire recall | No-fire F1 score |
|---|---|---|---|---|---|---|
| Logistic Regression | 0.01 | 0.82 | 0.02 | 1.00 | 0.77 | 0.87 |
| Decision Tree | 0.01 | 0.73 | 0.01 | 1.00 | 0.72 | 0.84 |
| Random Forest | 0.22 | 0.76 | 0.34 | 1.00 | 0.99 | 1.00 |
| Gradient Boosting | 0.23 | 0.83 | 0.36 | 1.00 | 0.99 | 1.00 |
| Gradient Boosting after downsampling | 0.66 | 0.83 | 0.73 | 1.00 | 0.99 | 0.99 |
| AdaBoost | 0.13 | 0.75 | 0.21 | 1.00 | 0.98 | 0.99 |
| SVM | 0.11 | 0.51 | 0.19 | 1.00 | 0.99 | 0.99 |
| Ridge Classifier | 0.13 | 0.75 | 0.21 | 1.00 | 0.98 | 0.99 |
We tested the following 7 models for effectiveness on the fire severity task: Logistic Regression, Decision Tree, Random Forest, Gradient Boosting, Multilayer Perceptron, K Nearest Neighbors, and Gaussian Process.
Fire severity model performance
| Model | Accuracy | Precision | Recall | F1 Score |
|---|---|---|---|---|
| Logistic Regression | 0.77 | 0.23 | 0.40 | 0.27 |
| Decision Tree | 0.76 | 0.32 | 0.45 | 0.37 |
| Random Forest | 0.77 | 0.37 | 0.47 | 0.41 |
| Gradient Boosting | 0.77 | 0.51 | 0.52 | 0.49 |
| Multilayer Perceptron | 0.78 | 0.52 | 0.51 | 0.51 |
| K Neighbors | 0.77 | 0.38 | 0.44 | 0.40 |
| Gaussian Process | 0.77 | 0.40 | 0.47 | 0.42 |
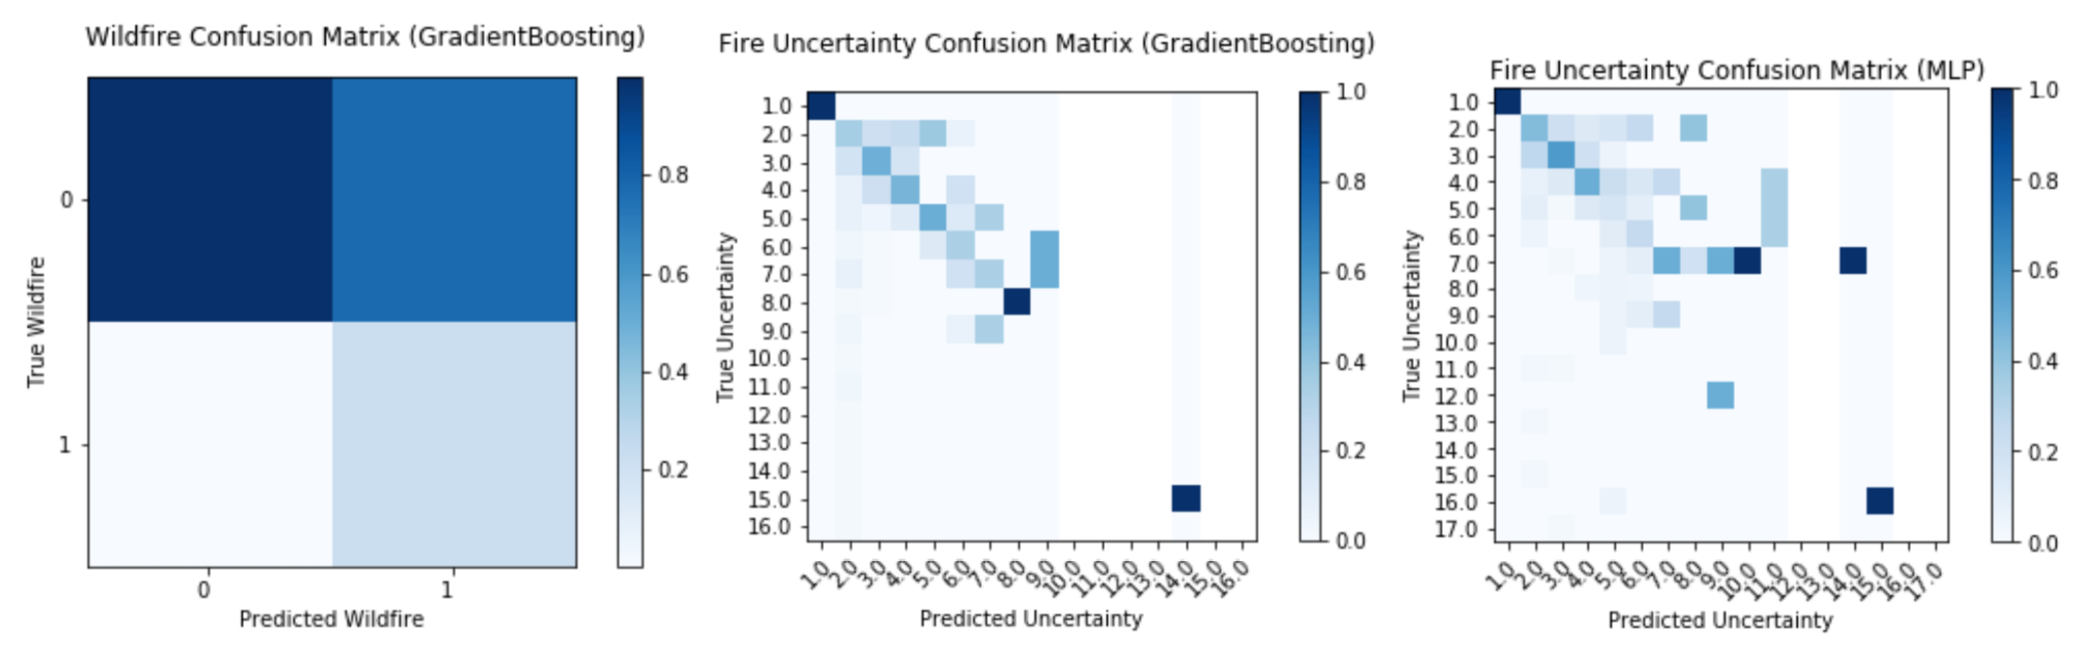
Fire severity classification using GBClassifier showed significant improvement relative to the classification using the traditional distance-based model, with ~62% increase in precision and ~15% in recall when training data using a two-level pipelined system. Significant improvements in classification accuracy were observed for most fire uncertainties, with considerably less misclassification for high severity fires (uncertainty < 20). Though the precision and recall results are similar for GBClassifier and Multilayer Perceptron, GBClassifier performed better in terms of misclassification, which could be observed from the confusion matrix of fire uncertainty. The false predicted fire severity was much closer to the diagonal, while the results of Multilayer Perceptron were sparsely spread along the diagonal.
Confusion matrices of selected models
Additionally, the below plot compares the decision surfaces learned by a Logistic Regression (first column), by a Gradient Boosting classifier (second column) and by a stacked RF-XGBoost classifier (third column). Here we picked these three representative models to compare as these represents Baseline (Logistic Regression), resulting Optimal Model (Gradient Boosting classifier) based on manual experimentation and resulting Optimal Model (stacked RandomForest- XGBoost) based on automated experimentation using TPOT.
Decision surfaces of selected models

The following plots highlights the impact of top 3 features (surface downward shortwave radiation (srad), wind direction and wind velocity) on causing wildfires for both Random Forest and Gradient Boosting.

Key observations for Gradient Boosting For the fire/no-fire classification, studying the relationship among the wind velocity, wind direction and shortwave radiation (srad) we found that the main factors causing wildfire events were high surface temperature along with low-to-moderate wind velocity, and wind that originated in the south was more likely to cause wildfires.

For the fire severity prediction, the most important features for the Gradient Boosting model are elevation, daily maximum temperature and global human modification. The relationship graphs of these three features showed that we had more destructive fires in the area with high human modification (e.g. settlement, electrical infrastructure, agriculture, transportation, etc.) and areas with such high human modification value were mostly located at low elevation. Additionally, precipitation was another relevant feature, which was the fourth important feature in both prediction systems.

Based on the experimentats performed, we conclude that the ensemble models can predict most fire cases correctly and also give low false prediction for no-fire cases. Additionally, the Random Forest and Gradient Boosting perform better on wildfire prediction and Gradient Boosting and Multilayer Perceptron can predict fire severity more desirably. Furthermore, fire/no-fire prediction is dominated by a small number of features, while fire severity is based on the overall effect features. The wind velocity, wind direction and surface temperature are important factors for occurrence of fire, and human activity is correlated with worsened fire severity.
- Google Earth Engine, https://earthengine.google.com/
- Pechony O, Shindell DT (2010). Driving forces of global wildfires over the past millennium and the forthcoming century. PNAS, http://www.pnas.org/content/107/45/19167
- Eidenshink J, Schwind B, Brewer K, Zhu Z, Quayle B, Howard S (2007). A Project for Monitoring Trends in Burn Severity. Fire Ecology, https://doi.org/10.4996/fireecology.0301003
- Heisig, J. (2018, April 12). Step by Step: Burn Severity mapping in Google Earth Engine. UN Spider, http://www.un-spider.org/advisory-support/recommended-practices/recommended-practice-burn-severity/burn- severity-earth-engine
- Carolynne Hultquist, Gang Chen, Kaiguang Zhao: A comparison Gaussian process regression, random forests and support vector regression for burn severity assessment in diseased forest: 2014 https://pages.uncc.edu/gang-chen/wp-content/uploads/sites/184/2014/10/Hultquist_RSL_2014_Machine- Learning-Diseased-Forests.pdf
- Williams, Sky B.T.: Wildfire Destruction - A Random Forest Classification of Forest Fires: 2018 https://towardsdatascience.com/wildfire-destruction-a-random-forest-classification-of-forest-fires- e08070230276
- L. Collins, P. Gfiggioen, G. Newell, A. Mellor: The utility of Random Forests for wildfire severity mapping: 2018 http://freepaper.me/PDF/?pdfURL=aHR0cHM6Ly9mcmVlcGFwZXIubWUvbi83QTh5SFRlQjdlMEFNLVVPQk VUcXV3L1BERi9mNC9mNGZhOWUzMjRlZGYzMWYzMjcxZjA4ZWZkNzFlNGJjNi5wZGY=&doi=10.1016/j.rs e.2018.07.005
- Daly, C., Halbleib, M., Smith, J.I., Gibson, W.P., Doggett, M.K., Taylor, G.H., Curtis, J., and Pasteris, P.A. 2008. Physiographically-sensitive mapping of temperature and precipitation across the conterminous United States. International Journal of Climatology, 28: 2031-2064
- Daly, C., J.I. Smith, and K.V. Olson. 2015. Mapping atmospheric moisture climatologies across the conterminous United States. PloS ONE 10(10):e0141140. doi:10.1371/journal.pone.0141140.
- Hengl, T. 2007. Monthly Precipitation in Mm At 1 Km Resolution Based on Sm2rain-ascat 2007-2018, Imerge, Chelsa Climate and Worldclim https://zenodo.org/record/3256275#.XetO9y-ZMUE