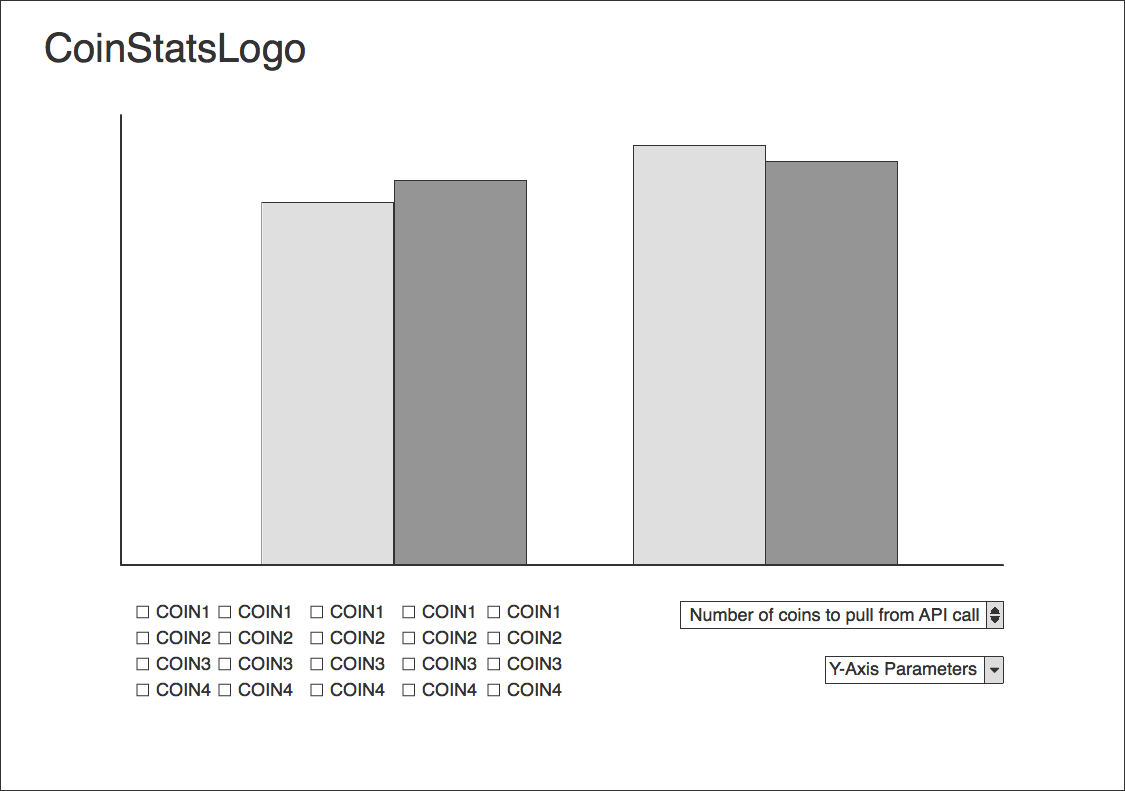
CoinStats is a data visulization tool that allows a user to quickly scope out the current crypto currecy market climate. The cryptocurrency market is a rapidly growing and thriving marketplace that requires persistant monitoring.
With CoinStats, users will be able to:
- Sort charts based on
- Price in their desired currency
- Market Volume
- % Change in value over a specified time period
- Determine how many coins will be displayed on the graph.
- Allow the user to compare specific coins against each other
- Pull current data from an external API
- CoinMarketCap API
This app will consist of a single screen with a bar graph with each currency on the X-Axis and the desired stat to view on the Y-Axis. Selectors in the form of dropdowns for the specific currency and
This project will be implemented with the following technologies:
- Vanilla JavaScript for overall structure and data filtering,
JQueryfor managing fetching of market data from an external API.ChartJSfor graph rendering.
Over the weekend:
- Research and select an appropriate API for data.
- Note: was going to use CoinBin but was unavailable at the time of research. Determined that Coinmarketcap's api was a sutiable replacment.
- Determine the appropriate Graphing library for displaying data
- Looked into both D3 and Chart.js, determined Chart to be the most sutiable library.
Day 1: Setup all necessary Node modules, including getting webpack up and running. Create webpack.config.js as well as package.json. Write a basic entry file and ensure that everything is running properly.
- Get
webpackup and running. Complete skeleton of index.html. - Get a basic chart up and running with chartjs.
Day 2: Ensure that graphing is working without selectors, style the graphs and determine the final overall look of the project.
- Determine the best way to handle data, is it possible to have live updating data?
- Style the graphs and make everything reactive.
- Implemented jsonbin caching of data as not to get rate limited from coinmarketcap api
- App currently
GETs from a jsonbin that contains keys for currencies that have already been pulled. If a currency has not been previously requested, the app will pull new data from coinmarketcap andPOSTto jsonbin and thenPUTthe original link table with the new jsonbin link. If the currency has been previously requested, the app will check to ensure that the data is not stale (> 6 minutes). If the data is determined to be stale, new data will be requested from coinmarketcap and then bePUTback to jsonbin.
- App currently
Day 3: Expand the capabilities of the graphs, implement user selection and filtering.
- Determine and implement the most optimal amount of data to show on screen.
- Implement user selection of data
- Implemented pulling of relevant news articles from newsapi.org. * Pulls relevant articles based on top cryptocurrency from selected category.
Day 4: Polish up UI and UX and finish README and clean up code.
- Ensure that all code is functioning and ready for production
- Ensure that code is behaving on an externally hosted env.
