The data behind Moore's law
Data & graphs on the progress of technology; visualizing the road to the singularity™
This repository collates and visualizes data sets which demonstrate the increasing trends of computing power, storage capacity, astronomical surveys, etc. The aim of these graphs is to encourage discussions related to Moore's law to be based on data, rather than assumptions or hear-say.
The various sources behind the data points are documented inside the data directory of this repository, and the graphs can be reproduced using the included plot_progress.py script.
The Graphs
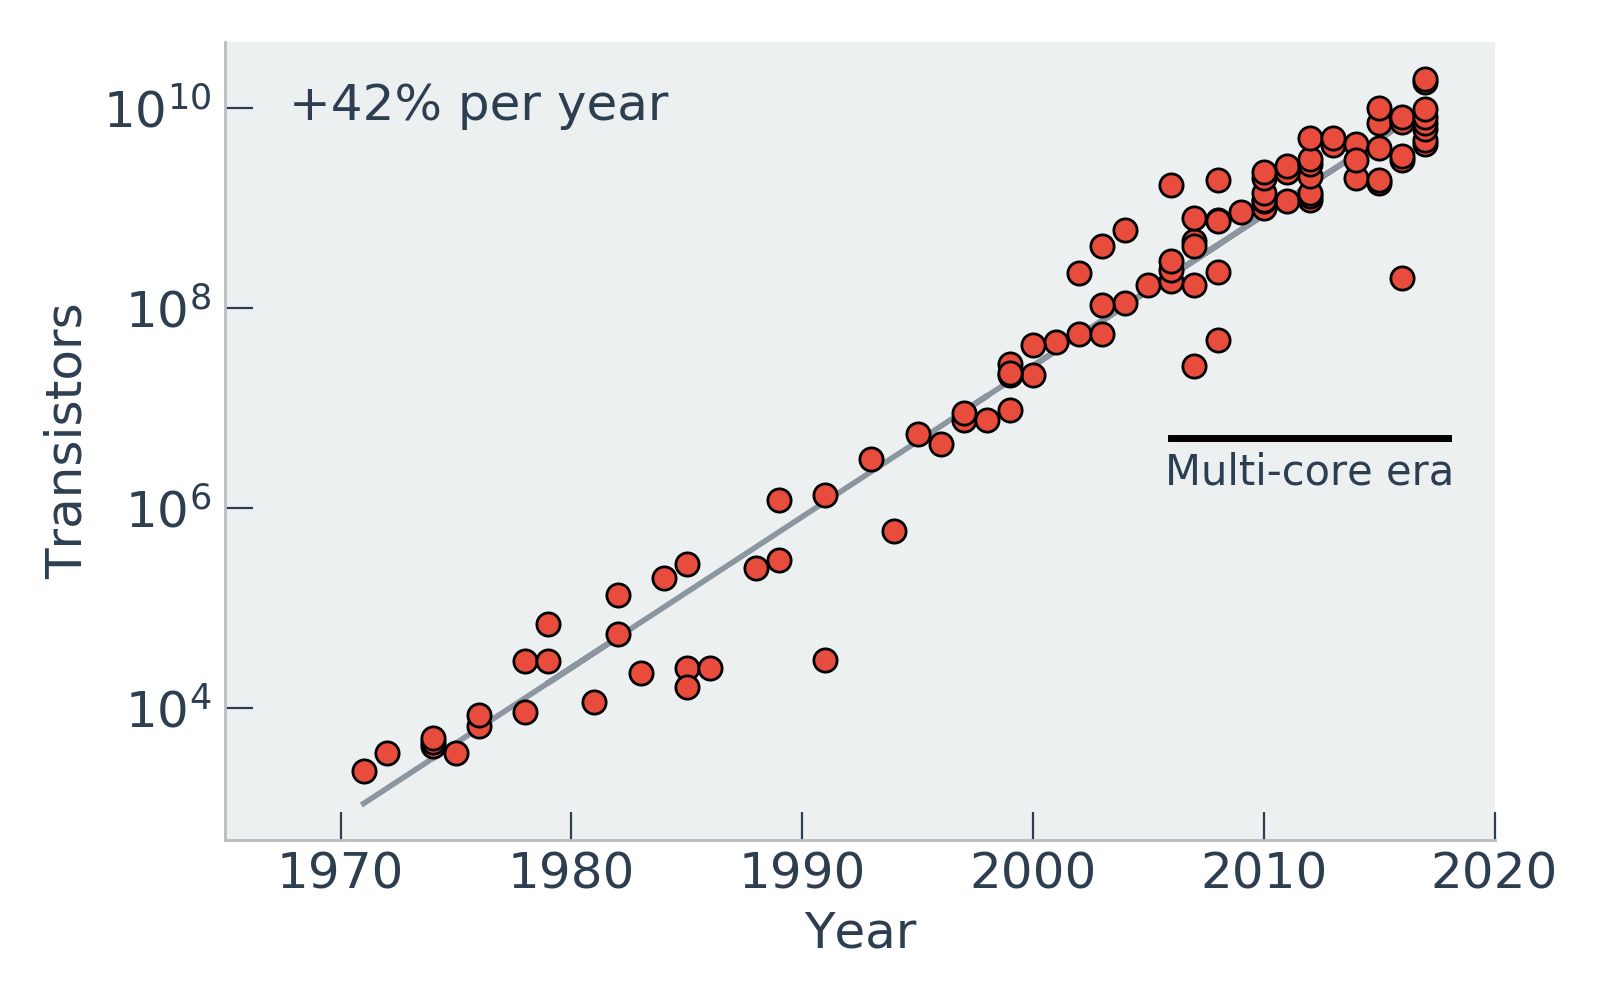
Computing power

Storage & I/O


Astronomical surveys
![]()
![]()
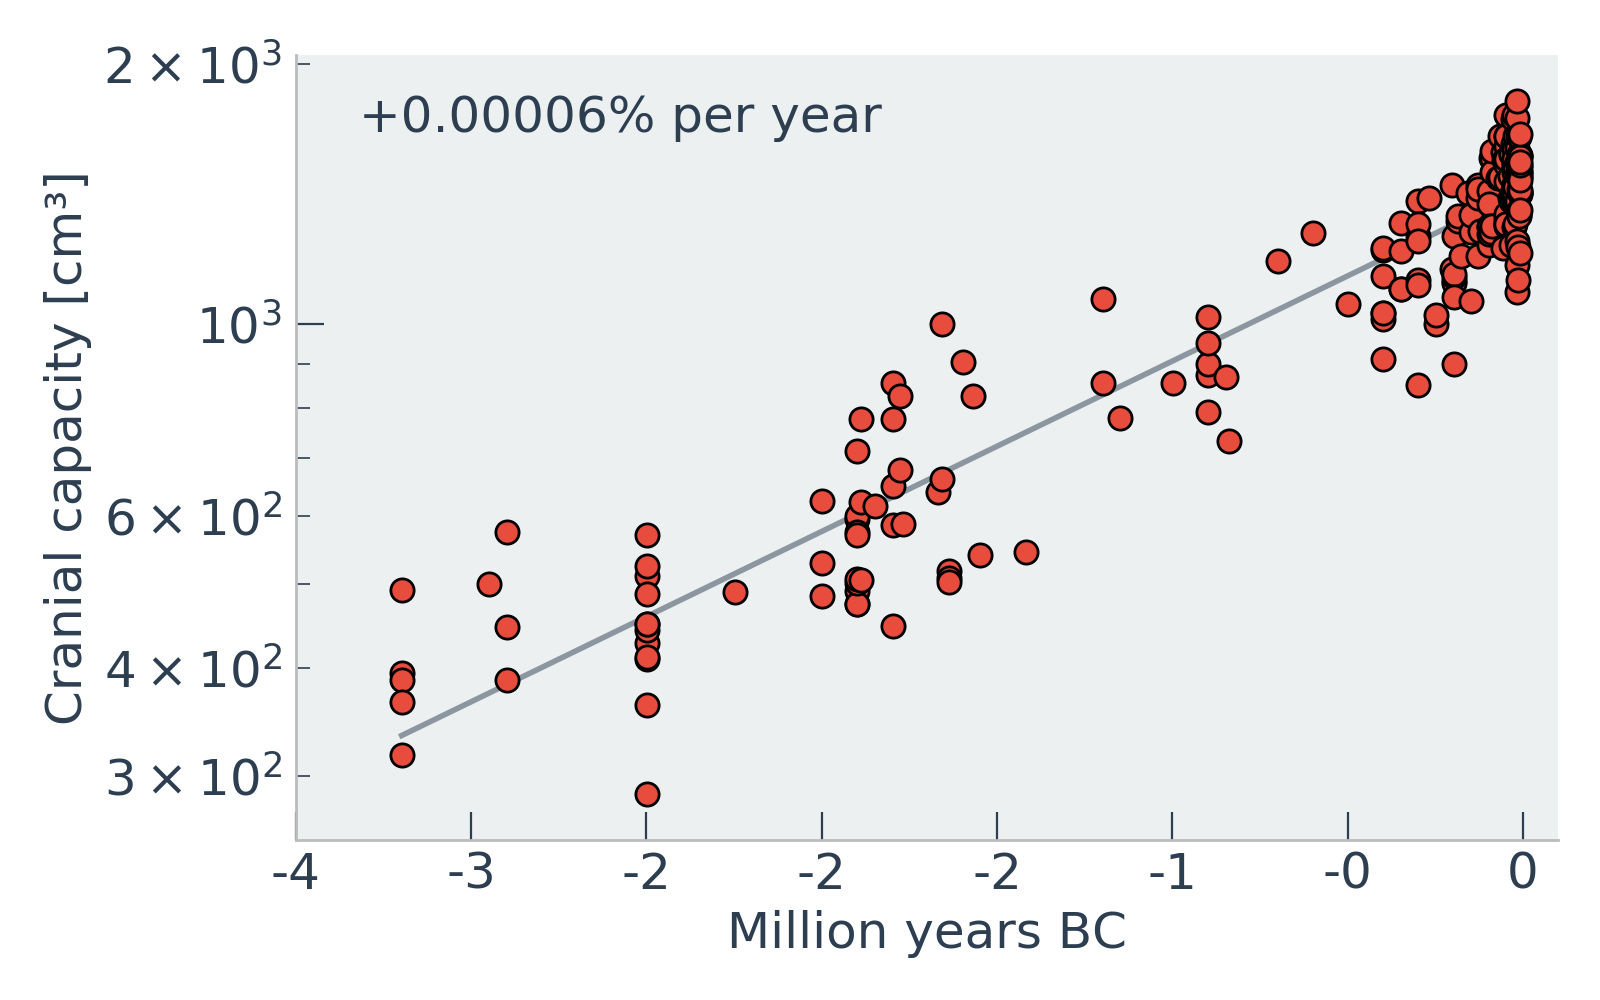
Biology
Slides
A short presentation using these data is shown here:
https://speakerdeck.com/barentsen/a-3-minute-rant-on-the-deluge-of-data-in-astronomy
Usage
To create the graphs and fit the exponential trends to all the data sets in this repository, run:
python plot_progress.py
Dependencies
- matplotlib
- numpy
- astropy
Contributing
Additional data sets, or corrections to the existing ones, are welcome. Please open a pull request!
Authors
- Geert Barentsen (@barentsen)
- Josh Peek (@jegpeek)
- See the
READMEfiles in the sub-directories underdatafor data source credits.
License
Made available under the MIT License,
unless otherwise specified in the README files inside the data sub-directories.