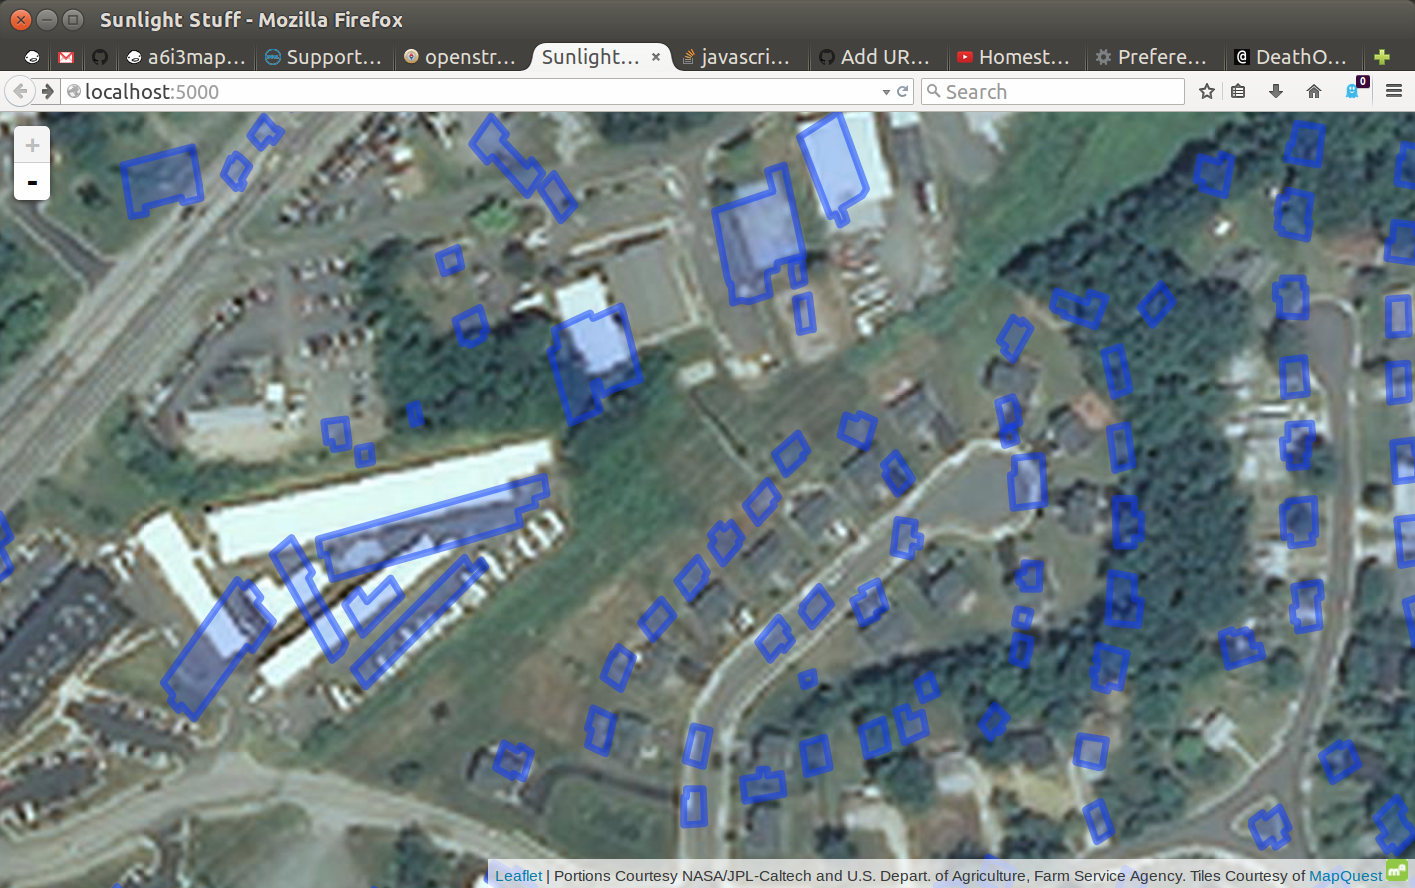
This project displays a map with clickable regions that correspond to rooftops. When things are clicked, tons of useful info gets spat out.
Ex.:
As you can see, it's in development.
The blue regions should correspond with the rooftops; you can click the and see little popups with tables in them, which look a little like this:
Building Area:        19375.7 m2
Useable Build Area:   13272 m2
Percent Useable:      68%
Expected Output:      1617230 kWh
System Size:          197.184 kW
Expected Savings:     $21690.24
Rooftop ID:           4718
It also has a form at /import to load shapefiles to the database, and a form at /setpass to change the password that protects the aforementioned /import form.
A PostgreSQL database with PostGIS installed is required. You can get both with
apt-get install postgresql postgis. After this, a database must be created
for PVMap to use. Run the init.sql file on the database, and
change the contents of flaskconfig.py as needed.
For a full overview of PVMap's design, see documentation.txt.
