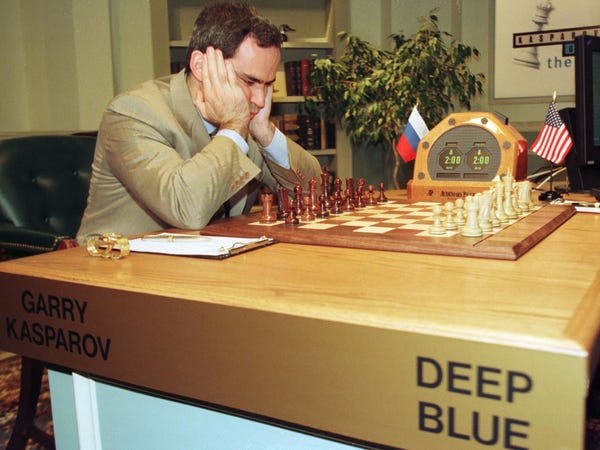
Since the industrial revolution the struggle between human and machine has been ongoing.
Data Scientists vs Pure Processing Power

While much of data science is being automated there will still be a need for insights that come from intuitive thinking that computers have yet to match.
Using publicly available housing data from Ames Iowa I will run three different scenarios showing that brute processing power of a machine cannot match the sly intuitiveness of a human.
Data on housing sales for Ames Iowa was used to compare regressions between several scenarios.
Exploratory data analysis paired with outside research led to the selection of several features for user selected models as well as feature selection of categorical data into dummy columns.
All models are run on a linear regression then scored on the R^2 Adjusted value. This metric was chosen as it will punish random models that have a large number of features.
All features selected through exploratory data analysis and outside research.
A random number of randomly selected features will be run through the regression. The number of features is the square root of all features +- 10 percent.
The model is run 1_000_000 times and the highest R^2 Adjusted that is less then one is selected.
The user features are combined with a randomly selected number of features similar in selection criteria in the Random Model. Function is modified though to prevent double feature assignment.
This model is also run 1_000_000 times
To test if pure processing power can create a better model a random number of randomly selected features will be run through a linear regression. This will be iterated though 1,000,000 times.
SCORES
Looking at that data and interpreting with the use of outside data a selection of features will selected to run a linear regression with.
| Model | RSME | R^2 Adjusted | Number of Features |
|---|---|---|---|
| User | 30818.38 | 0.8449 | 6 |
| Random | 35770.18 | 0.7882 | 24 |
| Combination | 31190.64 | 0.8567 | 21 |
To compare each model scenario we will use the R^2 adjusted metric as that will penalize data sets for having a large number of features.
As we can see both scenarios that had user selected input have an increase in R^2 of over five percent.
This significant increase in efficiency shows the value of human input.
The highest score of using both human insight and machine processing power points us to further integrating the two.
- Compare levels of R^2 of different numbers of n
- Improve data cleaning with normalizations and standardizations
- Develop more feature engineering
- Develop random model to include all related dummies if one is selected
- Redevelop models with ElasticNet to account or large numerical data and numerous dummy columns


