Segmenting electrocardiogram (ECG) into its important components is crucial to the field of cardiology and pharmaceutical studies, because analyses of ECG segments can be used to predict heart symptoms and the effects of cardiac medications, as [1] says.
ECG waves are divided into several categories, such as: P wave, QRS complex, T wave and lastly Extrasystole. Additionally, we add an extra category to these samples which do not belong to any of these given classes. ECG signal segmentation can be reinterpreted as a classification of each sample from the signal.
The goal of this project is to train a neural network, which will be able to segment ECG signal per each sample into given categories with high accuracy and reliable generalization wherever possible.
Through the following sections, we will discuss how to get some insights
from data, how to preprocess them and prepare into a suitable structure
for feeding the network.
Next, we will discuss the neural network architectures along with their
training and validation processes, as well as the processes of testing
and presenting results.
The data are not presented due to license agreement of data providers.
Our dataset is constructed from three different data sources - namely database#1, database#2 and database#3.
Structure of split.csv:
print(df.head(10)) name Database Patient Lead filename
0 database#1/database#1_code_AVF.json database#1 _code_ AVF database#1_code_AVF
1 database#1/database#1_code_AVL.json database#1 _code_ AVL database#1_code_AVL
2 database#2/database#2_code_I.json database#2 _code_ I database#2_code_I
3 database#2/database#2_code_II.json database#2 _code_ II database#2_code_II
4 database#3/database#3_code_III.json database#3 _code_ III database#3_code_III
4 database#3/database#3_code_III.json database#3 _code_ III database#3_code_IIISince there are multiple sources, probably there can be also multiple
ways how the data was made. Script preprocessing.py checks this claim.
| # ECG leads | sampling rate | # of patients | # lead types | # distinct ECG sizes | min/max over all leads | total length | |
|---|---|---|---|---|---|---|---|
| database#1 | 105 | ~112 Hz | 12 | 12 | 228, 229, 230 | 10/83 | 24 045 |
| database#2 | 157 | ~257 Hz | 34 | 12 | 3 000, 5 000, 10 000 | -13.69/14.26 | 851 000 |
| database#3 | 29 | ~360 Hz | 29 | 1 | 10 000 | -2.34/2.59 | 290 000 |
Visualize short ECG sequences for each database to show how they are similar (or not).
database#1
database#2
database#3
Occurrence intervals between P and T waves differ in the length of the period. Except for database#1 in the other two databases, it seems there is much more noise. So, by looking at the table above, database#1 is most likely a database with the highest quality for the price of being the smallest one.
ECG signal is a non-stationary (mean does not change over time) type of time-series data. There are several different approaches how to preprocess a raw ECG signal. In short, this is a summary of various data preprocessing methods that people in the field are commonly doing (according to our best knowledge):
-
Time-series analysis
- differencing - to transform series from non-stationary to stationary one;
- median filter/smoothing - filtering noise;
- FSST (Fourier Synchrosqueezed Transform) - extract time-frequency features from signal as showing [4];
-
Domain-knowledge
- Low (Baseline Wander - BWR) and High Frequencies - these methods remove useless features from data (e.g. patients breathing);
-
Arbitrary sampling rate
- work [2] presenting a novel approach of preprocessing the signal in the way that can be applied in network with arbitrary frequency;
The data as they are, are not in suitable form to consume for to most of
the models. The structure/form of the data we change by choosing a fixed
appropriate size of sequence length - window and dividing the
originate sequence by them, we can construct a dataset of N samples of
window length.
The window should be not overlapping, because we are intending fitting
the data by the sequence model, which is implicitly capable of capture
patterns of longer dependencies and it also lead to huge increasing of
data. (Although it's a necessary step for some models.)
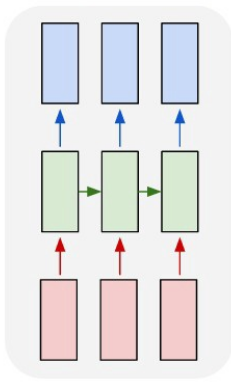
Deep Learning model of our choice is ECG-SegNet based on LSTM network introduced in paper [1]. Its architecture is of type many-to-many that has synced sequence of input and output pairs. Consist of two bidirectional LSTM hidden layer with tanh activation function followed by two linear layer with ReLU activation. For regularization purposes in the network is used Dropout. Last layer is responsible for reshaping the output.
To make the experiment more interesting, later we will try out an
altered version of this network - Cnn-SegNet.
We would like to realize following idea - use as the first layer in the
network 1-dimensional convolutional layer for "feature extraction"
(which is designed for signal processing) and the rest of the network
will remain the same. Within this approach, later we will be inspiring
with various sources from Literature.
Here we describe in what way we have designed several baselines. Our first attempt is with the SegNet model. Here, with this model, we are not interested in the manipulation of its parameters (neither hyper) we are interested only in how various data preprocessing steps affect the model performance.
The baselines/experiments are the following:
- Raw ECG data,
- Normalized raw ECG data,
- Standardized raw ECG data,
- Normalized raw ECG data + preprocessing with BWR,
- Standardized raw ECG data + preprocessing with BWR,
Standardization is defined by Z-Score and normalization is defined by rescaling. BWR is Baseline Wander Removal filter method mentioned earlier.
Model expect for an input the matrix with a shape N x T x F, where:
- N is number of samples or sequences,
- T is length of single sequence,
- F is number of features.
Model has to generate an output in a shape T x C, where
- T is sequence length,
- C is number of classes.
Without any preprocessing of the ECG data, number of features is equal
one, F = 1 (only raw data). With increasing preprocessing steps we can
make extend the dataset according to F dimension. In case of 4th and
5th experiments: F = 2.
Sequence length of the input for LSTM network according to various
literature is roughly recommended to value in range 200-400. By looking
at the graph of ECG signal above, particularly at the database
Database#1 there is perhaps a need for longer window that the model
would be able to capture reasonable information even from a single
sequence.
But since we want to make things slightly easier at least at building
the dataset, so we leave the size of the window to 220 lengths, i.e.
windows_size = 220 - it's the minimal length of all leads in each
database.
Built dataset by joining all 3 data sources of 5459 sequences each of 220 timestamps, which is split into:
- train set - 75% 4166 sequences,
- validation set - 5% 258 sequences,
- test set - 20% 1035 sequences.
All sets are mutually exclusive. The training loop is set for 100
episodes. Learning algorithm for the SegNet network is Adam
optimizer using a mini-batch of size 32 and Cross-Entropy is
used as a loss function. After each epoch validation error is
compute. All the outputs of the loss function and weights of the model
are stored after each episode.
None of above the parameters was changing across the experiments.
| 1. Raw ECG | 2. Normalized raw ECG | 3. Standardized raw ECG | 4. Normalized raw ECG + BWR | 5. Standardized raw ECG+ BWR | |
|---|---|---|---|---|---|
| 0.901 | --- | 0.902 | --- | 0.942 | |
| SegNet | 0.897 | --- | 0.887 | --- | 0.919 |
| 0.889 | --- | 0.885 | --- | 0.922 |
The results are obtained after training. From up-to-down are accuracy scores in percentage for training, validation, and test set respectively. The score between raw and standardized version of ECG signal are not so different, but when the model consumes it preprocessed is seems that the performance of the model is getting better.
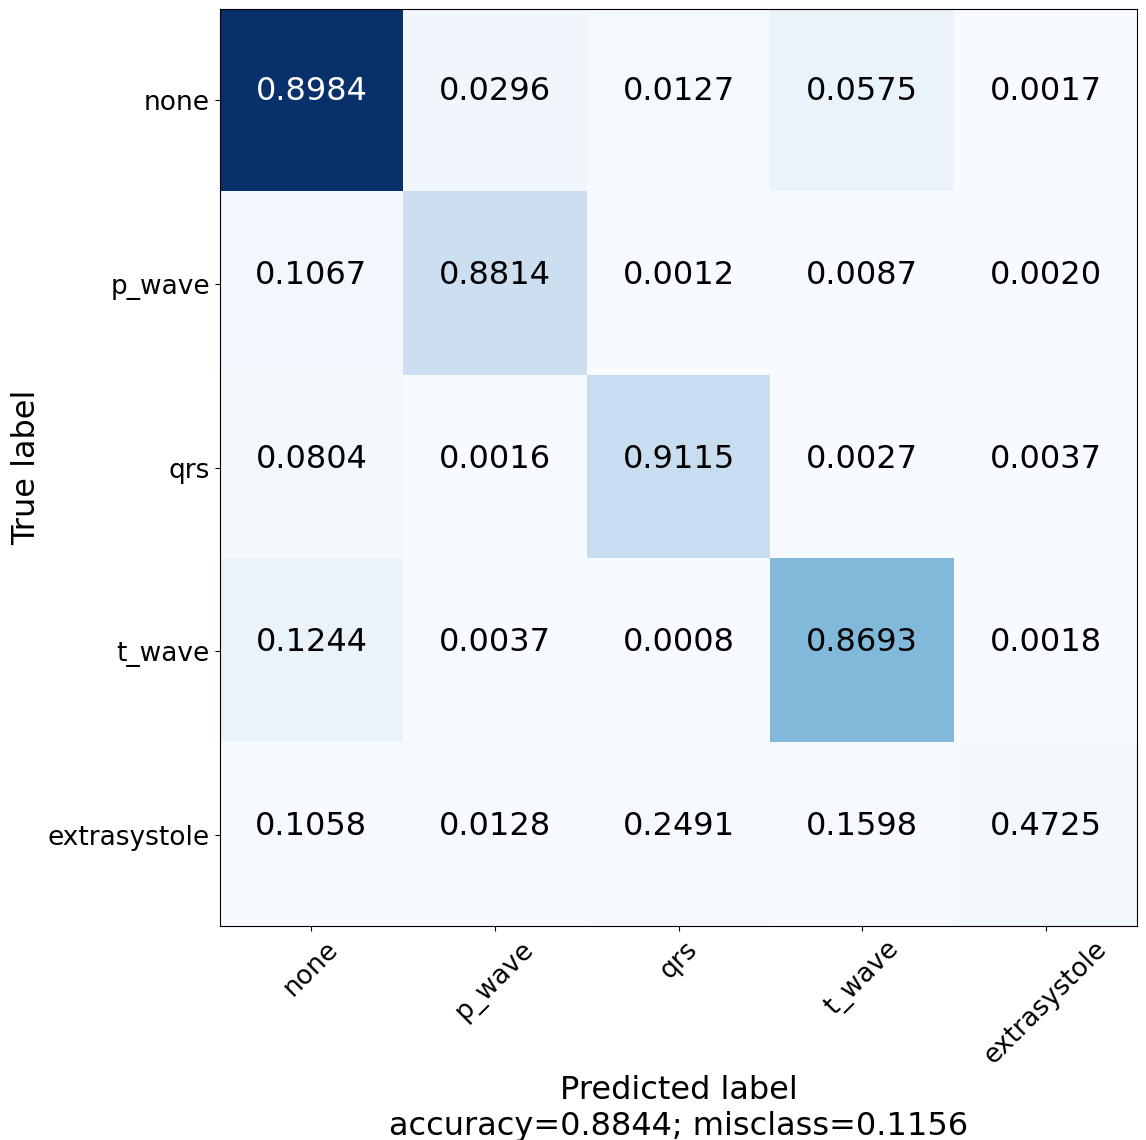
Construct and visualize confusion matrix to see for which classes the model is lacking the power of predictivity.
| Z-Score ECG 3rd Experiment | Z-Score ECG + BWR 5th Experiment |
|---|---|
 |
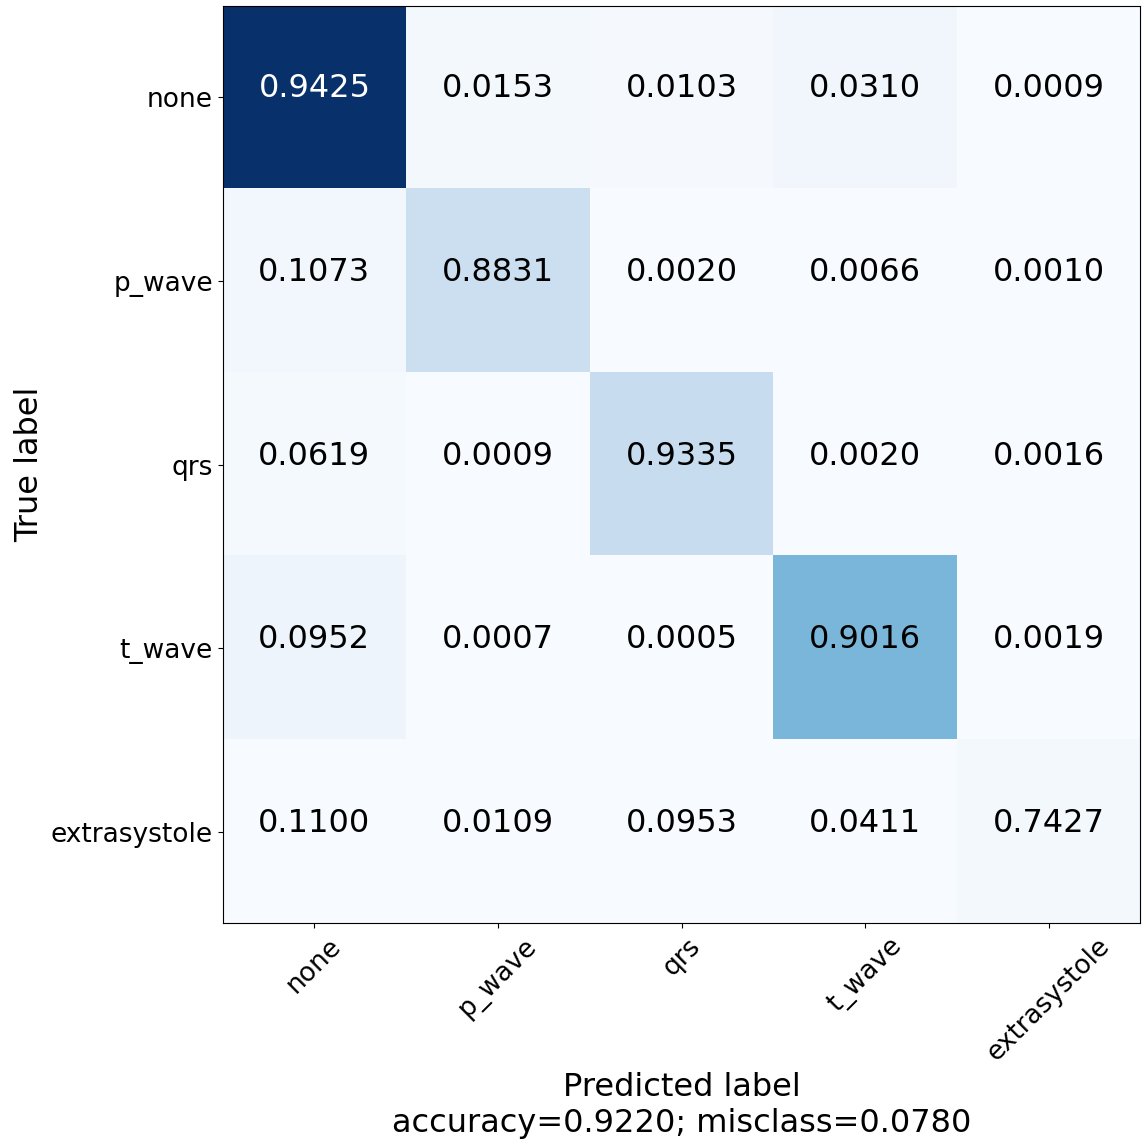 |
SegNet detailed results are follows:
| Neutral | P-wave | QRS-wave | T-wave | Extrasystole | |
|---|---|---|---|---|---|
| Z-Score ECG (3rd) | |||||
| Precision | 0.90 | 0.86 | 0.91 | 0.86 | 0.79 |
| Recall | 0.90 | 0.88 | 0.91 | 0.87 | 0.47 |
| F1-Score | 0.90 | 0.87 | 0.91 | 0.86 | 0.59 |
| Z-Score ECG + BWR (5th) | |||||
| Precision | 0.91 | 0.93 | 0.94 | 0.93 | 0.88 |
| Recall | 0.94 | 0.88 | 0.93 | 0.90 | 0.75 |
| F1-Score | 0.93 | 0.90 | 0.94 | 0.91 | 0.81 |
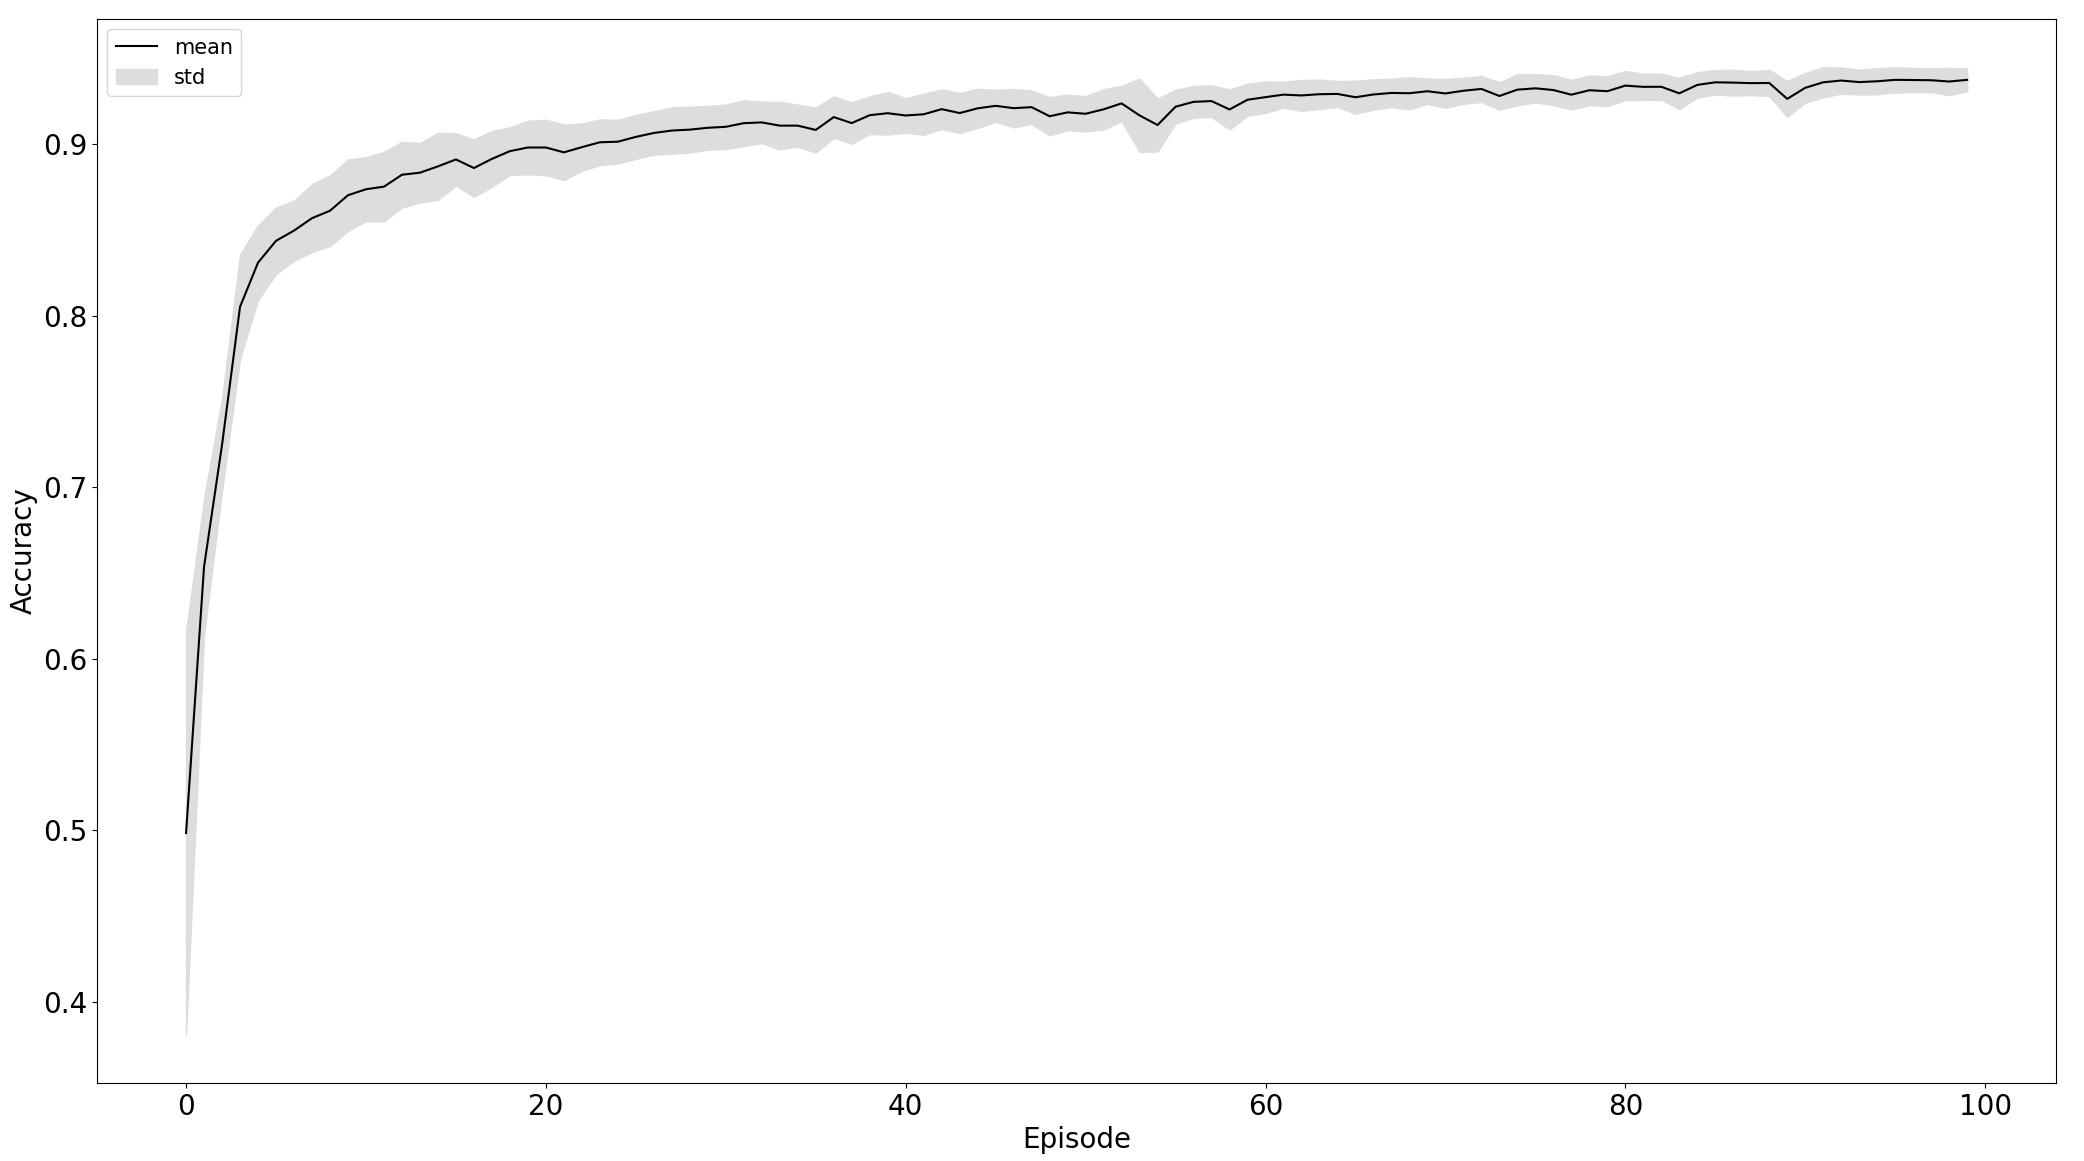
Comparison of training on standardized raw and preprocessed data, left and right respectively:
| 3rd Experiment | 5th Experiment |
|---|---|
 |
 |
 |
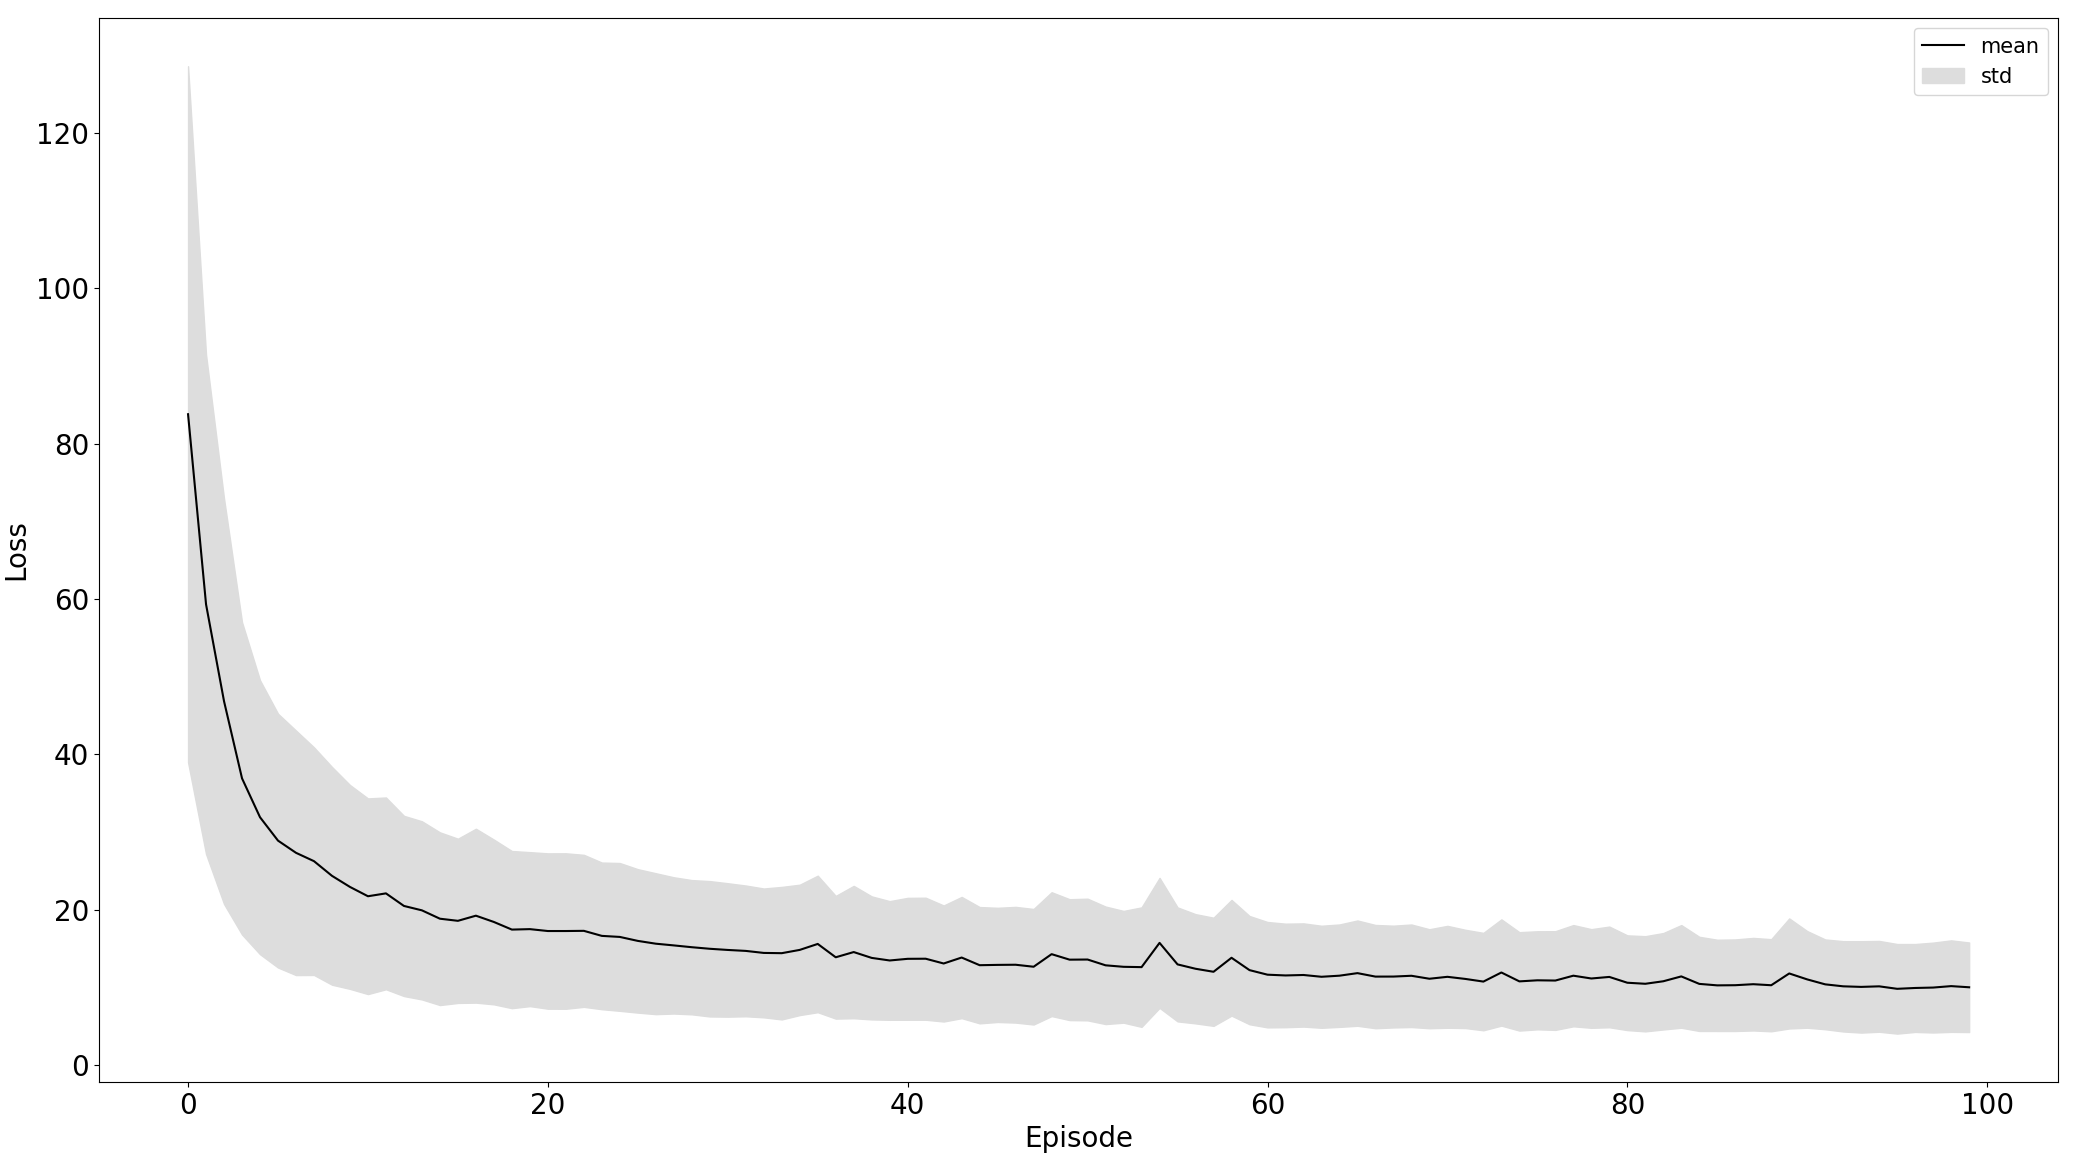 |
Black line is the mean of particular data - losss or accuracy and the grey area is the standard deviation to express stability of training. From the plot, we can see that the model trained on the 5th experiment setup converges more stable and faster than in the third.
Demonstration of the model performance for 5th experiment on several samples from test set:
where:
- green = ground truth
- red = predicted
- orange = ECG signal
- blue = filtered signal by BWR
[1]
Supervised ECG Interval Segmentation Using LSTM Neural Network
[2]
Deep Learning for ECG Segmentation
[3]
ECG Segmentation by Neural Networks: Errors and Correction
[4]
Waveform Segmentation Using Deep Learning
[5]
ECG Signal Denoising and Features Extraction Using Unbiased FIR Smoothing
[6]
A convolutional neural network based approach to QRS detection
[7]
Development of Neural Network-Based Approach for QRS Segmentation
- code is written in Python 3.8,
- every library used in the project is in requirements.txt file,
- the whole report should be reproducible,
- neural network is implemented in PyTorch.
- scripts are configured to dynamically determine whether to use computations on CPU or on GPU, if available,
- build dataset is saved in
.pklformat, - all artefacts for each experiments are in project folder - 'resources'.


