(pronounced deti-nom)
d3tiknom is a Data Visualization project for CS 6630 at the University of Utah. A Go library called monkit can report a variety of statistics about any codebase that it is integrated with. This can be very useful information when trying to analyze a REST backend service. It provides insights into the number of times endpoints are called, or the average time it takes for the endpoint to respond, as well as if the response was an success or an error. By default, monkit will send a packet of statistics every two minutes to a central graphite collector.
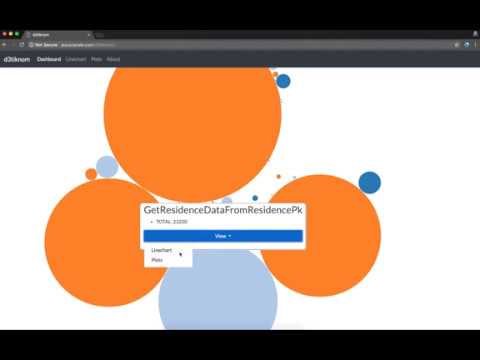
This site will visualize the data collected by the central graphite collector. There are a number of pages that behave as follows:
-
Overview displays all of the endpoints from the data set, using color to represent the success-to-error ratio. There is also a "Bubble" view type which uses size to showcase the number of times each endpoint was called in total.
-
Linechart displays a way to compare any of the endpoints together on the same linechart. This emphasizes the total number of requests, success, or errors over time. It can also display the sliding average runtime of that endpoint over time, if that data exists in the dataset.
-
Plots displays 4 different bar charts side by side for any of the selected endpoints. Each chart can be used to show different metrics from each endpoint all together.
The data downloaded from the graphite source requires no preprocessing. The default json data structure returned by any graphite service would work. The data can be downloaded using:
curl -u {user} -o monkit_data.json "https://graphite.{server}.com/render/?target=path.to.target.*.*.*.*&format=json"/d3tiknom
*.html - All of the html pages
reports/ - PDF reports that have been submitted
data/ - The collected data that is presented
static/ - Static HTML resources
css/ - All CSS stuff goes here
img/ - All images used go here
js/ - All of our own custom JS
vendor/ - Any downloaded third party JS or CSS libs