
ibreakdown is model agnostic predictions explainer with uncertainty and experimental interactions support.
SHAP or LIME consider only local additive feature attributions and do not provide uncertainty, when ibreakdown also evaluates local feature interactions.
- Supports predictions explanations for classification and regression
- Easy to use API.
- Works with
pandasandnumpy - Speed is linear with respect to number of features
- Sum of contribution plus intercept/baseline equals predicted value
- Uncertainty support
- Experimental interactions support with O(n^2) time complexity where n is number of features.
Algorithm is based on ideas describe in paper "iBreakDown: Uncertainty of Model Explanations for Non-additive Predictive Models" https://arxiv.org/abs/1903.11420 and reference implementation in R (iBreakDown)
from ibreakdown import URegressionExplainer

# model = GradientBoostingRegressor(...)
explainer = URegressionExplainer(model.predict)
explainer.fit(X_train, columns)
exp = explainer.explain(observation)
exp.print()
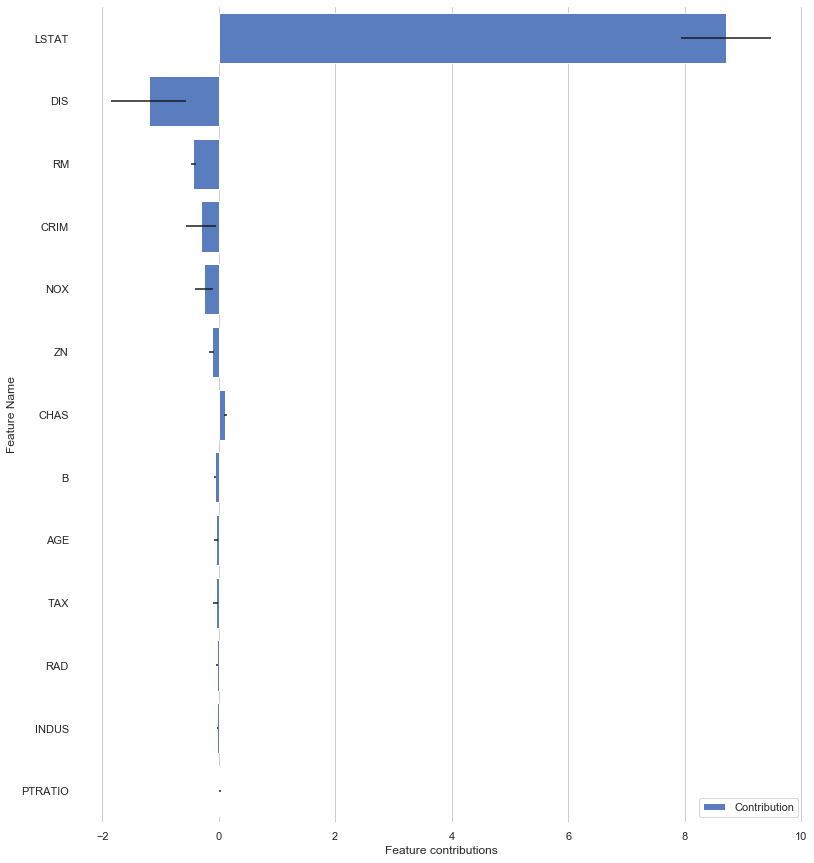
exp.plot()
+----+----------------+-----------------+----------------+--------------------+ | | Feature Name | Feature Value | Contribution | Contribution STD | |----+----------------+-----------------+----------------+--------------------| | 0 | CRIM | 0.06724 | 0.0135305 | 0.131137 | | 1 | ZN | 0 | 0 | 0.00165973 | | 2 | INDUS | 3.24 | 0.0895993 | 0.0407877 | | 3 | CHAS | 0 | -0.0322645 | 0.0073065 | | 4 | NOX | 0.46 | 0.229041 | 0.273706 | | 5 | RM | 6.333 | -1.60699 | 0.130217 | | 6 | AGE | 17.2 | 0.877219 | 0.456707 | | 7 | DIS | 5.2146 | -1.33008 | 0.405814 | | 8 | RAD | 4 | -0.143538 | 0.043008 | | 9 | TAX | 430 | -0.496451 | 0.0521049 | | 10 | PTRATIO | 16.9 | 0.545435 | 0.273792 | | 11 | B | 375.21 | 0.133995 | 0.0943484 | | 12 | LSTAT | 7.34 | 3.61802 | 0.68494 | +----+----------------+-----------------+----------------+--------------------+
from ibreakdown import IClassificationExplainer

# model = RandomForestClassifier(...)
explainer = IClassificationExplainer(model.predict_proba)
classes = ['Deceased', 'Survived']
explainer.fit(X_train, columns, classes)
exp = explainer.explain(observation)
exp.print()
Please check full Titanic example here: https://github.com/jettify/ibreakdown/blob/master/examples/titanic.py
+------------------------------------+-----------------+--------------------+--------------------+
| Feature Name                       | Feature Value   |   Contrib:Deceased |   Contrib:Survived |
+------------------------------------+-----------------+--------------------+--------------------|
| intercept                          |                 |          0.613286  |          0.386714  |
| Sex                                | female          |         -0.305838  |          0.305838  |
| Pclass                             | 3               |          0.242448  |         -0.242448  |
| Fare                               | 7.7375          |         -0.119392  |          0.119392  |
| Siblings/Spouses Aboard            | 0               |         -0.0372811 |          0.0372811 |
| ('Age', 'Parents/Children Aboard') | [28.0 0]        |          0.0122196 |         -0.0122196 |
| PREDICTION                         |                 |          0.405443  |          0.594557  |
+------------------------------------+-----------------+--------------------+--------------------+
Installation process is simple, just:
$ pip install ibreakdown
