Arduino Kafka Dashboard
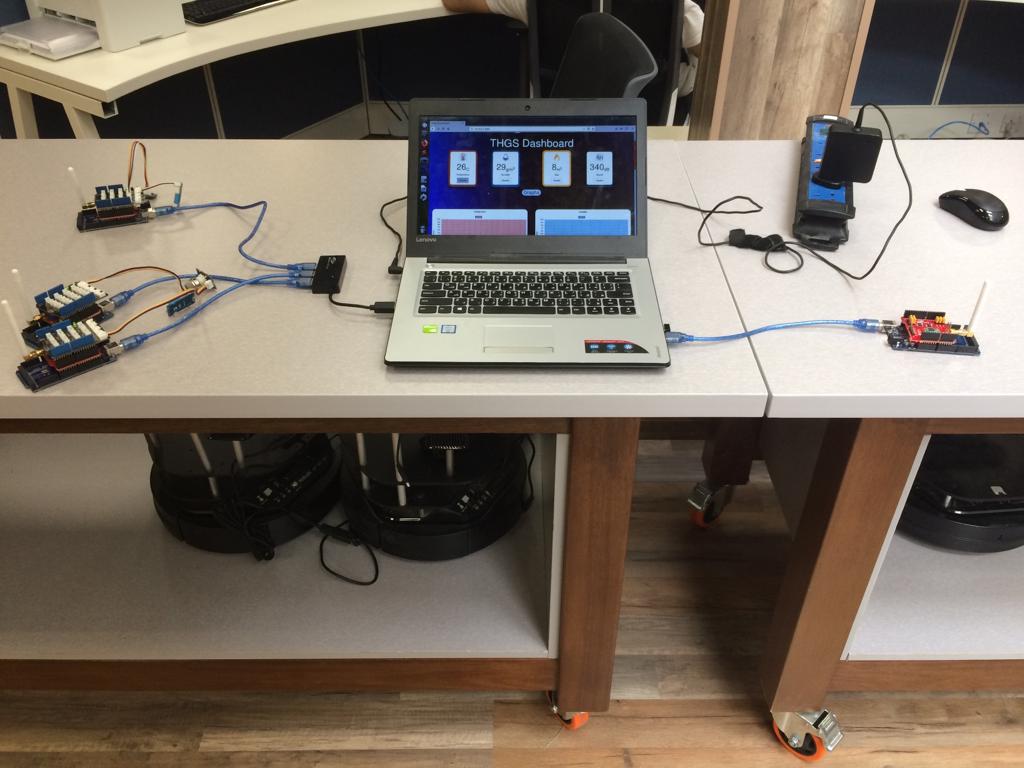
Simple dashboard (follows MVC pattern) for monitoring temperature, humidity, gas, and sound Arduino sensors via using Kafka (stream-processing software platform).
About The Project
Basic Idea
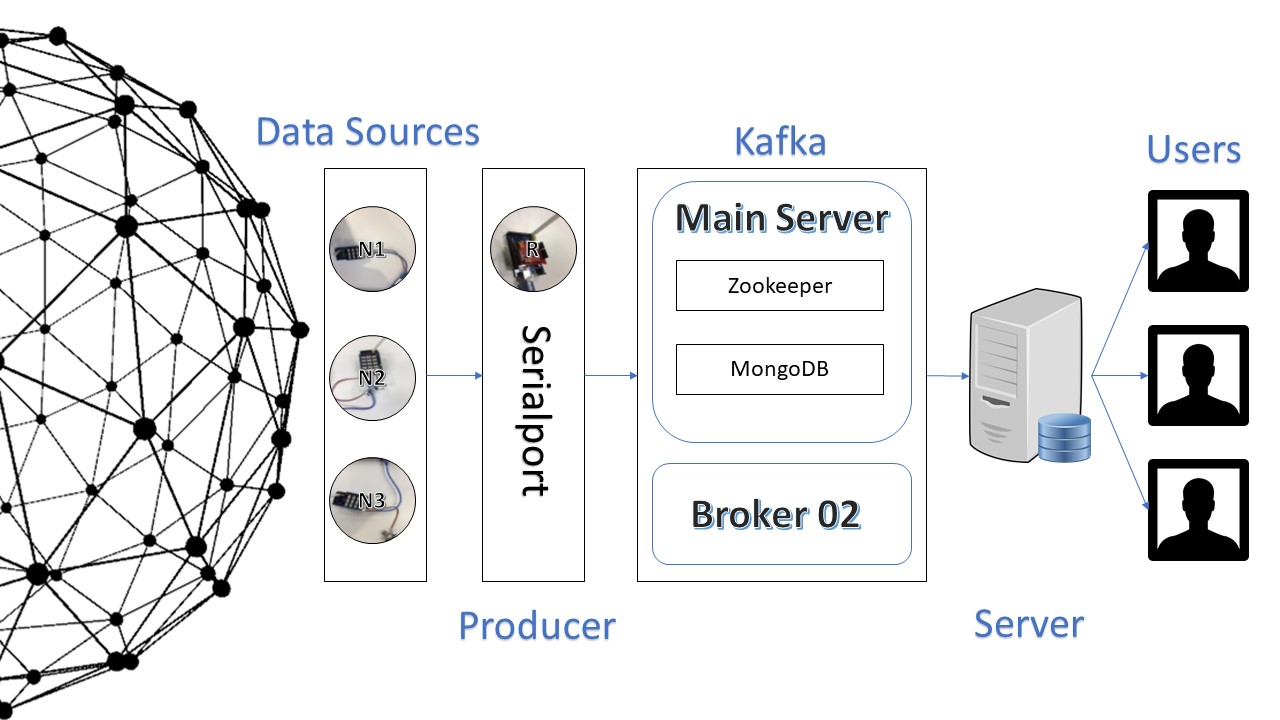
- There are three LoRa nodes, each node send sensor(s) data every 5 seconds.
- LoRa receiver receive data from nodes, and send via serial to gateway.
- There will be two devices one have Kafta and Zookeeper and other one have Kafka connected to Zookeeper of first one.
- Gateway produces to four topics (temperature, humidity, gas, and sound).
- Gateway will send to client app (which follow MVC pattern) and show it on the page.
- Also, it will be saved to MongoDB.
- Nodes places are shown in Google Map.
Technologies Used
- Arduino: for hardware components.
- LoRa: for networking.
- Kafka: for stream-processing.
- HTML, CSS, JS, and NodeJS: for web development.
- MongoDB: for storing data.
Hardware Components
| Sender: Gas + LoRa Shield | Sender: Humidity + Temperature + LoRa Shield | Sender: Temperature + Sound + LoRa Shield | Receiver: LoRa Shield |
|---|---|---|---|
 |
 |
 |
 |
Architecture
Usage
- To run the software, first, run the Zookeeper and Kafka.
- Run the producer file:
$ node server /kafka/producer.js. - Run the server which is considered as a consumer in the same
time:
$ node server /server.js. - Now open the browser and write this URL:
127.0.0.1:3006. - Run mongodb server:
$ mongod --dbpath ~ /mongo-data/. - Now run:
$ node server /kafka/cloud-mongodb.jsto run the program responsible to storing the data on mongodb.
Other Authors
- Bassel Saeed
- Abdulrhman AlSharqawi

