The JFrog Log Analytics and Metrics solution using Prometheus consists of three segments,
- Prometheus - the component where metrics data gets ingested
- Loki - the component where log data gets ingested
- Grafana - the component where data visualization is achieved via prebuilt dashboards
-
Working and configured Kubernetes Cluster - Amazon EKS / Google GKE / Azure AKS / Docker Desktop / Minikube
- Recommended Kubernetes Version 1.25.2 and above
- For Google GKE, refer GKE Guide
- For Amazon EKS, refer EKS Guide
- For Azure AKS, refer AKS Guide
- For Docker Desktop and Kubernetes, refer DOCKER Guide
-
'kubectl' utility on the workstation which is capable of connecting to the Kubernetes cluster
- For Installation and usage refer KUBECTL Guide
-
HELM v3 Installed
- For Installation and usage refer HELM Guide
-
Versions supported and Tested:
Artifactory: 7.90.8
Xray: 3.103.6
Prometheus: 2.51.0
Grafana: 10.4.0
Loki: 2.9.6
Important Note: This version replaces all previous implementations. This version is not an in-place upgrade to the existing solution from JFrog but is a full reinstall. Any dashboard customizations done on previous versions will need to be redone after this install.
This guide assumes the implementer is performing new setup, Changes to handle install in an existing setup will be highlighted where applicable.
    if prometheus is already installed and configured, we recommend to have the existing prometheus release name handy.
    If Loki is already installed and configured, we recommend to have its service URL handy.
If Prometheus and Loki are already available you can skip the installation section and proceed to Configuration Section.
Warning
The old docker registry partnership-pts-observability.jfrog.io, which contains older versions of this integration is now deprecated. We'll keep the existing docker images on this old registry until August 1st, 2024. After that date, this registry will no longer be available. Please helm upgrade your JFrog kubernetes deployment in order to pull images as specified on the above helm value files, from the new releases-pts-observability-fluentd.jfrog.io registry. Please do so in order to avoid ImagePullBackOff errors in your deployment once this registry is gone.
The Prometheus Community kube-prometheus-stack helm chart allows the creation of Prometheus instances and includes Grafana. The Grafana Community grafana helm chart allows the creation of Loki instances and includes Grafana which can link to prometheus.
Once the Pre-Requisites are met, to install Prometheus Kubernetes stack:
export INST_NAMESPACE=jfrog-plgWe will use jfrog-plg as the namespace throughout this document. That said, you can use a different or existing namespace instead by setting the above variable.
kubectl create namespace $INST_NAMESPACE
kubectl config set-context --current --namespace=$INST_NAMESPACE Note: This installation comes with a Grafana installation
Add the required Helm Repositories:
helm repo add prometheus-community https://prometheus-community.github.io/helm-charts
helm repo update
Install the chart:
helm upgrade --install "prometheus" prometheus-community/kube-prometheus-stack -n $INST_NAMESPACE* "prometheus" here is the value that needs to be used against the value for "release_name" in the configuration sectionFor Docker Desktop, run this additional command to correct the mount path propagation for prometheus node-exporter component, An error event will be appearing as follows "Error: failed to start container "node-exporter": Error response from daemon: path / is mounted on / but it is not a shared or slave mount"
kubectl patch ds prometheus-prometheus-node-exporter --type "json" -p '[{"op": "remove", "path" : "/spec/template/spec/containers/0/volumeMounts/2/mountPropagation"}]' -n $INST_NAMESPACEAdd the required Helm Repositories:
helm repo add grafana https://grafana.github.io/helm-charts
helm repo update
Install the chart:
helm upgrade --install "loki" --values helm/loki-values.yaml grafana/loki --version 5.48.0 -n $INST_NAMESPACE💡 The above helm command is hard-coding the loki chart version to 5.48.0, since we only tested it with loki 2.9.6. loki 3.x charts (v6.0.x and up) have a breaking change, so if you would like to install loki 3.x please visit the loki's official docs and provide your own loki-values.yaml
* "loki" will be the service name, the url to access loki as a datasource can be visualised as http://<service_name>.<namespace>:<port>
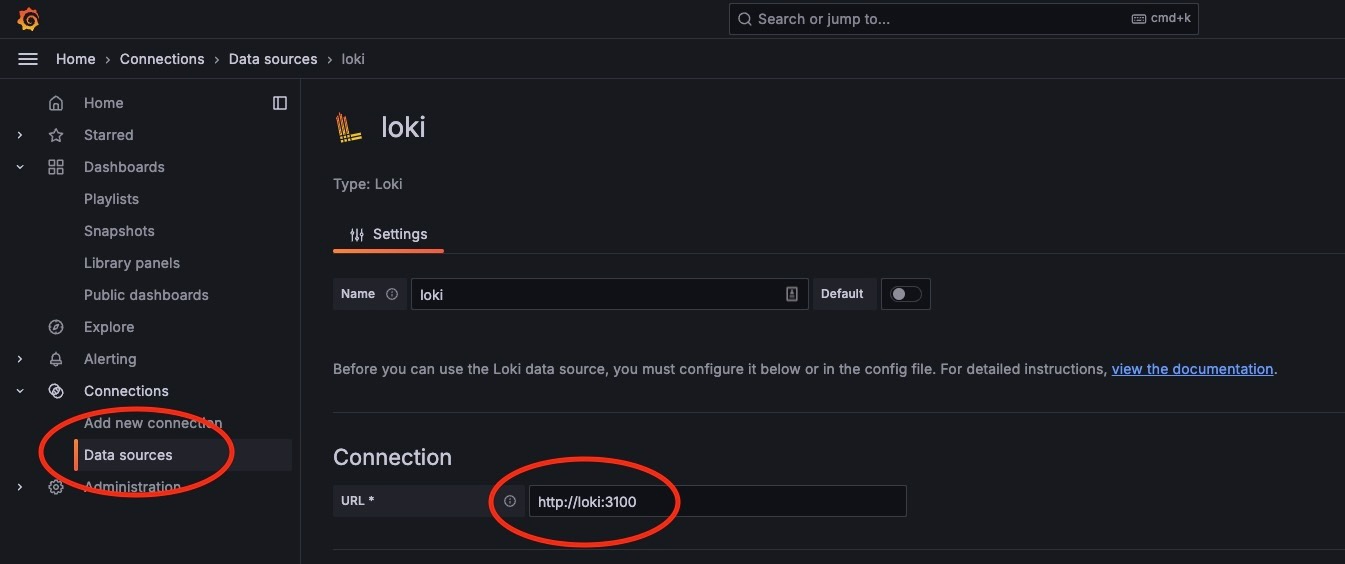
      ex: http://loki.$INST_NAMESPACE:3100 will be the "loki_url" value

* version 2.9.6 is the most recent loki version at the time of writing the document
      if there is a need to deploy this exact version, change the version value in "--set loki.image.tag=my_desired_version" to your desired version.
Before starting Artifactory or Artifactory HA installtion generate join and master keys for the installation:
export JOIN_KEY=$(openssl rand -hex 32)
export MASTER_KEY=$(openssl rand -hex 32)
Then helm install the Artifactory or Artifactory HA charts:
Artifactory ⎈:
- helm install
artifactorychart (using the above generated join and master keys).
helm upgrade --install artifactory jfrog/artifactory \
       --set artifactory.masterKey=$MASTER_KEY \
       --set artifactory.joinKey=$JOIN_KEY \
       -n $INST_NAMESPACE
If you are installing in the same cluster with the deprecated solution, use the same namespace as the previous one instead of jfrog-plg above.
💡 Metrics collection is disabled by default in Artifactory. Please make sure that you are enabling them in Artifactory by setting artifactory.metrics.enabled to true in your helm values file. For Artifactory versions <=7.86.x, please instead set the flag artifactory.openMetrics.enabled to `true
- Follow the instructions how to get your new Artifactory URL from the helm install output
export SERVICE_IP=$(kubectl get svc --namespace $INST_NAMESPACE artifactory-artifactory-nginx -o jsonpath='{.status.loadBalancer.ingress[0].ip}')
echo http://$SERVICE_IP/- Using the Artifactory UI generate JFrog's admin Access Token. Using that fetched token, create a kubernetes generic secret for JFrog's admin token - using any of the following methods
kubectl create secret generic jfrog-admin-token --from-file=token=<path_to_token_file>OR
kubectl create secret generic jfrog-admin-token --from-literal=token=<JFROG_ADMN_TOKEN>
-
Postgres password is required to upgrade Artifactory. Run the following command to get the current Postgres password
POSTGRES_PASSWORD=$(kubectl get secret artifactory-postgresql -o jsonpath="{.data.postgresql-password}" | base64 --decode) -
Upgrade Artifactory and apply Helm chart to create additional kubernetes resources, which are required for Prometheus service discovery process:
helm upgrade --install artifactory jfrog/artifactory \
    --set artifactory.joinKey=$JOIN_KEY \
    --set databaseUpgradeReady=true --set postgresql.postgresqlPassword=$POSTGRES_PASSWORD \
    -f helm/artifactory-values.yaml \
    -n $INST_NAMESPACE
💡Note: You need to be at the root of this repository folder to have helm/artifactory-values.yaml file available for the following command
This will complete the necessary configuration for Artifactory and expose new service monitors servicemonitor-artifactory and servicemonitor-observability to expose metrics to Prometheus
Artifactory-HA ⎈:
- helm install
artifactory-hachart (using the above generated join and master keys).
helm upgrade --install artifactory jfrog/artifactory-ha \
       --set artifactory.masterKey=$MASTER_KEY \
       --set artifactory.joinKey=$JOIN_KEY \
       -n $INST_NAMESPACE
If you are installing in the same cluster with the deprecated solution, use the same namespace as the previous one instead of jfrog-plg above.
💡 Metrics collection is disabled by default in Artifactory-HA. Please make sure that you are enabling them in Artifactory-HA by setting artifactory.metrics.enabled to true in your helm values file. For Artifactory versions <=7.86.x, please instead set the flag artifactory.openMetrics.enabled to `true
- Follow the instructions how to get your new Artifactory URL from the helm install output
export SERVICE_IP=$(kubectl get svc --namespace $INST_NAMESPACE artifactory-artifactory-nginx -o jsonpath='{.status.loadBalancer.ingress[0].ip}')
echo http://$SERVICE_IP/- Using the Artifactory UI generate JFrog's admin Access Token. Using that fetched token, create a kubernetes generic secret for JFrog's admin token - using any of the following methods
kubectl create secret generic jfrog-admin-token --from-file=token=<path_to_token_file>OR
kubectl create secret generic jfrog-admin-token --from-literal=token=<JFROG_ADMN_TOKEN>
-
Postgres password is required to upgrade Artifactory. Run the following command to get the current Postgres password
POSTGRES_PASSWORD=$(kubectl get secret artifactory-postgresql -o jsonpath="{.data.postgresql-password}" | base64 --decode) -
Upgrade Artifactory and helm upgrade the
artifactory-hachart to create additional kubernetes resources, which are required for Prometheus service discovery process:You need to be at the root of this repository folder to have
helm/artifactory-ha-values.yamlfile available for the following command:helm upgrade --install artifactory jfrog/artifactory-ha \ --set artifactory.joinKey=$JOIN_KEY \ --set databaseUpgradeReady=true --set postgresql.postgresqlPassword=$POSTGRES_PASSWORD \ -f helm/artifactory-ha-values.yaml \ -n $INST_NAMESPACE
💡Note: The above examples are only references you will need additional parameters to configure TLS, binary blob storage, or other common Artifactory features.
This will complete the necessary configuration for Artifactory-HA and expose new service monitors servicemonitor-artifactory-ha and servicemonitor-observability to expose metrics to Prometheus
To configure and install Xray with Prometheus metrics being exposed use our file helm/xray-values.yaml to expose a metrics and new service monitor to Prometheus.
Xray ⎈:
Generate master keys for the Xray installation:
export XRAY_MASTER_KEY=$(openssl rand -hex 32)Use the same JOIN_KEY from the Artifactory installation, in order to connect Xray to Artifactory. You'll also be using the jfrog-admin-token kubernetes secret, that was created early as part of Artifactory/Artifactory-HA installation
💡Note: You need to be at the root of this repository folder to have helm/xray-values.yaml file available for the following command
# getting Artifactory URL
export JFROG_JPD=$(kubectl get svc -n $INST_NAMESPACE artifactory-artifactory-nginx -o jsonpath='{.status.loadBalancer.ingress[0].ip}')

# helm install xray
helm upgrade --install xray jfrog/xray --set xray.jfrogUrl=http://$JFROG_JPD \
       --set xray.masterKey=$XRAY_MASTER_KEY \
       --set xray.joinKey=$JOIN_KEY \
       -f helm/xray-values.yaml \
       -n $INST_NAMESPACE
If you are installing in the same cluster with the deprecated solution, Use the same namespace as the previous one instead of jfrog-plg above.
Use 'kubectl port forward' as mentioned below in a separate terminal window
kubectl port-forward service/prometheus-operated 9090:9090 -n $INST_NAMESPACEGo to the web UI of the Prometheus instance "http://localhost:9090" and verify "Status -> Service Discovery", the list shows the new ServiceMonitor for Artifactory or Xray or both, as shown here: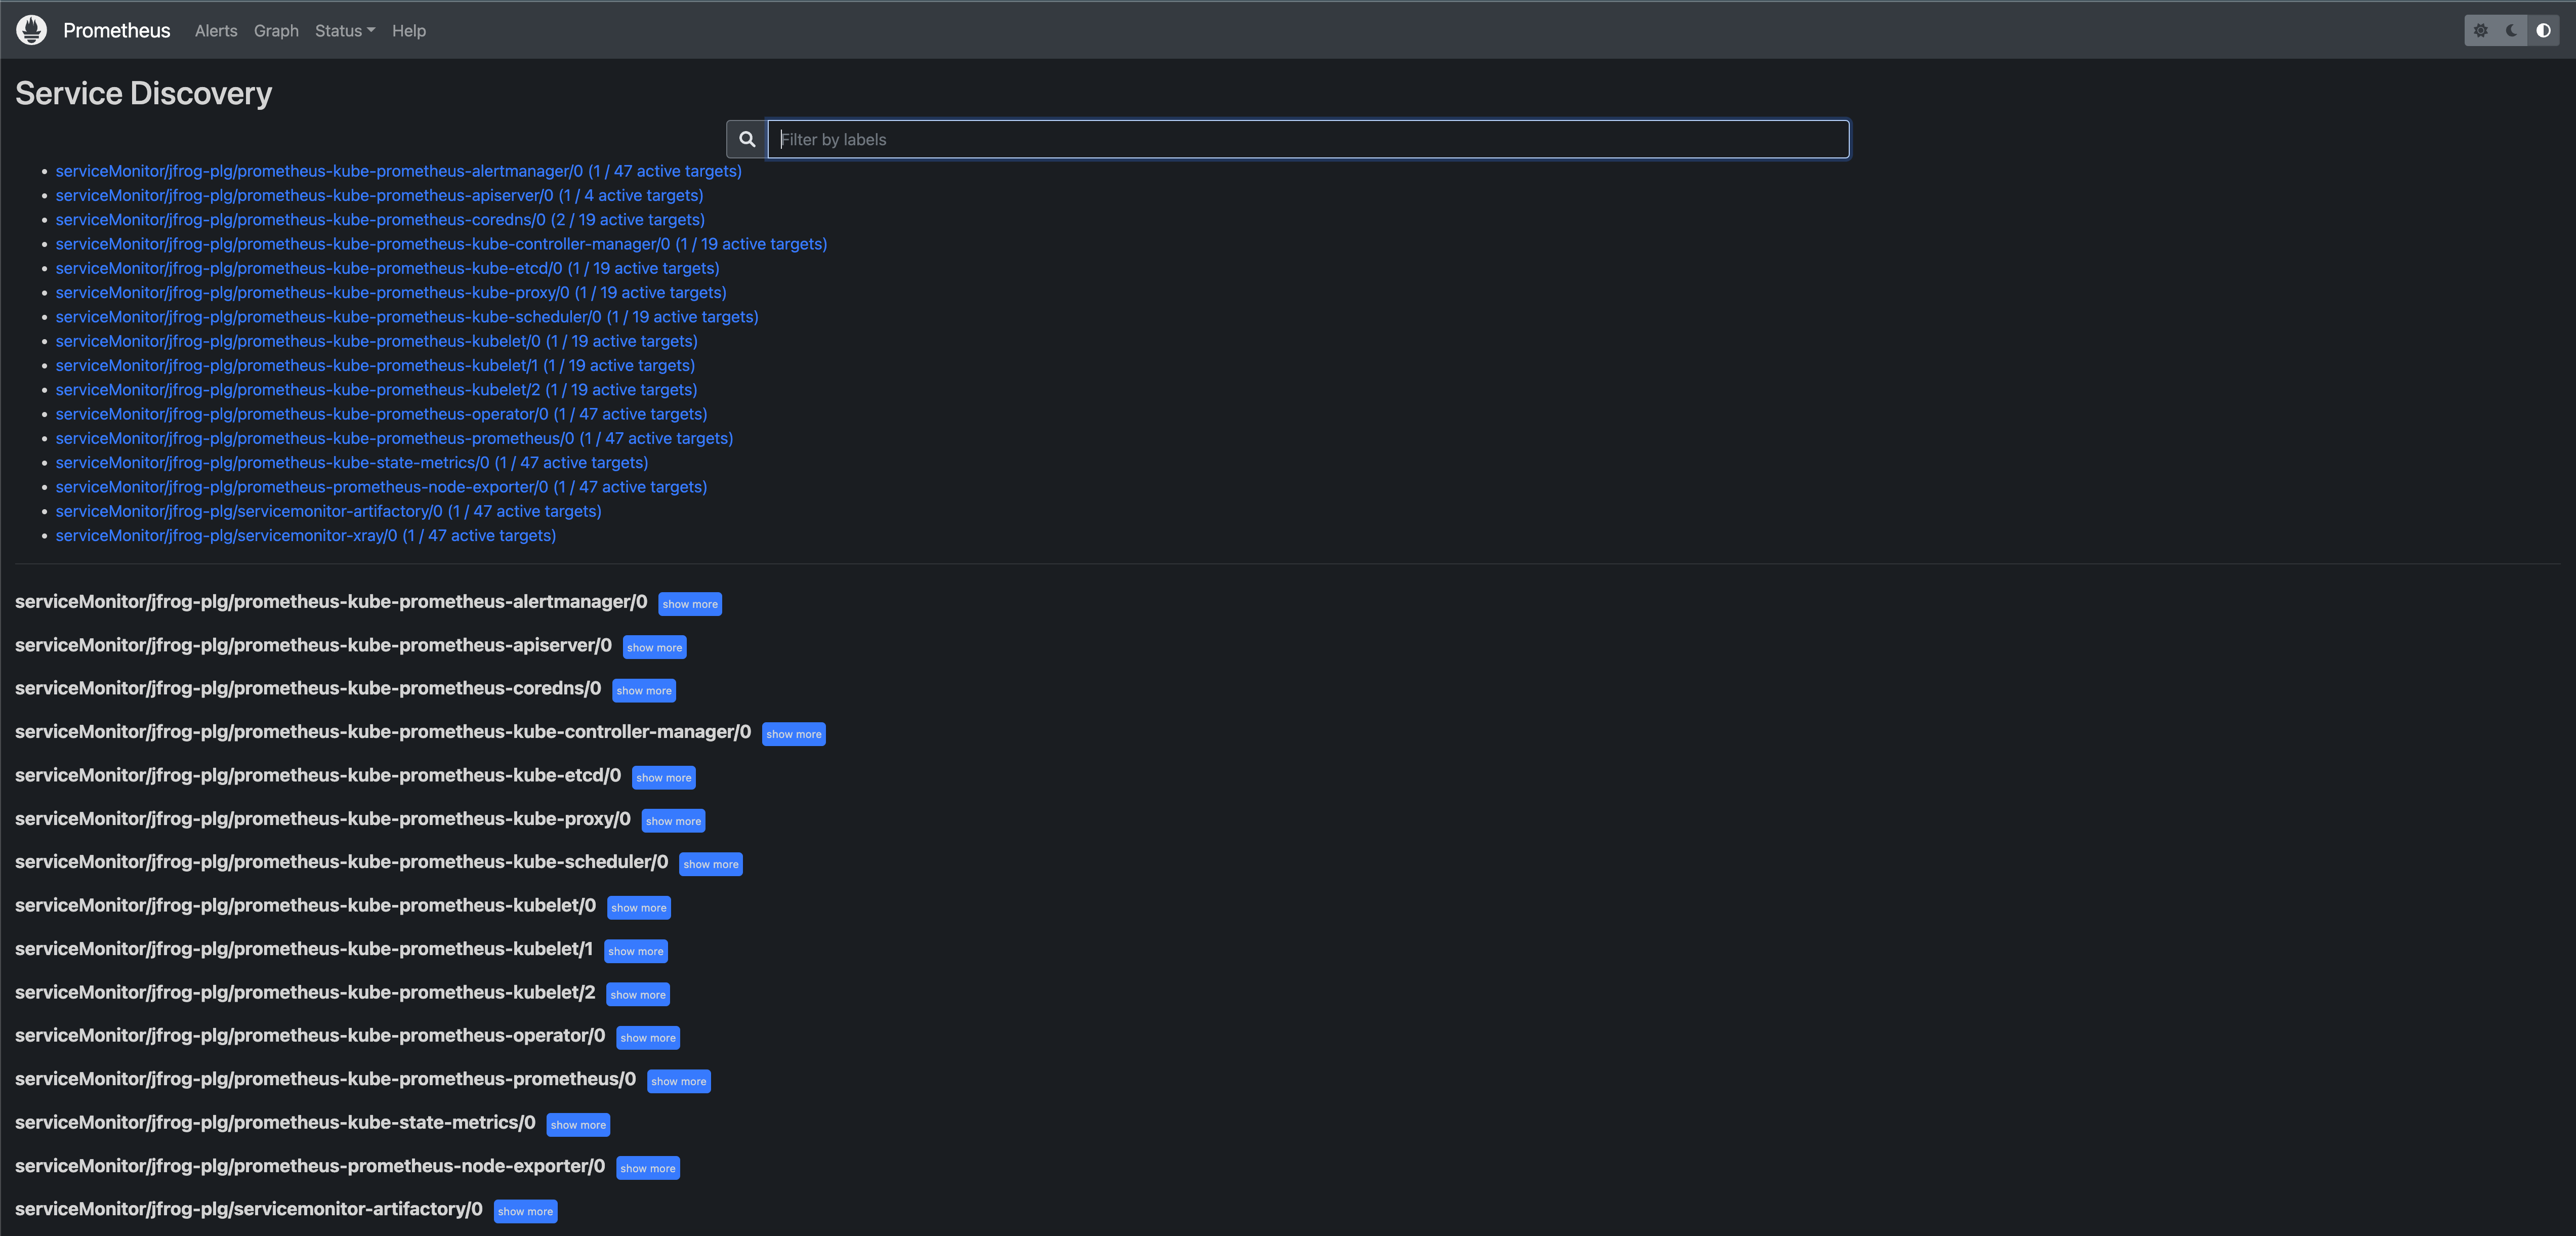
Deafult user/password for Prometheus is -> UNAME/PASSWD
use 'kubectl port forward' as mentioned below in a separate terminal window
kubectl port-forward service/prometheus-grafana 3000:80 -n $INST_NAMESPACE
-
Open your Grafana on a browser at "http://localhost:3000" (grafana default credentials are "admin" / "prom-operator").
-
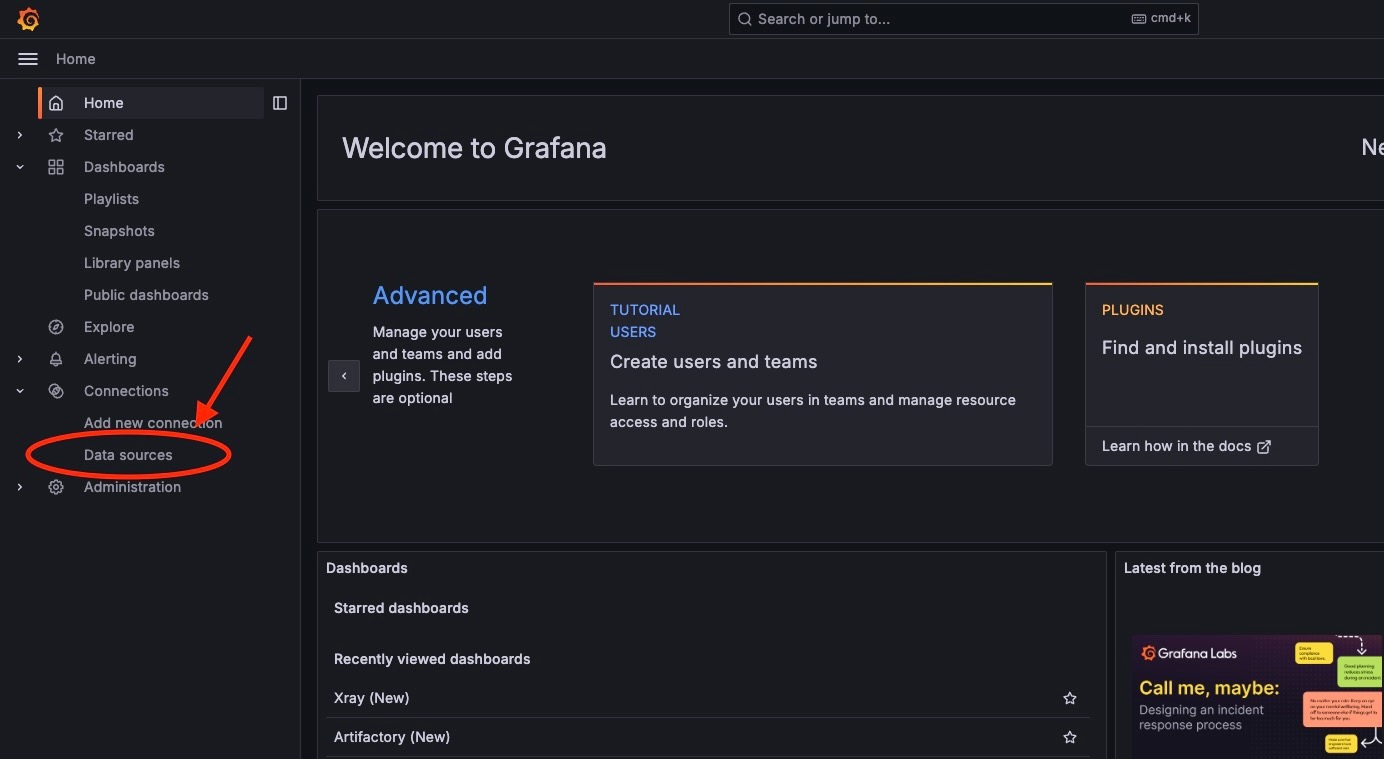
Go to "Configuratoin" -> "Data Sources" on the left menu:
-
Add your Prometheus instance and Loki Instance as datasources:
-
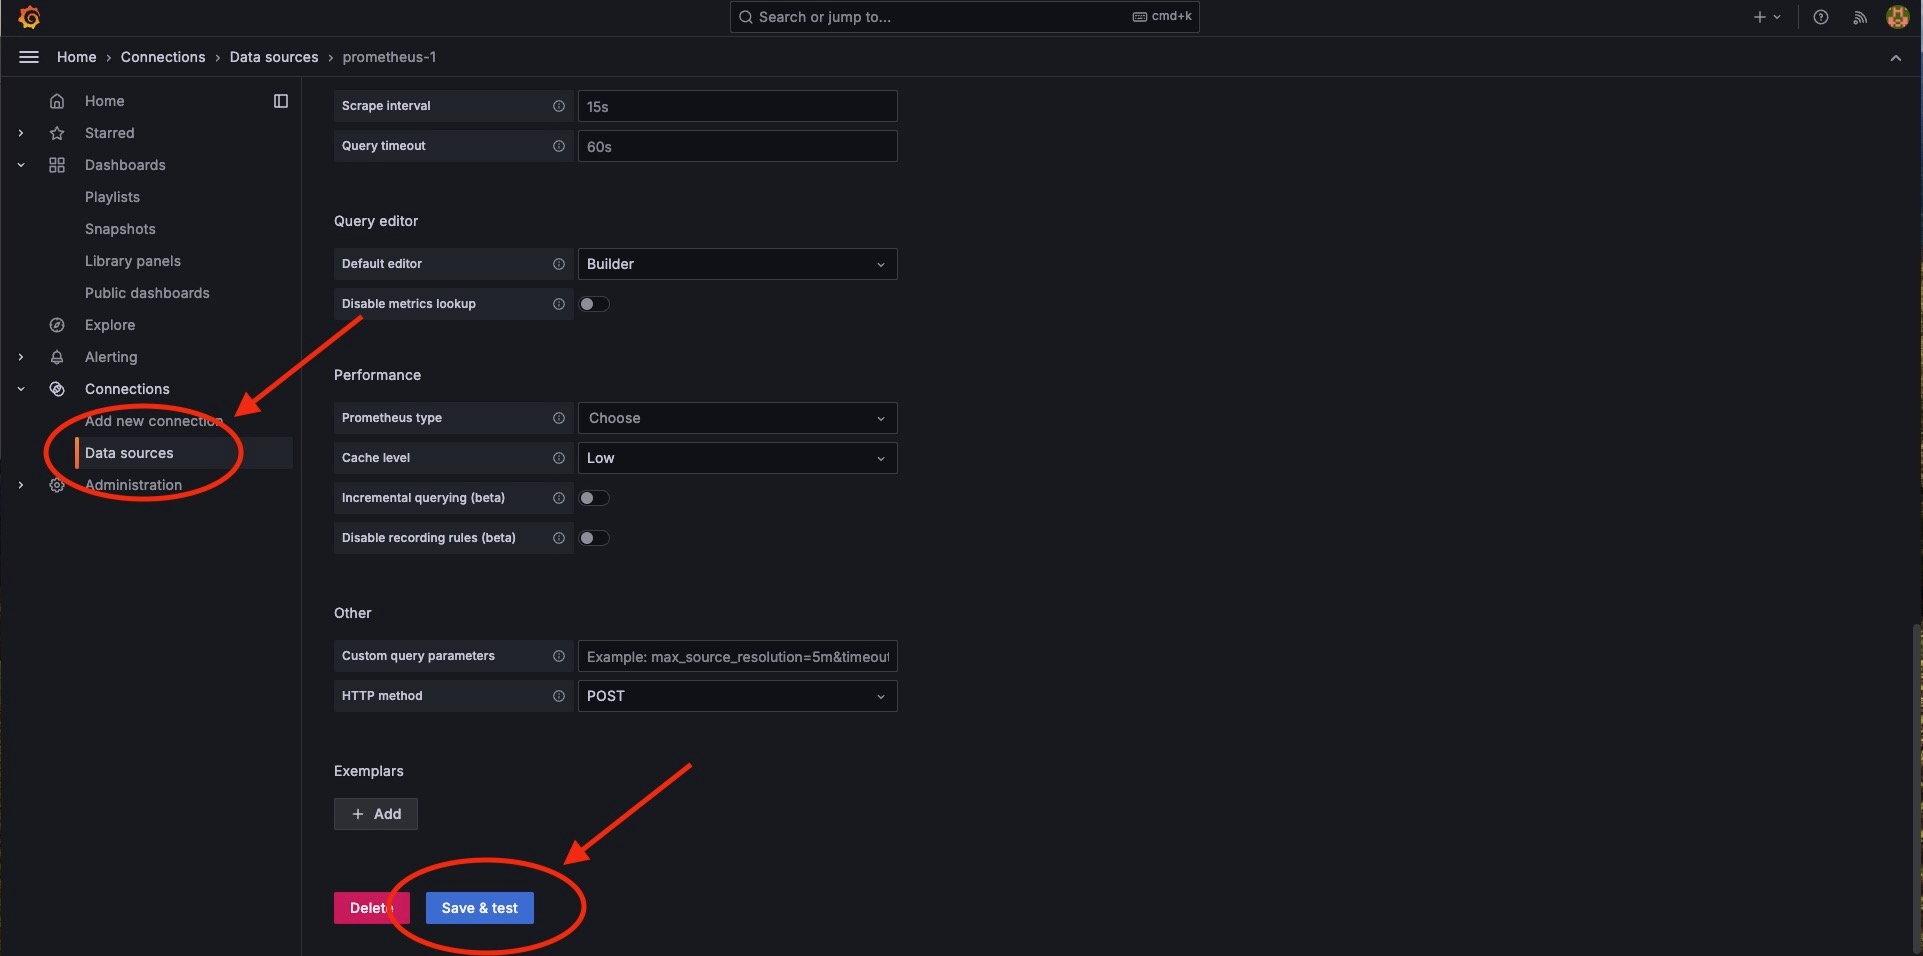
While specifying datasource url for
LokiandPrometheus, please test and confirm that the connection is successful using theSave & Testbutton at the bottom of the adding data source page:After adding both
LokiandPrometheusData Sources your "Configuration" -> "Data Sources" page should look like the following: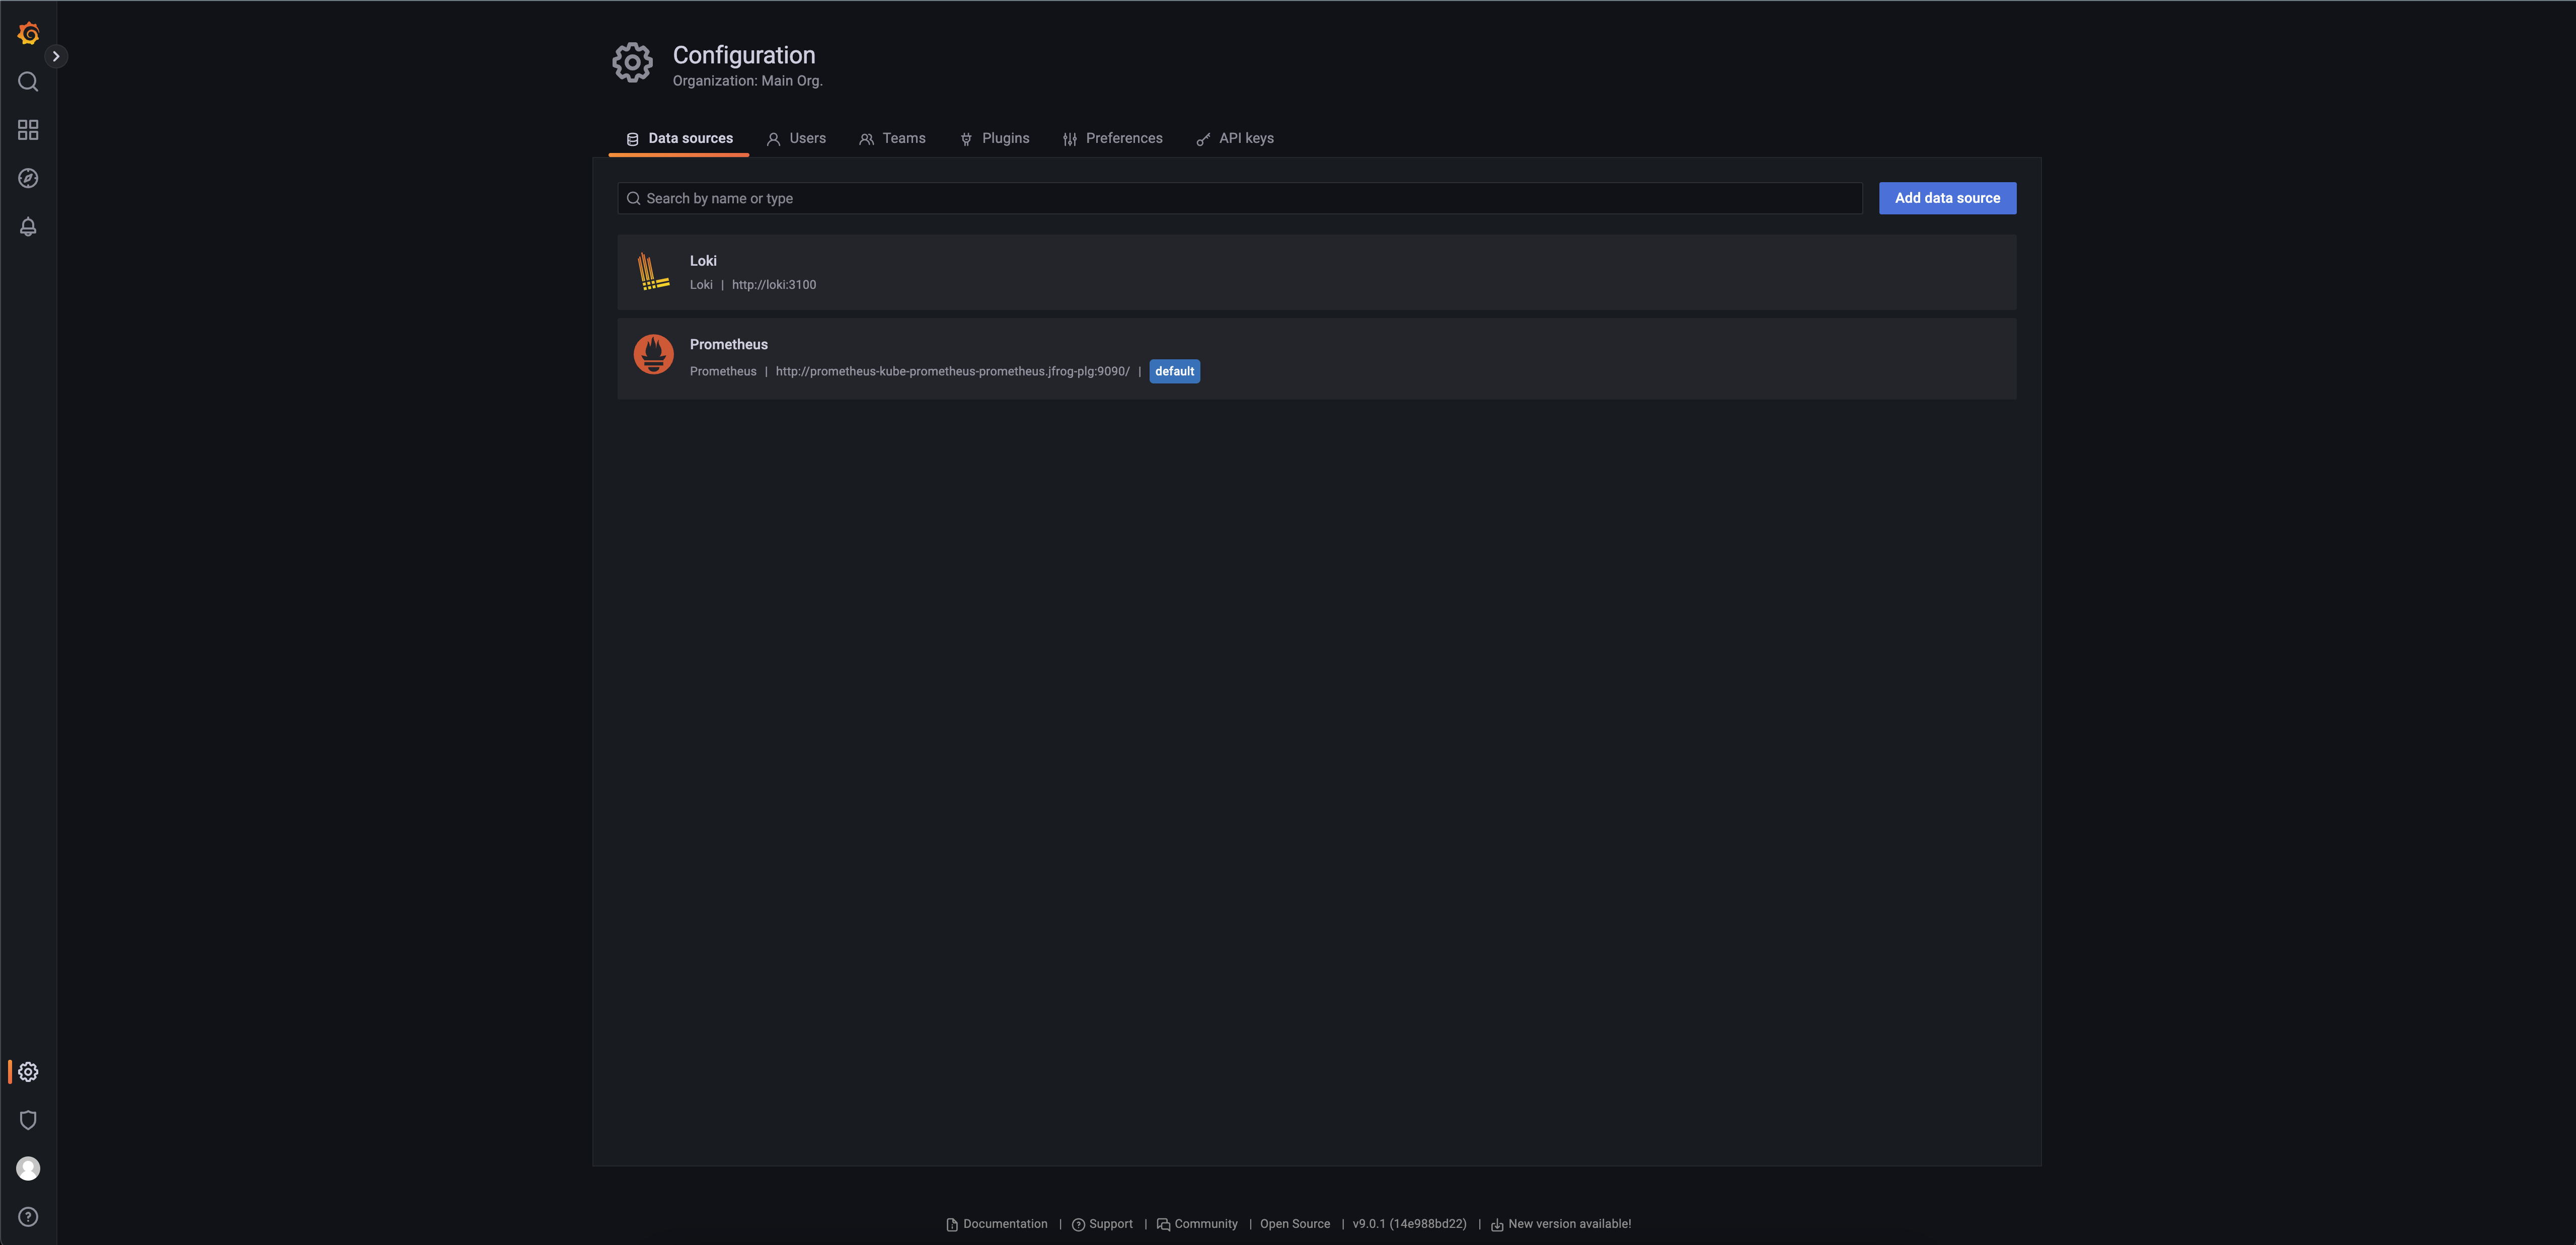
Example dashboards are included in the grafana directory. These dashboards needs to be imported to the grafana. These include:
- Artifactory Metrics and Log Analytics Dashboard Download Here
- Xray Metrics and Log Analytics Dashboard Download Here
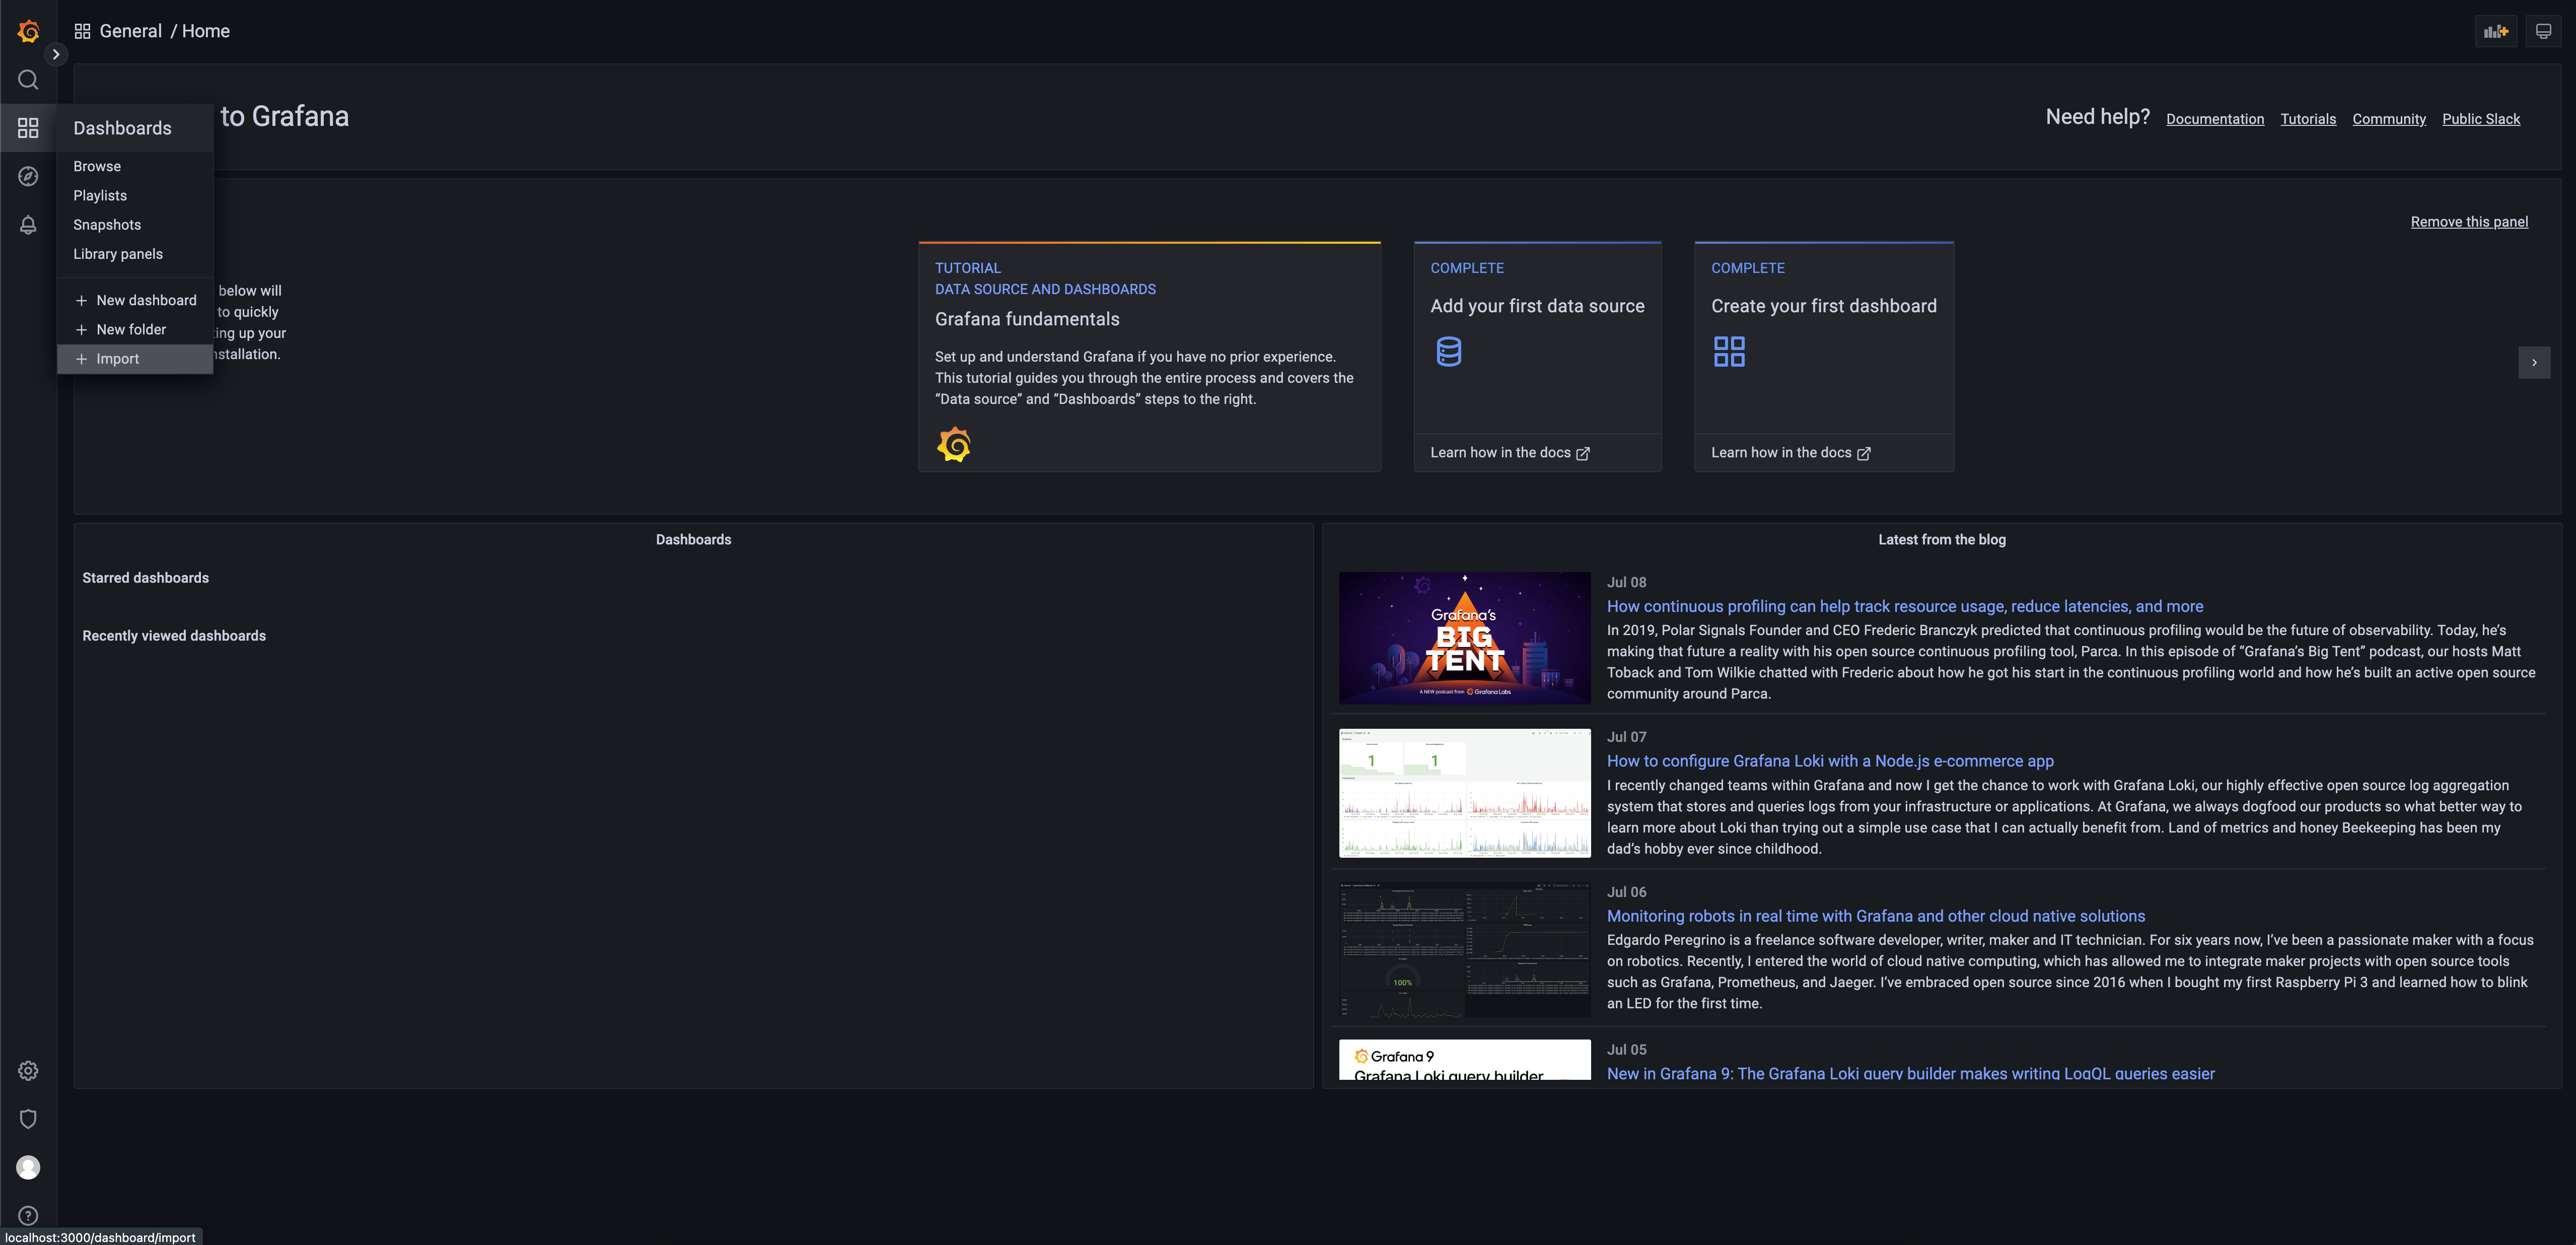
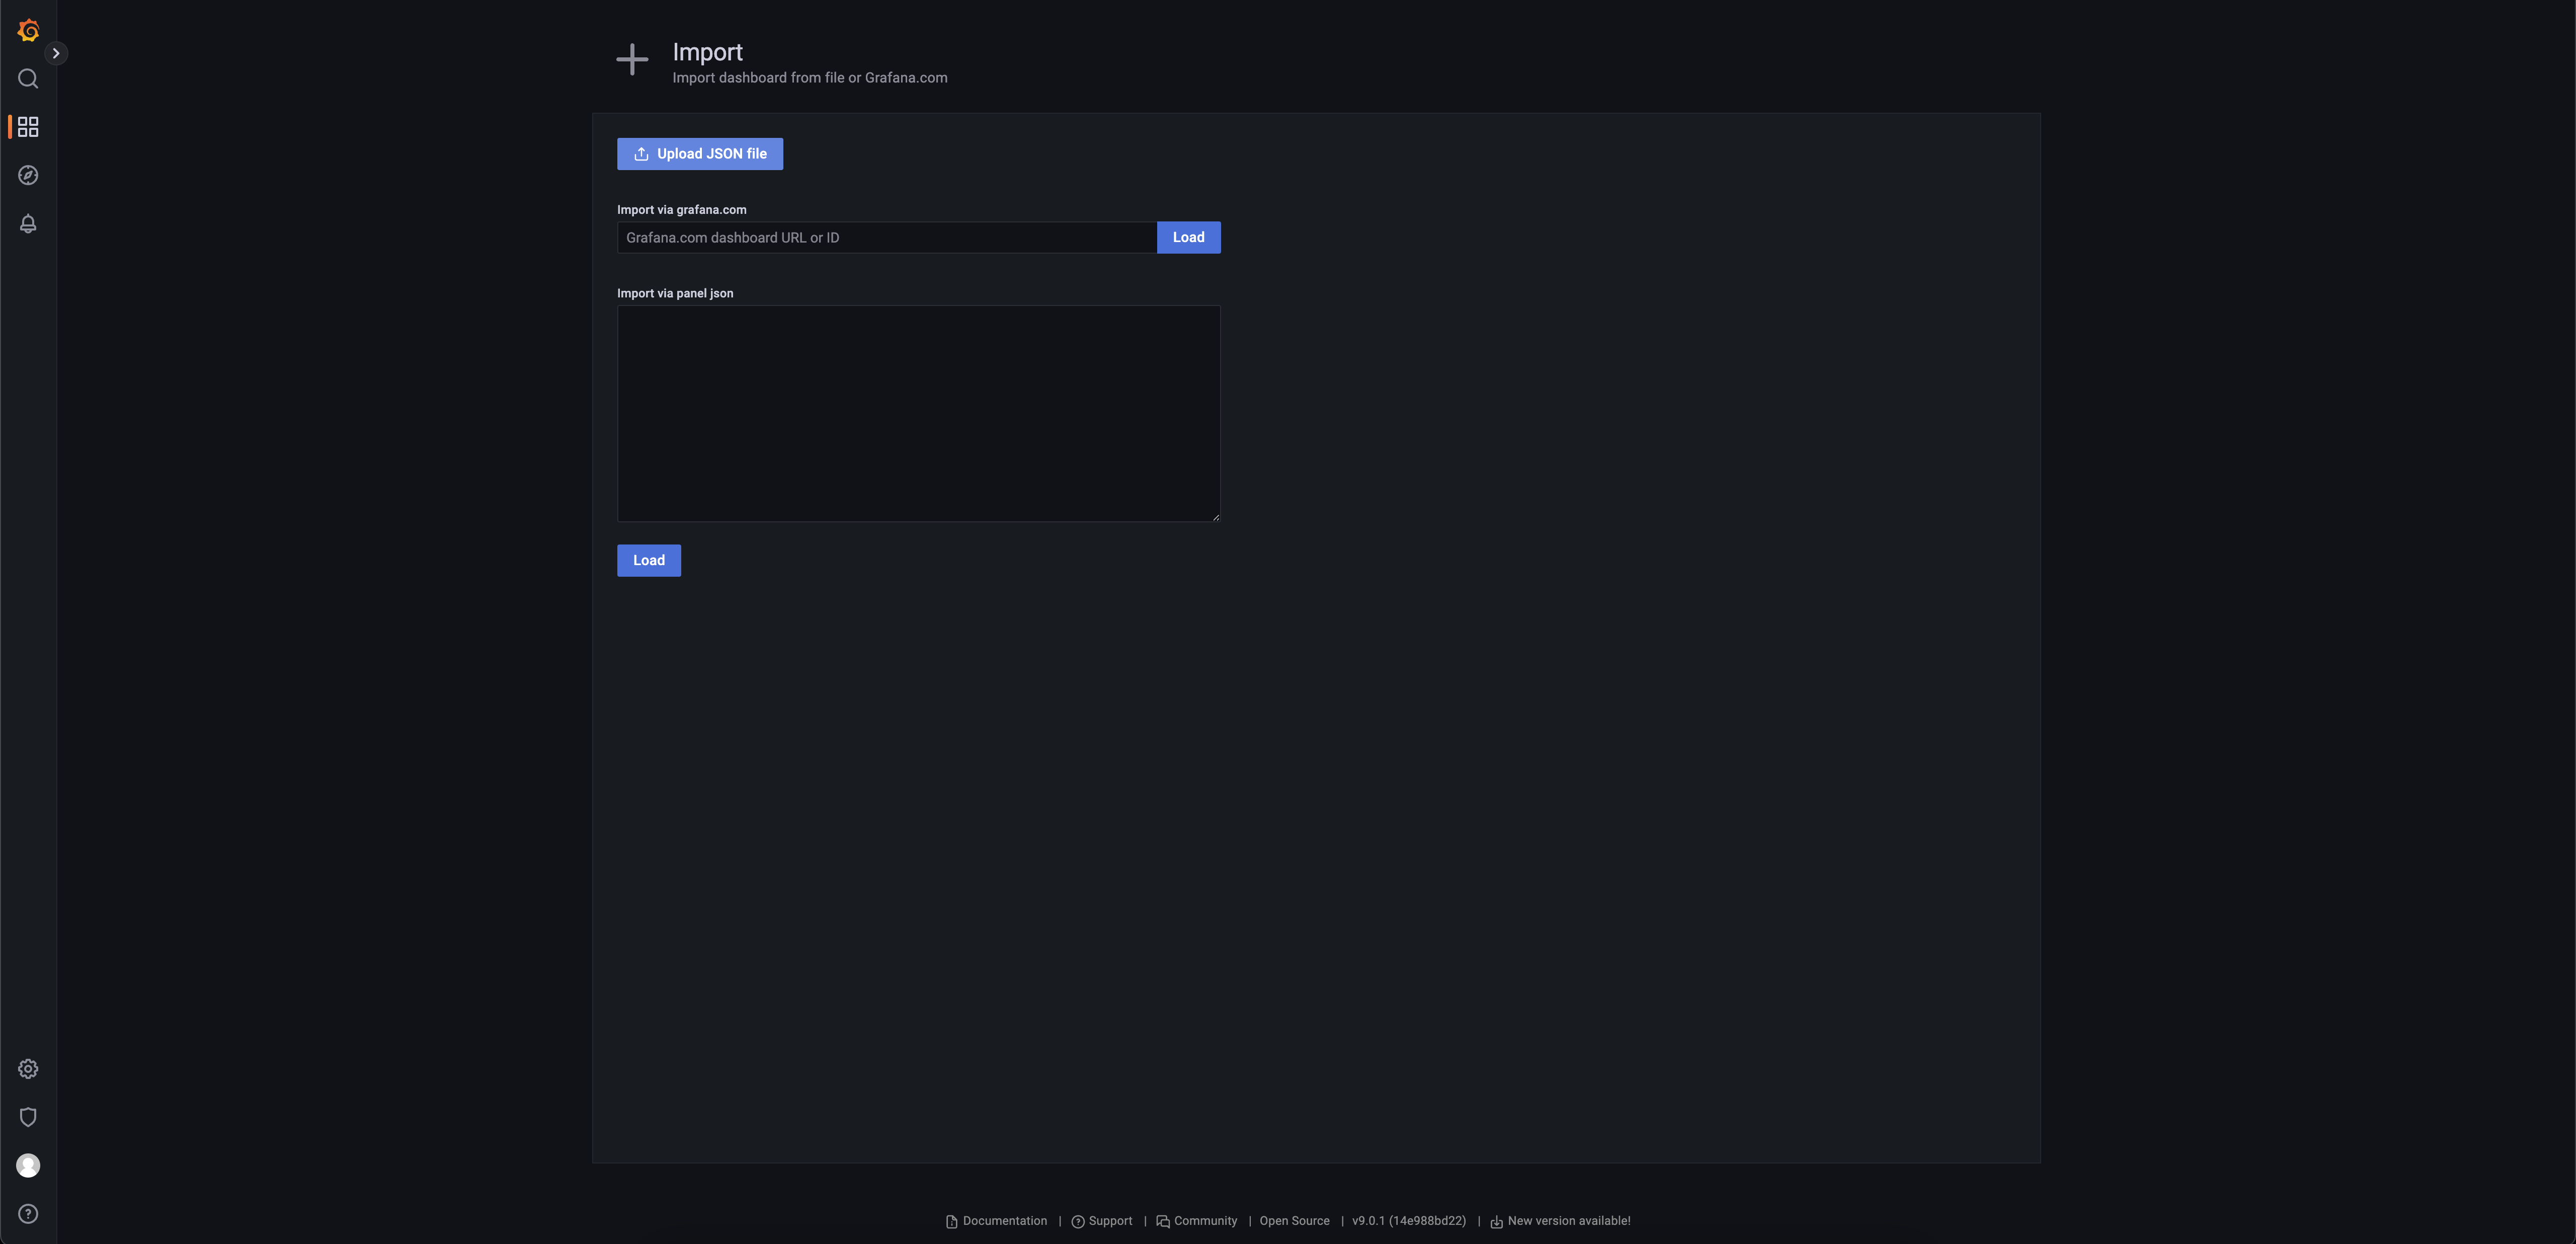
After downlowding the dashboards go to "Dashboards" -> "Import":
Pick Uplaod JSON file and upload Artifactory and Xray dashboards files that you downloaded in the previous step.
Import the Dashboards and select the appropriate sources (Loki and Prometheus)
