PoC for a logging system, it is made in order to analyze its possibilities and decide which is the best option.
First of all, we need to launch a couple of rabbitMQ clusters. So, we can check if we can connect the logging system to those components.
For this, we may use both docker-compose files stored in /rabbitMQ, which is inspired on this GitHub repository.
cd rabbitMQ/cluster-1
docker-compose -f docker-compose.cluster1.yml up -d
cd ../cluster-2
docker-compose -f docker-compose.cluster2.yml up -d
We can access to the admin console (localhost:15672 and localhost:15674) and check if everything is ok. Access credentials: guest/guest.
First of all, we deploy our Elasticsearch container:
docker run -d -it -p 9200:9200 -p 9300:9300 elasticsearch
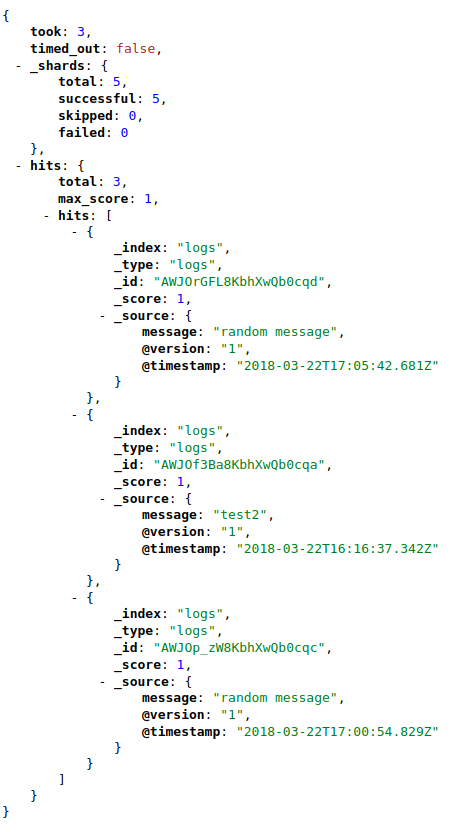
It is recommended to check if it is accessible at http://localhost:9200. After the Logstash is running, we can check the messages stored at http://localhost:9200/logs/_search.
docker run -d -it -p 27017:27017 mongo:3.4
After the Logstash is running, we can check the messages stored at the test_logs collection, within the logs database.
Inside the /logstash file, we can find a Dockerfile with a configuration file. This configuration file takes both RabbitMQ clusters as input (by subscribing to the 'test' queue). More configuration details may be find in the Logstash documentation page.
Inside the pipeline, one action is set on the filtering step: it takes only the data within the message payload. As ouput, data is printed at the console, by using the stdout plugin. Also, our running Elasticsearch is set as an output (more info about the plugin here).
cd logstash
docker build --tag mylogstash .
docker run --network="host" mylogstash

