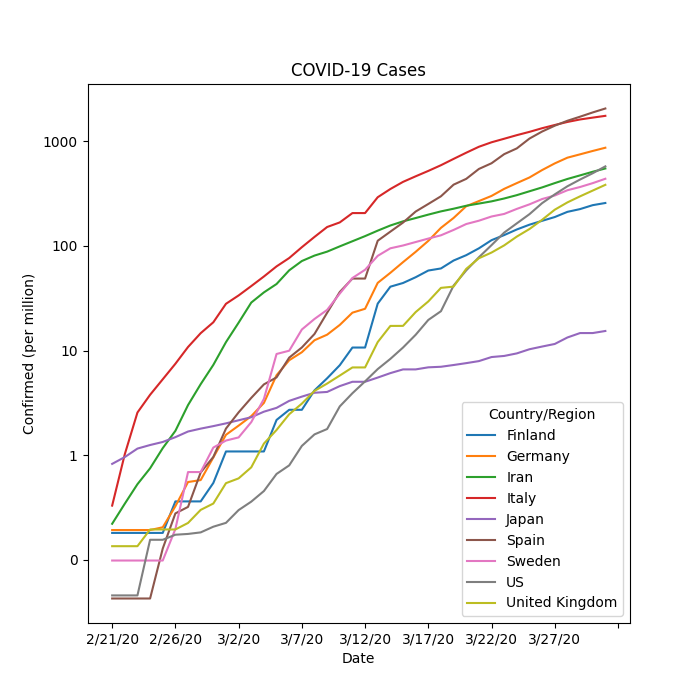
Python script for plotting the COVID-19 cases on a logarithmic scale for selected countries.
Pulls and renders data from the Johns Hopkins data repository.
To select countries, edit the population variable.
usage: plot.py [-h] [-d DATASET] [-l] [-pc]

optional arguments:
  -h, --help            show this help message and exit
  -d DATASET, --data DATASET
                        dataset (default: confirmed), possible values:
                        confirmed, recovered, deaths
  -l, --linear          use linear scale (default: false)
-pc, --per-capita show values per million people (default: false)This script generates a .png file in the same directory. It uses Python 3.7, Pandas and Matplotlib.
Running with pipenv
# Install dependencies
pipenv install
# Open virtual environment
pipenv shell
# Run the script
python3 plot.py# Install dependencies
pip3 install pandas matplotlib
# Run the script
python3 plot.pyThe script is for indicative purposes only and provided "as-is", "with all faults" and "as available". There are no guarantees for the accuracy or timeliness of information generated by this script.
