This is my personal workspace to try out data visualization libraries in Python. The libraries featured are matplotlib and pygal.
- Install Python >= 3.9
python -m venv project_env./project_env/Scripts/activatepip install -r requirements.txt
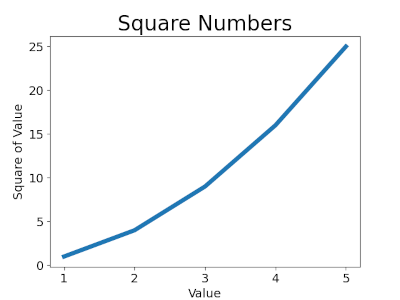
Demonstrates one of the most basic uses of matplotlib. This is essentially a HelloWorld of this graphing library.
To run:
python mpl_squares.py
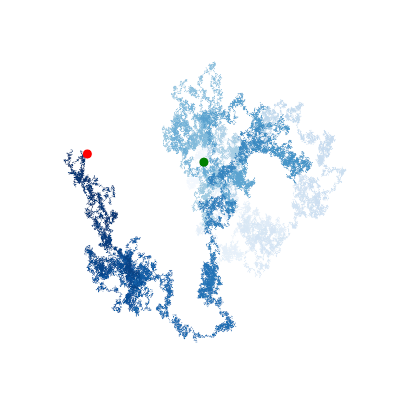
Visualizes a random walk using the gradient feature of matplotlib.
To run:
python rw_visual.py
Use Pygal to make an interactive SGV file of a histogram of many trials of rolling dice
To run:
python dice_visual.py
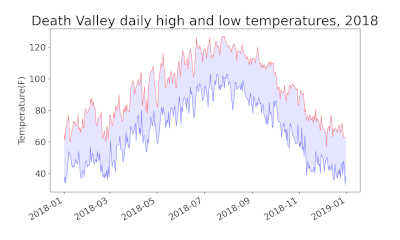
Reads data in CSV format and plots it out using matplotlib pyplot
To run:
python highs_lows.py
Uses pygal to make an interactive SVG of world population by country.
To run:
python -m population
Uses the GitHub public API to chart the most starred public Python repos
To run:
python -m apis/python_repos.py


