this repo is no longer maintained.
currently I am using the docker version only.
config files for unbound recursive dns and a dashboard config based on grafana, runnable on pi
The following steps have been tested to be working on Ubuntu Server 20.04.2 LTS for Raspberry Pi 2. Newer versions of hardware should work as well.
-
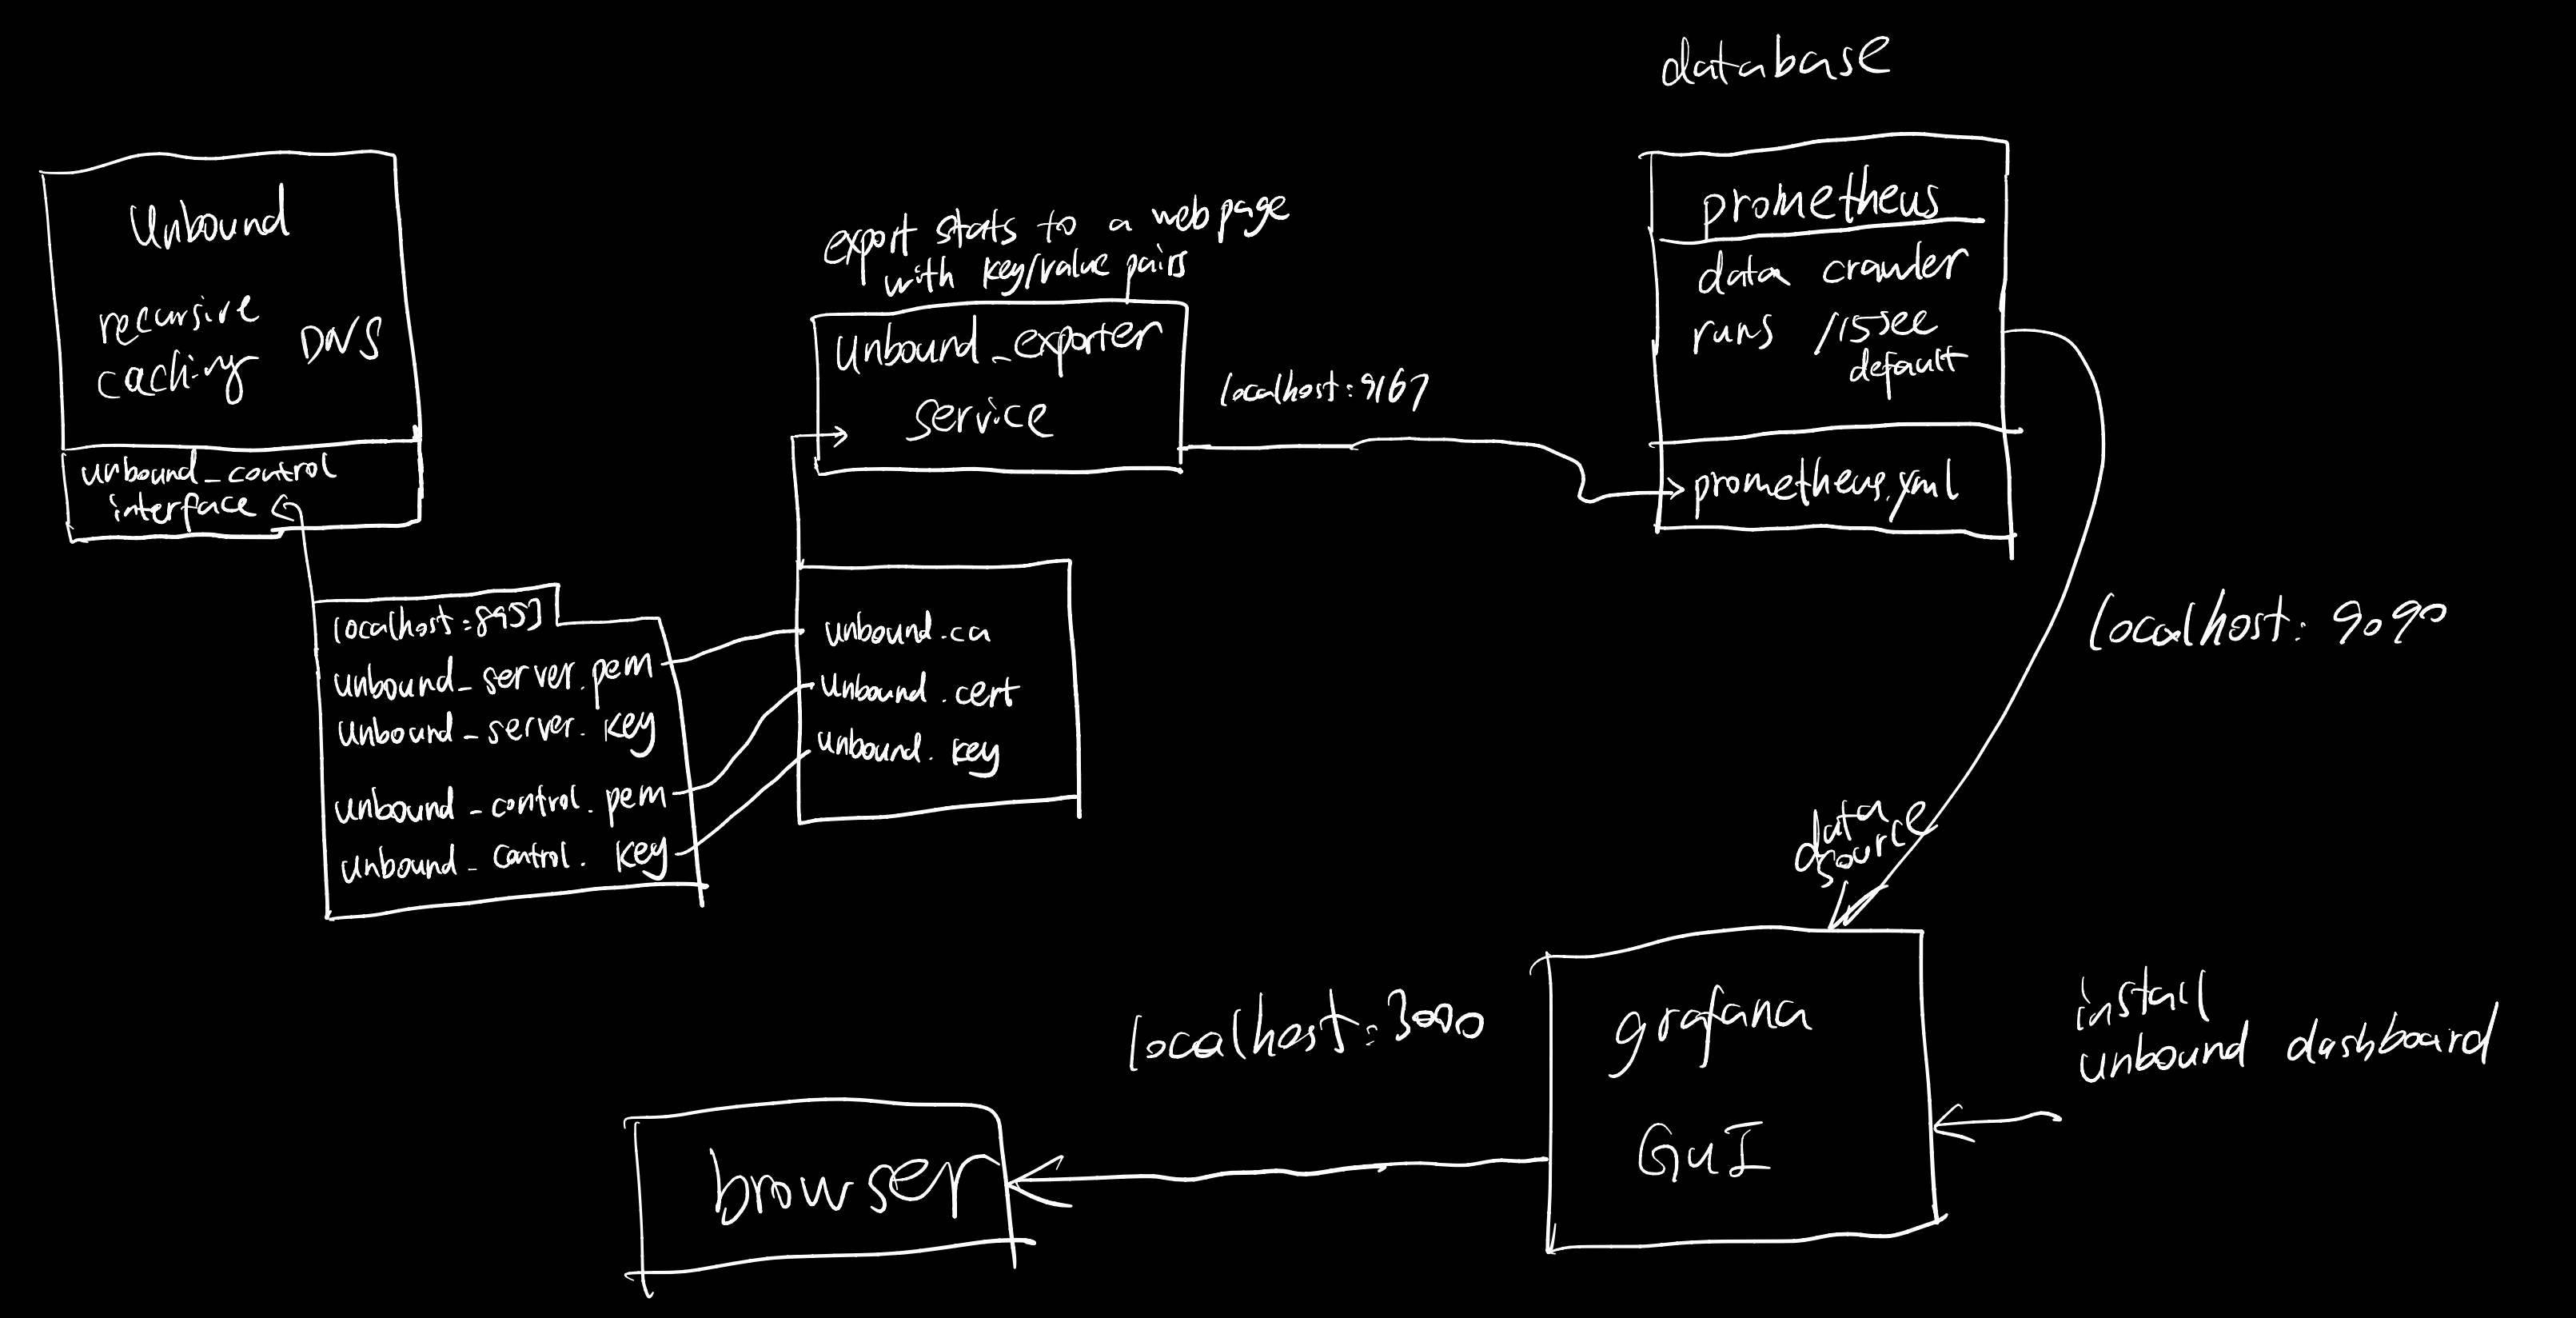
install and config unbound, including setup new control certificate for the server (needed when exporting the stats with unbound_exporter)
sudo apt-get install unbound sudo curl -o /var/lib/unbound/root.hints https://www.internic.net/domain/named.cache sudo cp unbound.conf /etc/unbound/unbound.conf.d/ sudo systemctl enable unbound sudo service unbound restart-
guide to configure unbound
-
to generate self-signing certificate for unbound control interface if you don't have any under /etc/unbound
sudo unbound-control-setupthis will generate
unbound_server.pem,unbound_server.key,unbound_control.pem,unbound_control.key -
to update
root.hintautomatically, edit/etc/crontab#unbound update root hint 55 4 * * * root curl -o /var/lib/unbound/root.hints https://www.internic.net/domain/named.cacheto learn how to use crontab: https://crontab guru
-
-
install Grafana
-
install PROMETHEUS
sudo apt-get install prometheus -
compile and install unbound_exporter, which uses unbound control interface to export stats to a webpage
go get github.com/kumina/unbound_exporter go install github.com/kumina/unbound_exporter sudo cp go/bin/unbound_exporter /usr/bin sudo cp go/bin/unbound_exporter /usr/sbin sudo cp unbound-exporter.service /lib/systemd/system/ sudo systemctl enable unbound-exporter.service sudo service unbound-exporter restart -
config PROMETHEUS file to use unbound_exporter as a source
-
sudo cp prometheus.yml /etc/prometheus/ -
may/maynot need to enable unbound scrap service in prometheus control panel at
http://pi_address:9090/targets
-
-
in grafana(
http://pi_address:3000): add data source -> prometheus in grafana web panelurl: localhost:9090
-
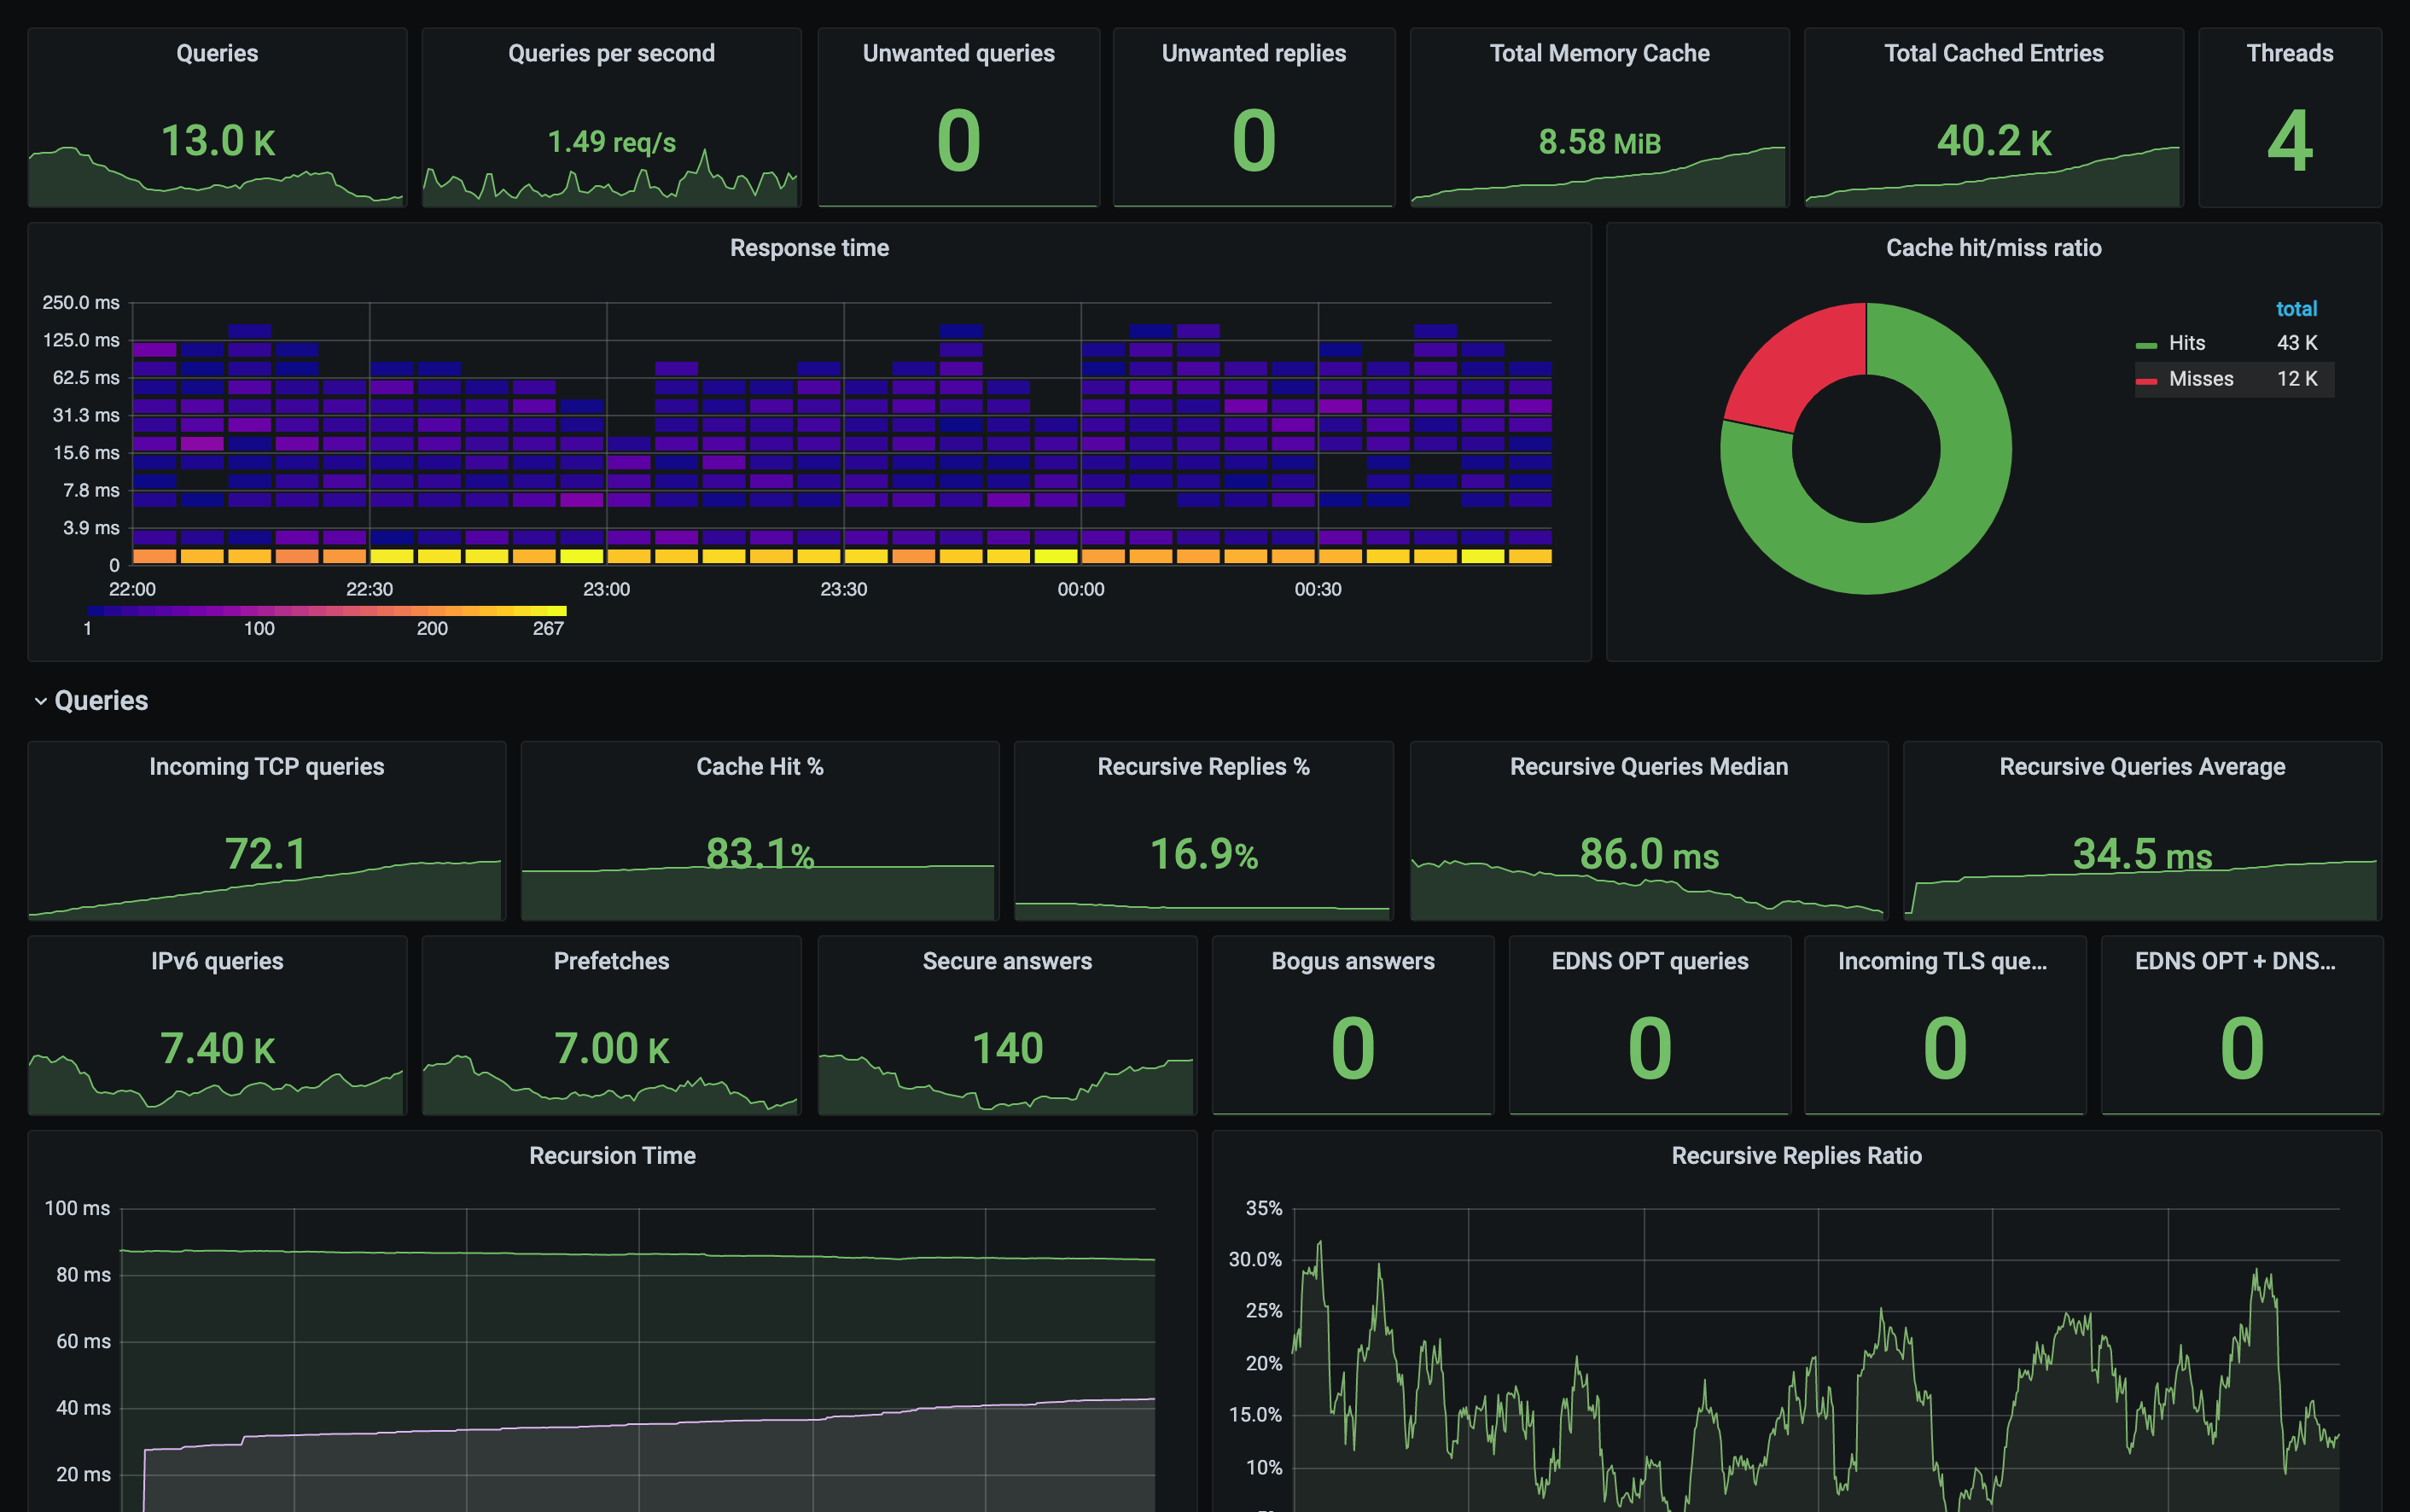
install unbound panel
- manage panel->import via panel json
- copy contents in
grafana.jsonover. This panel was modified from unbound dashboard by svartalf
-
after installation, grafana should be accessed at
http://pi_address:3000
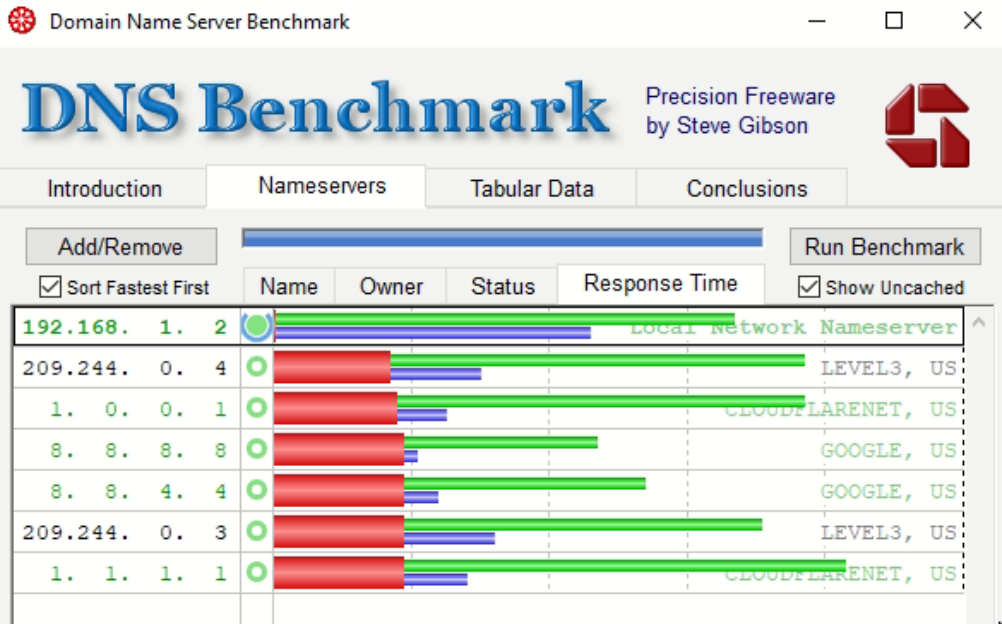
performance over 400Mbps/?Mbps cable connecton
 Final benchmark results, sorted by nameserver performance:
 (average cached name retrieval speed, fastest to slowest)

  192.168.  1.  2 |  Min  |  Avg  |  Max  |Std.Dev|Reliab%|
  ----------------+-------+-------+-------+-------+-------+
  + Cached Name   | 0.000 | 0.000 | 0.002 | 0.000 | 100.0 |
  + Uncached Name | 0.016 | 0.067 | 0.279 | 0.065 | 100.0 |
  + DotCom Lookup | 0.018 | 0.046 | 0.088 | 0.026 | 100.0 |
  ---<O-OO---->---+-------+-------+-------+-------+-------+


