A collection of things related to display and analysis around the 2013 Colorado Flood.
I posted a series of blog posts that focued on two professional interests: early warning systems and the Twitter Data Platform. The following posts start with a discussion of looking for a rainfall 'signal' in Twitter data, then discuss potential roles the Twitter network could play in early-warning systems, then wrap up with how the 2013 Colorado Flood unfolded on Twitter...
The research behind these blog posts included a variety of software tools that helped harvest both Twitter and meteorlogical data, store that data in a MySQL database, and then perform the time-series analysis presented.
So far these tools have fallen out of this effort:
- EventBinner: Ruby code that pulls data from MySQL and outputs event (Geo)JSON data. Combines Twitter and 'external' data into an integrated source file for project viewers.
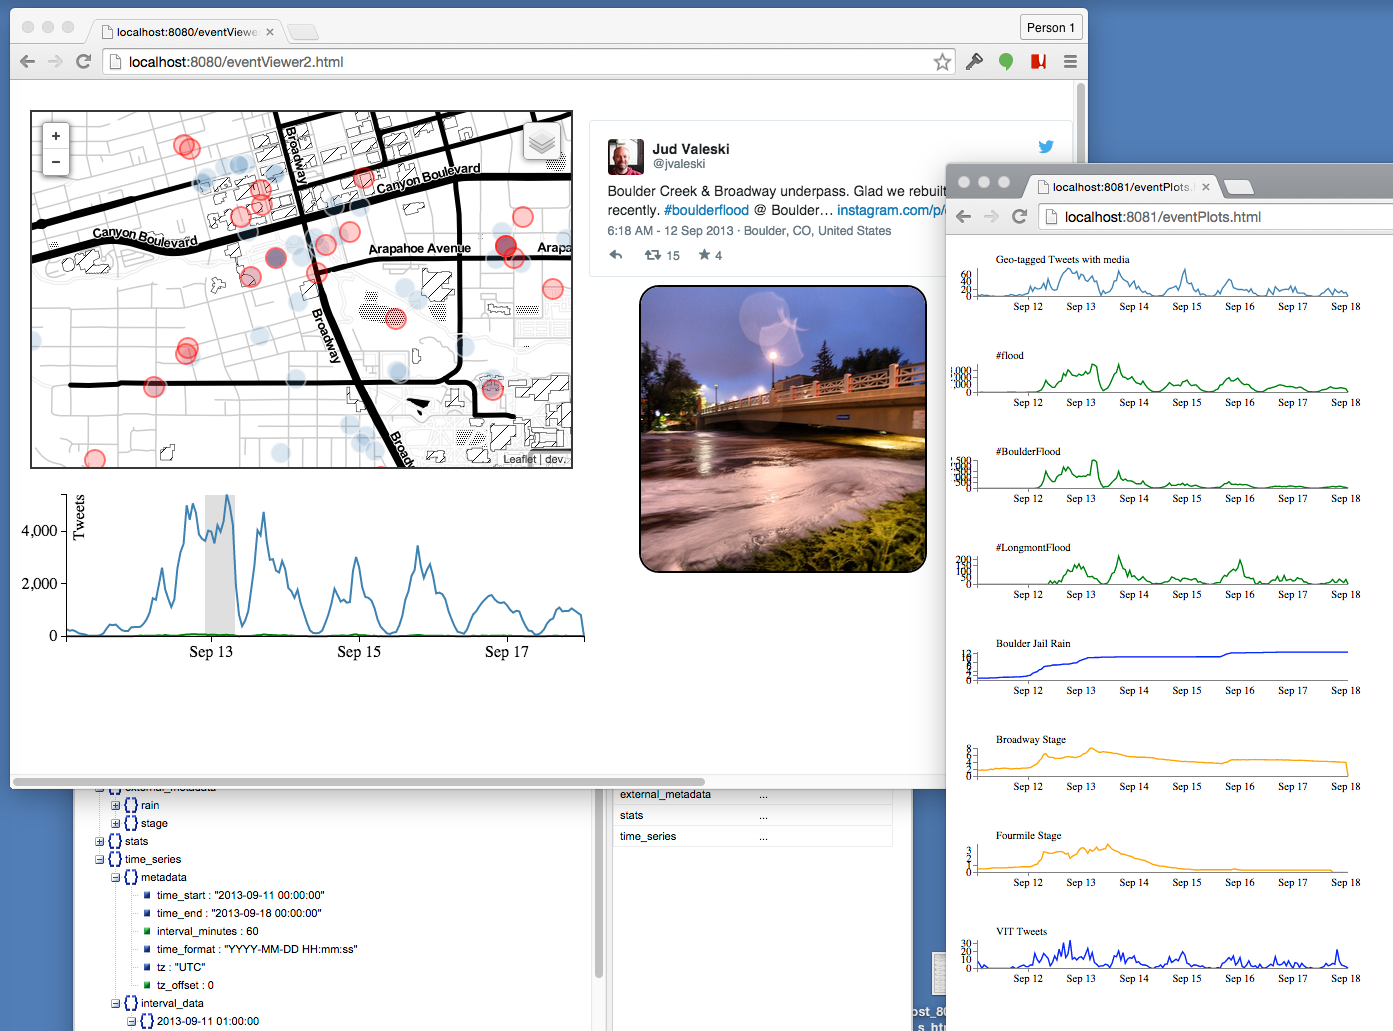
- EventViewer: Web map-based event viewer. Source 'maperator' project lives here: https://github.com/blehman/maperator
- EventPlots: prototype for building d3 time-series plots of event.
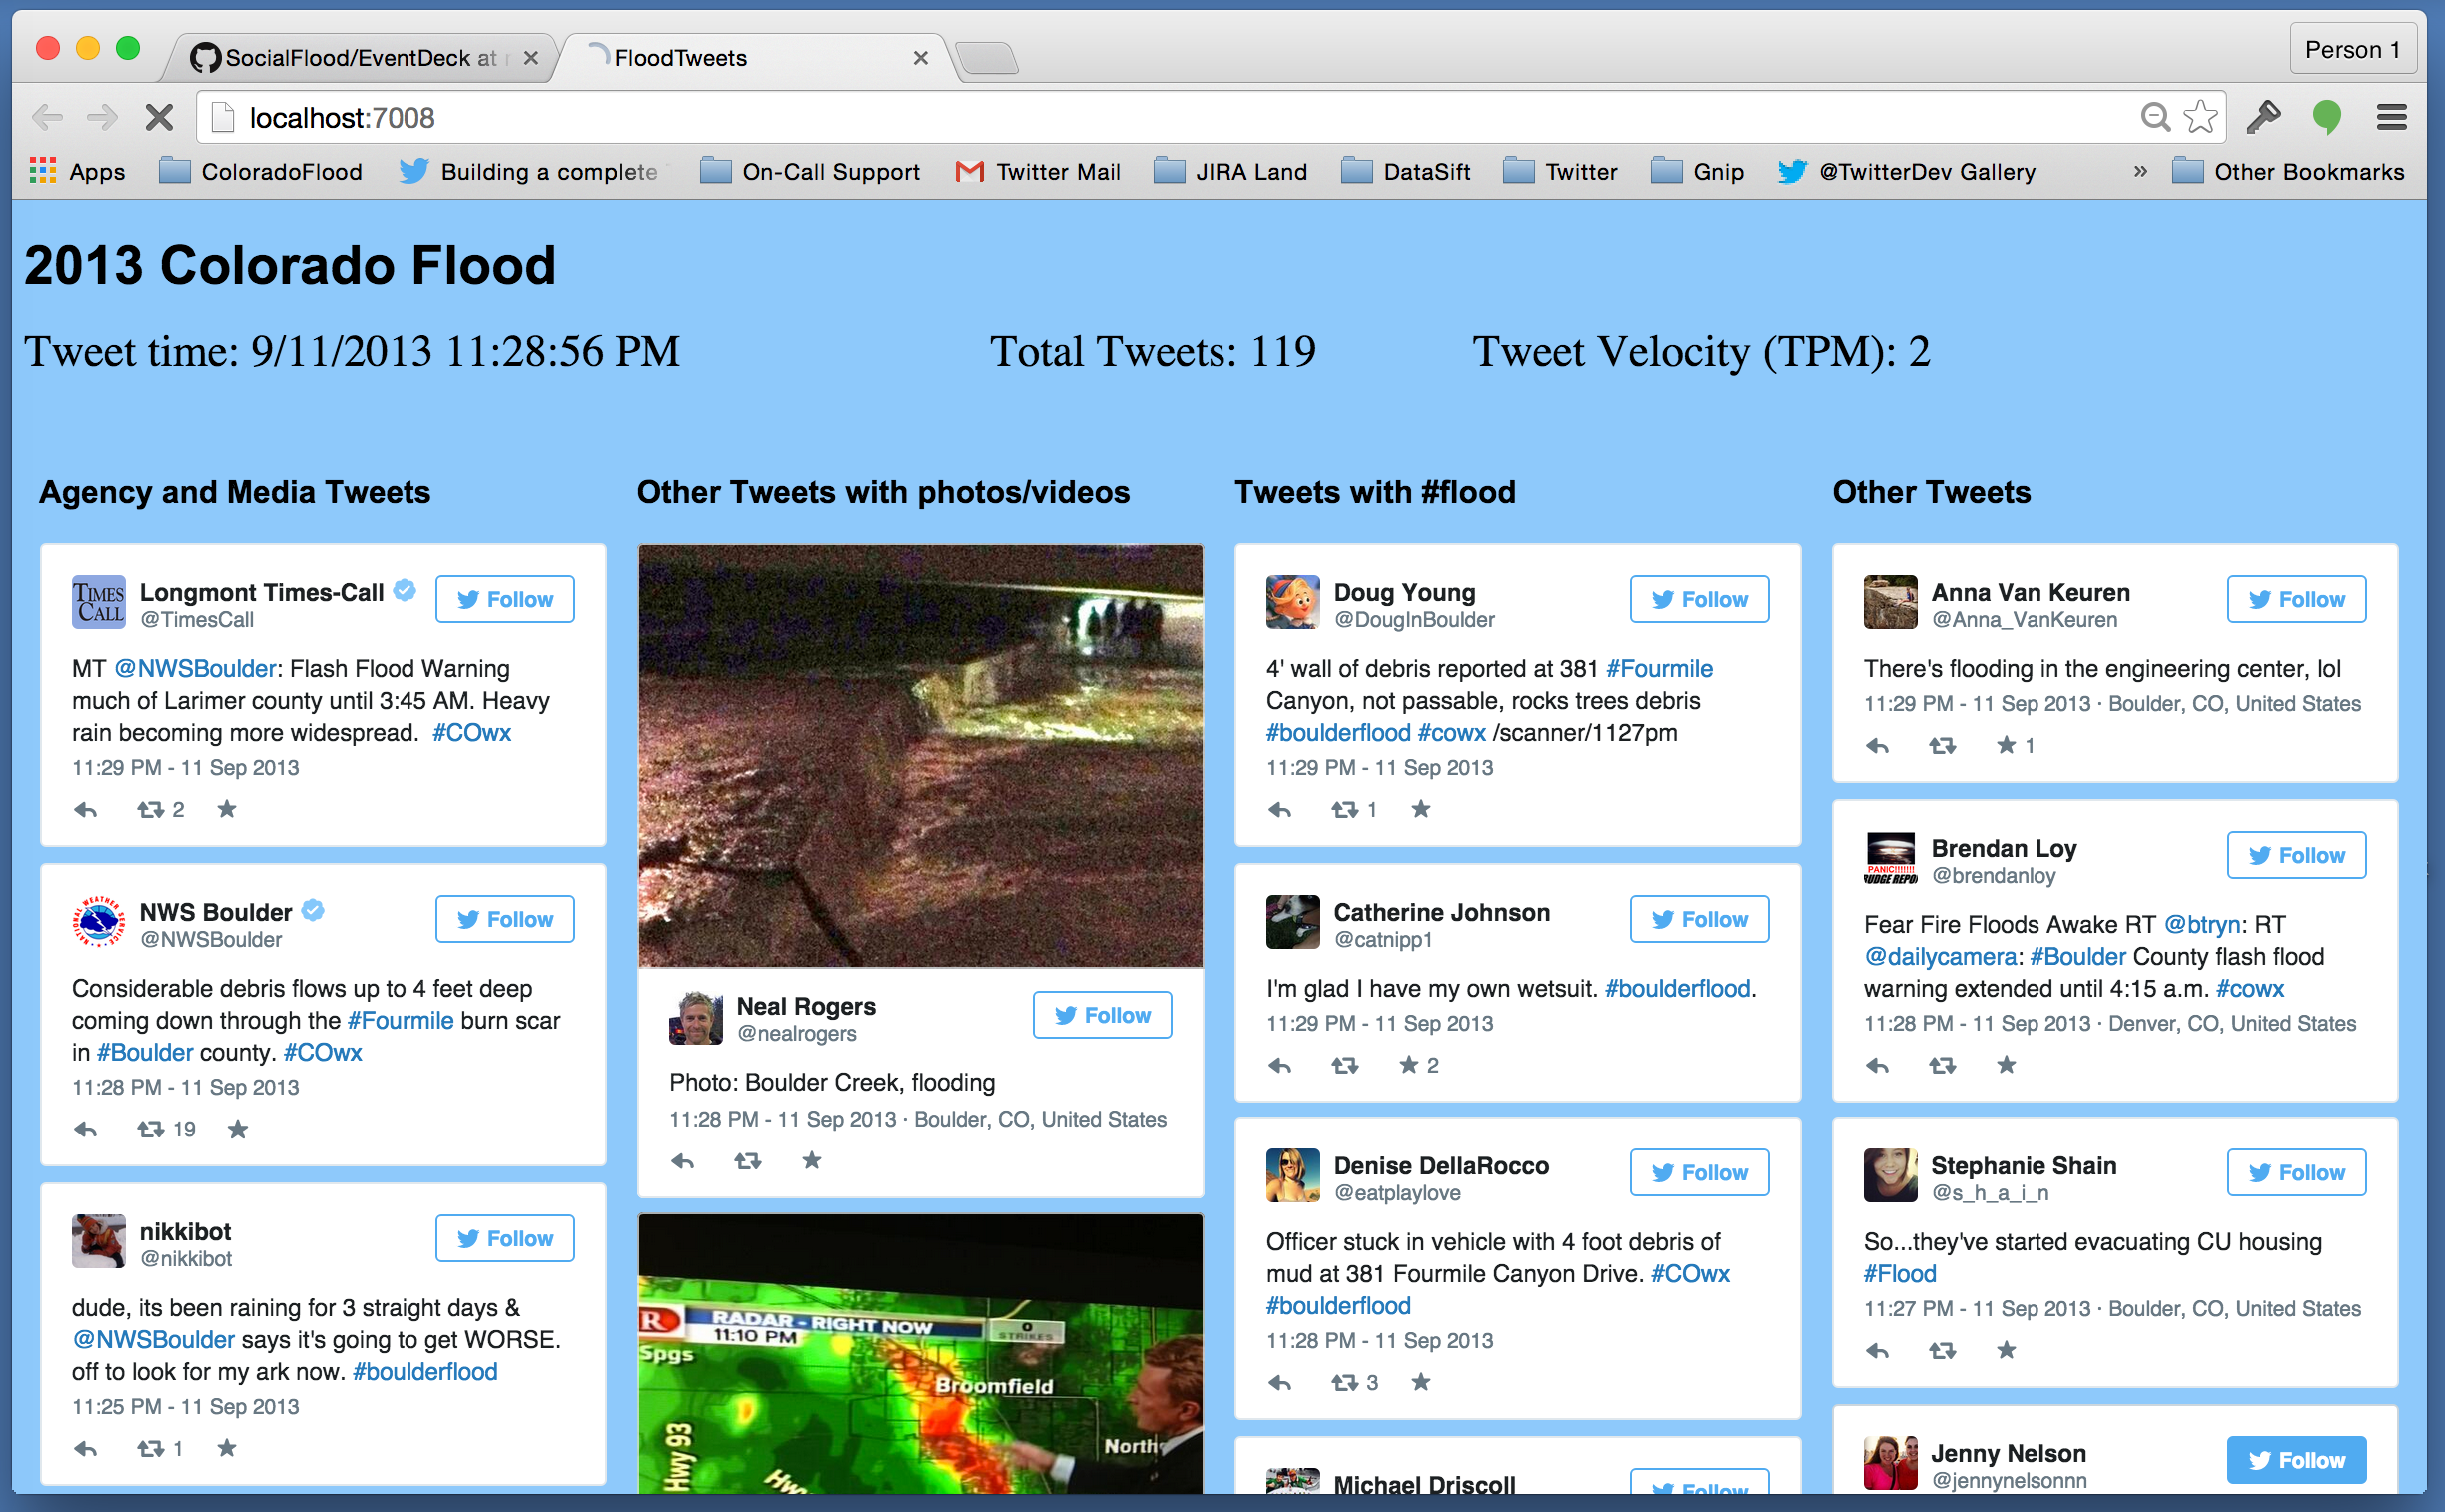
- EventDeck: Receives streamed data and displays Tweets in pre-defined columns, ala TweetDeck.