A Prometheus exporter for certificates focusing on expiration monitoring, written in Go. Designed to monitor Kubernetes clusters from inside, it can also be used as a standalone exporter.
Get notified before they expire:
- PEM encoded files, by path or scanning directories
- Kubeconfigs with embedded certificates or file references
- TLS Secrets from a Kubernetes cluster
The Helm chart is the most straightforward way to get a fully-featured exporter running on your cluster. The chart is also highly-customizable if you wish to. See the chart documentation to learn more.
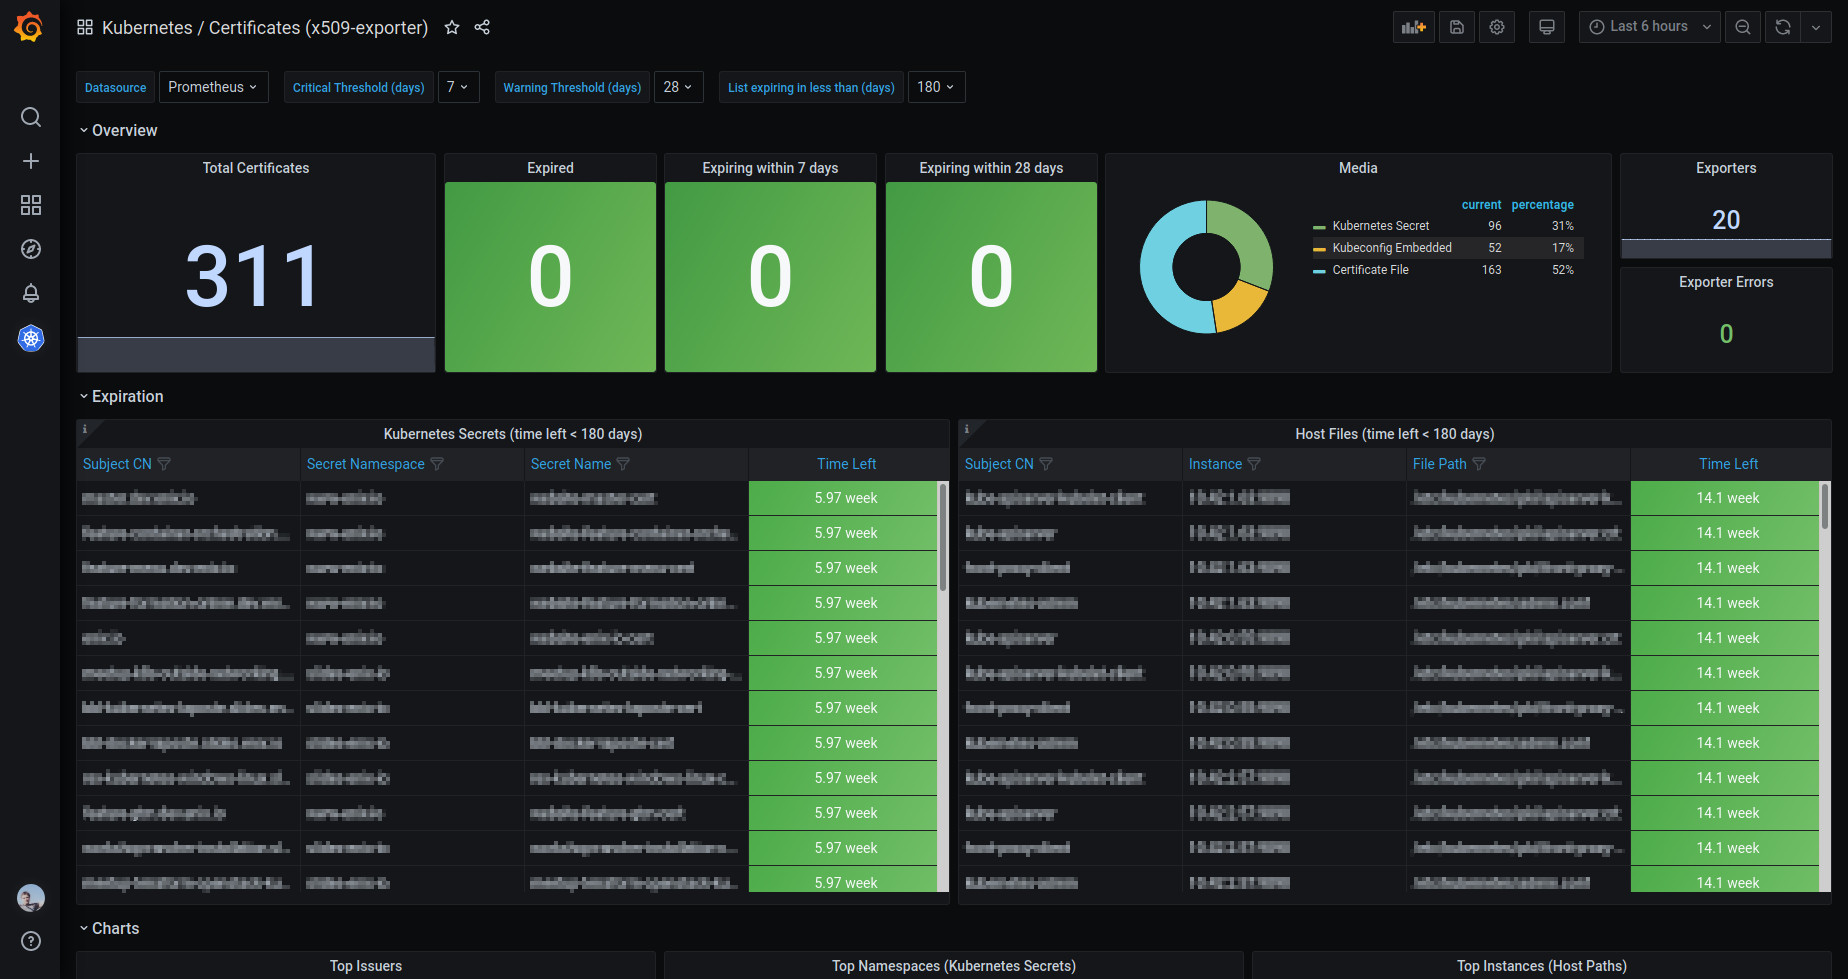
The provided Grafana Dashboard can also be used to display the exporter's metrics on your Grafana instance.
A docker image is available at enix/x509-certificate-exporter.
Every release comes with pre-built binaries for many supported platforms.
The project's entry point is ./cmd/x509-certificate-exporter.
You can run & build it as any other Go program:
go build ./cmd/x509-certificate-exporterThe following metrics are available:
x509_cert_not_beforex509_cert_not_afterx509_cert_expiredx509_cert_expires_in_seconds(optional)x509_cert_valid_since_seconds(optional)x509_cert_error(optional)x509_read_errorsx509_exporter_build_info
When installation is not performed with Helm, the following Prometheus alerting rules may be deployed manually:
rules:
    - alert: X509ExporterReadErrors
        annotations:
            description: Over the last 15 minutes, this x509-certificate-exporter instance
                has experienced errors reading certificate files or querying the Kubernetes
                API. This could be caused by a misconfiguration if triggered when the exporter
                starts.
            summary: Increasing read errors for x509-certificate-exporter
        expr: delta(x509_read_errors[15m]) > 0
        for: 5m
        labels:
            severity: warning
    - alert: CertificateRenewal
        annotations:
            description: Certificate for "{{ $labels.subject_CN }}" should be renewed
                {{if $labels.secret_name }}in Kubernetes secret "{{ $labels.secret_namespace
                }}/{{ $labels.secret_name }}"{{else}}at location "{{ $labels.filepath }}"{{end}}
            summary: Certificate should be renewed
        expr: ((x509_cert_not_after - time()) / 86400) < 28
        for: 15m
        labels:
            severity: warning
    - alert: CertificateExpiration
        annotations:
            description: Certificate for "{{ $labels.subject_CN }}" is about to expire
                {{if $labels.secret_name }}in Kubernetes secret "{{ $labels.secret_namespace
                }}/{{ $labels.secret_name }}"{{else}}at location "{{ $labels.filepath }}"{{end}}
            summary: Certificate is about to expire
        expr: ((x509_cert_not_after - time()) / 86400) < 14
        for: 15m
        labels:
            severity: critical
For advanced configuration, see the program's --help:
Usage: x509-certificate-exporter [-hv] [-b value] [--debug] [-d value] [--exclude-label value] [--exclude-namespace value] [--expose-per-cert-error-metrics] [--expose-relative-metrics] [-f value] [--include-label value] [--include-namespace value] [--kubeconfig path] [-k value] [-l value] [--max-cache-duration value] [--profile] [-s value] [--trim-path-components value] [--watch-kube-secrets] [--web.config.file value] [--web.systemd-socket] [parameters ...]
 -b, --listen-address=value
                address on which to bind and expose metrics [:9793]
     --debug    enable debug mode
 -d, --watch-dir=value
                watch one or more directory which contains x509 certificate
                files (not recursive)
     --exclude-label=value
                removes the kube secrets with the given label (or label
                value if specified) from the watch list (applied after
                --include-label)
     --exclude-namespace=value
                removes the given kube namespace from the watch list
                (applied after --include-namespace)
     --expose-per-cert-error-metrics
                expose additionnal error metric for each certificate
                indicating wether it has failure(s)
     --expose-relative-metrics
                expose additionnal metrics with relative durations instead
                of absolute timestamps
 -f, --watch-file=value
                watch one or more x509 certificate file
 -h, --help     show this help message and exit
     --include-label=value
                add the kube secrets with the given label (or label value if
                specified) to the watch list (when used, all secrets are
                excluded by default)
     --include-namespace=value
                add the given kube namespace to the watch list (when used,
                all namespaces are excluded by default)
     --kubeconfig=path
                Path to the kubeconfig file to use for requests. Takes
                precedence over the KUBECONFIG environment variable, and
                default path (~/.kube/config).
 -k, --watch-kubeconf=value
                watch one or more Kubernetes client configuration (kind
                Config) which contains embedded x509 certificates or PEM
                file paths
 -l, --expose-labels=value
     --max-cache-duration=value
                maximum cache duration for kube secrets. cache is per
                namespace and randomized to avoid massive requests.
     --profile  optionally enable a pprof server to monitor cpu and memory
                usage at runtime
 -s, --secret-type=value
                one or more kubernetes secret type & key to watch (e.g.
                "kubernetes.io/tls:tls.crt"
     --trim-path-components=value
                remove <n> leading component(s) from path(s) in label(s)
 -v, --version  show version info and exit
     --watch-kube-secrets
                scrape kubernetes secrets and monitor them
     --web.config.file=value
                [EXPERIMENTAL] path to configuration file that can enable
                TLS or authentication
     --web.systemd-socket
                use systemd socket activation listeners instead of port
                listeners (Linux only)
Some snippets to get started with development and testing:
# Run server, watch test input files, only listen on localhost to
# avoid firewall popup dialogs
go run ./cmd/x509-certificate-exporter --debug -b localhost:9793 -d test/

# Once the server is running, you can check the exported metrics
curl -Ss localhost:9793/metrics | grep "^x509_cert_not_after"

# Automated tests work against a Kubernetes cluster, so create a throwaway
# cluster (for example with kind). Do not run the server locally because the
# tests run the server executable with the default listening port.
kind create cluster --kubeconfig ~/.kube/config-kind
export KUBECONFIG=~/.kube/config-kind
go test -v ./internal
kind delete cluster

# Docker build (does not run tests)
docker buildx build .For two reasons.
First, Prometheus tends to do better storage consumption when a value stays identical over checks.
Then, it is better to compute the remaining time through a prometheus query as some latency (seconds) can exist between this exporter check and your alert or query being run.
Here is an example:
x509_cert_not_after - time()
When collecting metrics from tools like Datadog that does not have timestamp functions,
the exporter can be run with the --expose-relative-metrics flag in order to add the following optional metrics:
x509_cert_valid_since_secondsx509_cert_expires_in_seconds
Changes in paths or deleted files may silently break the ability to watch critical certificates.
Because it's never convenient to alert on disapearing metrics, the exporter will publish on x509_read_errors how many
paths could not be read. It will also count Kubernetes API responses failures, but won't count deleted secrets.
A basic alert would be:
x509_read_errors > 0


