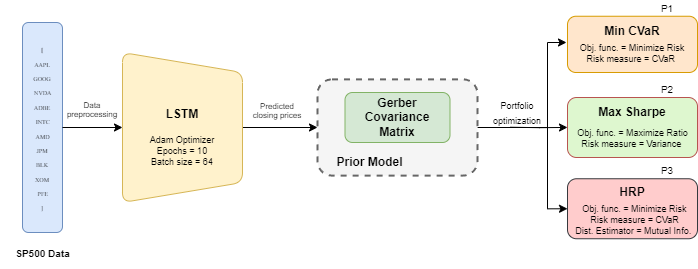
A hybrid model incorporating ML and statistical methods to optimize the portfolio using a Long Short Term Memory (LSTM) network and a covariance matrix based on the Gerber statistic. It estimates the return prices and consequently constructs a Gerber estimator covariance matrix.
- The dataset with our chosen stocks from SP500 are Apple, Google, Nvidia, Adobe, Intel, AMD, JPMorgan Chase & Co, Blackrock, Exxon Mobil, Pfizer.
- The LSTM architecture comprises two layers- a 128-unit layer followed by a 64-unit layer for temporal dependency capture, followed by dense layers for mapping.
- Used the Adam Optimizer and iterated over 10 epochs with a batch size of 64. The validation data is used to check the accuracy of the predicted values and a Root Mean Squared (RMSE) is calculated for each stock.
- The predicted stock closing prices generated from LSTM model form the basis for the input for statistical analysis for portfolio construction and optimizing portfolio weights.
- Before portfolio construction and optimization, a Prior Model is constructed. A Prior Model represents our assumptions about the model that is used to estimate the distribution of asset returns. Our assumptions about the expected returns and their distribution, a covariance matrix and the assets return estimation distribution make up the Prior Model.
- Here, using the Gerber covariance matrix with the JamesStein shrinkage for the estimation of expected returns is used. This model is used to fit the selected portfolio strategy and optimized based on their respective objective functions, subjected to certain constraints.
- Chosen panel of portfolio optimizers are Max Sharpe Ratio, Min CVaR, and Hierarchical Risk Parity (HRP). These employ different strategies to optimize portfolio weights and generate different stock distributions of portfolio compositions. These methodologies have been applied to generate predicted cumulative returns over our testing period spanning from July 2019 to July 2023.
