Note
This exporter currently only works with the mutability fork of dump1090.
The fork provides the /data/aicraft.json and /data/receivers.json
routes used by the exporter to fetch metrics.
Dump1090 is a simple Mode S decoder for RTLSDR devices that is commonly used for tracking aircraft. Dump1090 makes a number of operating metrics available to track the performance of the tool and its environment.
The dump1090exporter collects statistics from dump1090 and exposes it to the Prometheus monitoring server for aggregation and later visualisation (e.g. using Grafana).
The dump1090 exporter is written using Python 3 (Python3.6+) and will not work with Python 2. The dump1090 exporter is installed using the Python package manager pip. The pip3 alias typically links to the Python3 package manager so the install would look like this:
pip3 install dump1090exporterIf you are installing this package within a Python3 virtual environment then use:
pip install dump1090exporterThe dump1090exporter is also available as a Docker container. See the Docker section below for more details.
Once installed the dump1090 exporter can be easily run from the command line as the installation script includes a console entry point.
The dump1090 exporter accepts a number of command line arguments. These can be found by using the standard command line help request.
$ dump1090exporter -hBelow is an example usage.
$ dump1090exporter \
  --url=http://192.168.1.201:8080 \
  --port=9105 \
  --latitude=-34.9285 \
  --longitude=138.6007 \
  --debug
In the example above the exporter is instructed to monitor a dump1090 instance running on a machine with the IP address 192.168.1.201 using the default port (8080) used by dump1090 tool. The exporter exposes a service for Prometheus to scrape on port 9105 by default but this can be changed by specifying it with the --port argument.
The example above also instructs the exporter to use a specific receiver origin (lat, lon). In this case it is for Adelaide, Australia. In most cases the dump1090 tool is not configured with the receivers position. By providing the exporter with the receiver location it can calculate ranges to aircraft. If the receiver position is already set within the dump1090 tool (and accessible from the data/receivers.json resource) then the exporter will use that data as the origin.
The exporter fetches aircraft data (from data/aircraft.json) every 10 seconds. This can be modified by specifying a new value with the --aircraft-interval argument.
The exporter fetches statistics data (from data/stats.json) every 60 seconds, as the primary metrics being exported are extracted from the last1min time period. This too can be modified by specifying a new value with the --stats-interval argument.
The metrics that the dump1090 exporter provides to Prometheus can be accessed for debug and viewing using curl or a browser by fetching from the metrics route url. For example:
$ curl -s http://0.0.0.0:9105/metrics | grep -v "#"
dump1090_aircraft_recent_max_range{time_period="latest"} 1959.0337385807418
dump1090_messages_total{time_period="latest"} 90741
dump1090_recent_aircraft_observed{time_period="latest"} 4
dump1090_recent_aircraft_with_multilateration{time_period="latest"} 0
dump1090_recent_aircraft_with_position{time_period="latest"} 1
dump1090_stats_cpr_airborne{time_period="last1min"} 176
dump1090_stats_cpr_airborne{time_period="total"} 18293
...
The metrics exposed by the dump1090-exporter are all prefixed with the dump1090_ string so as to provide a helpful namespacing which makes them easier to find in visualisation tools such as Grafana.
The exporter exposes generalised metrics for statistics and uses the multi dimensional label capability of Prometheus metrics to include information about which group the metric is part of.
To extract information for the peak signal metric that dump1090 aggregated over the last 1 minute you would specify the time_period for that group:
dump1090_stats_local_peak_signal{job="dump1090", time_period="last1min"}In the stats.json data there are 5 top level keys that contain statistics for a different time period, defined by the "start" and "end" subkeys. The top level keys are:
- latest which covers the time between the end of the "last1min" period and the current time. In my dump1090 setup this is always empty.
- last1min which covers a recent 1-minute period. This may be up to 1 minute out of date (i.e. "end" may be up to 1 minute old)
- last5min which covers a recent 5-minute period. As above, this may be up to 1 minute out of date.
- last15min which covers a recent 15-minute period. As above, this may be up to 1 minute out of date.
- total which covers the entire period from when dump1090 was started up to the current time.
By default only the last1min time period is exported as Prometheus can be used for accessing historical data.
Prometheus needs to be told where to fetch the dump1090 metrics from. The Prometheus configuration file should be updated with a new entry under the 'scrape_configs' block, that looks something like this:
scrape_configs:
  - job_name: 'dump1090'
    scrape_interval: 10s
    scrape_timeout: 5s
    static_configs:
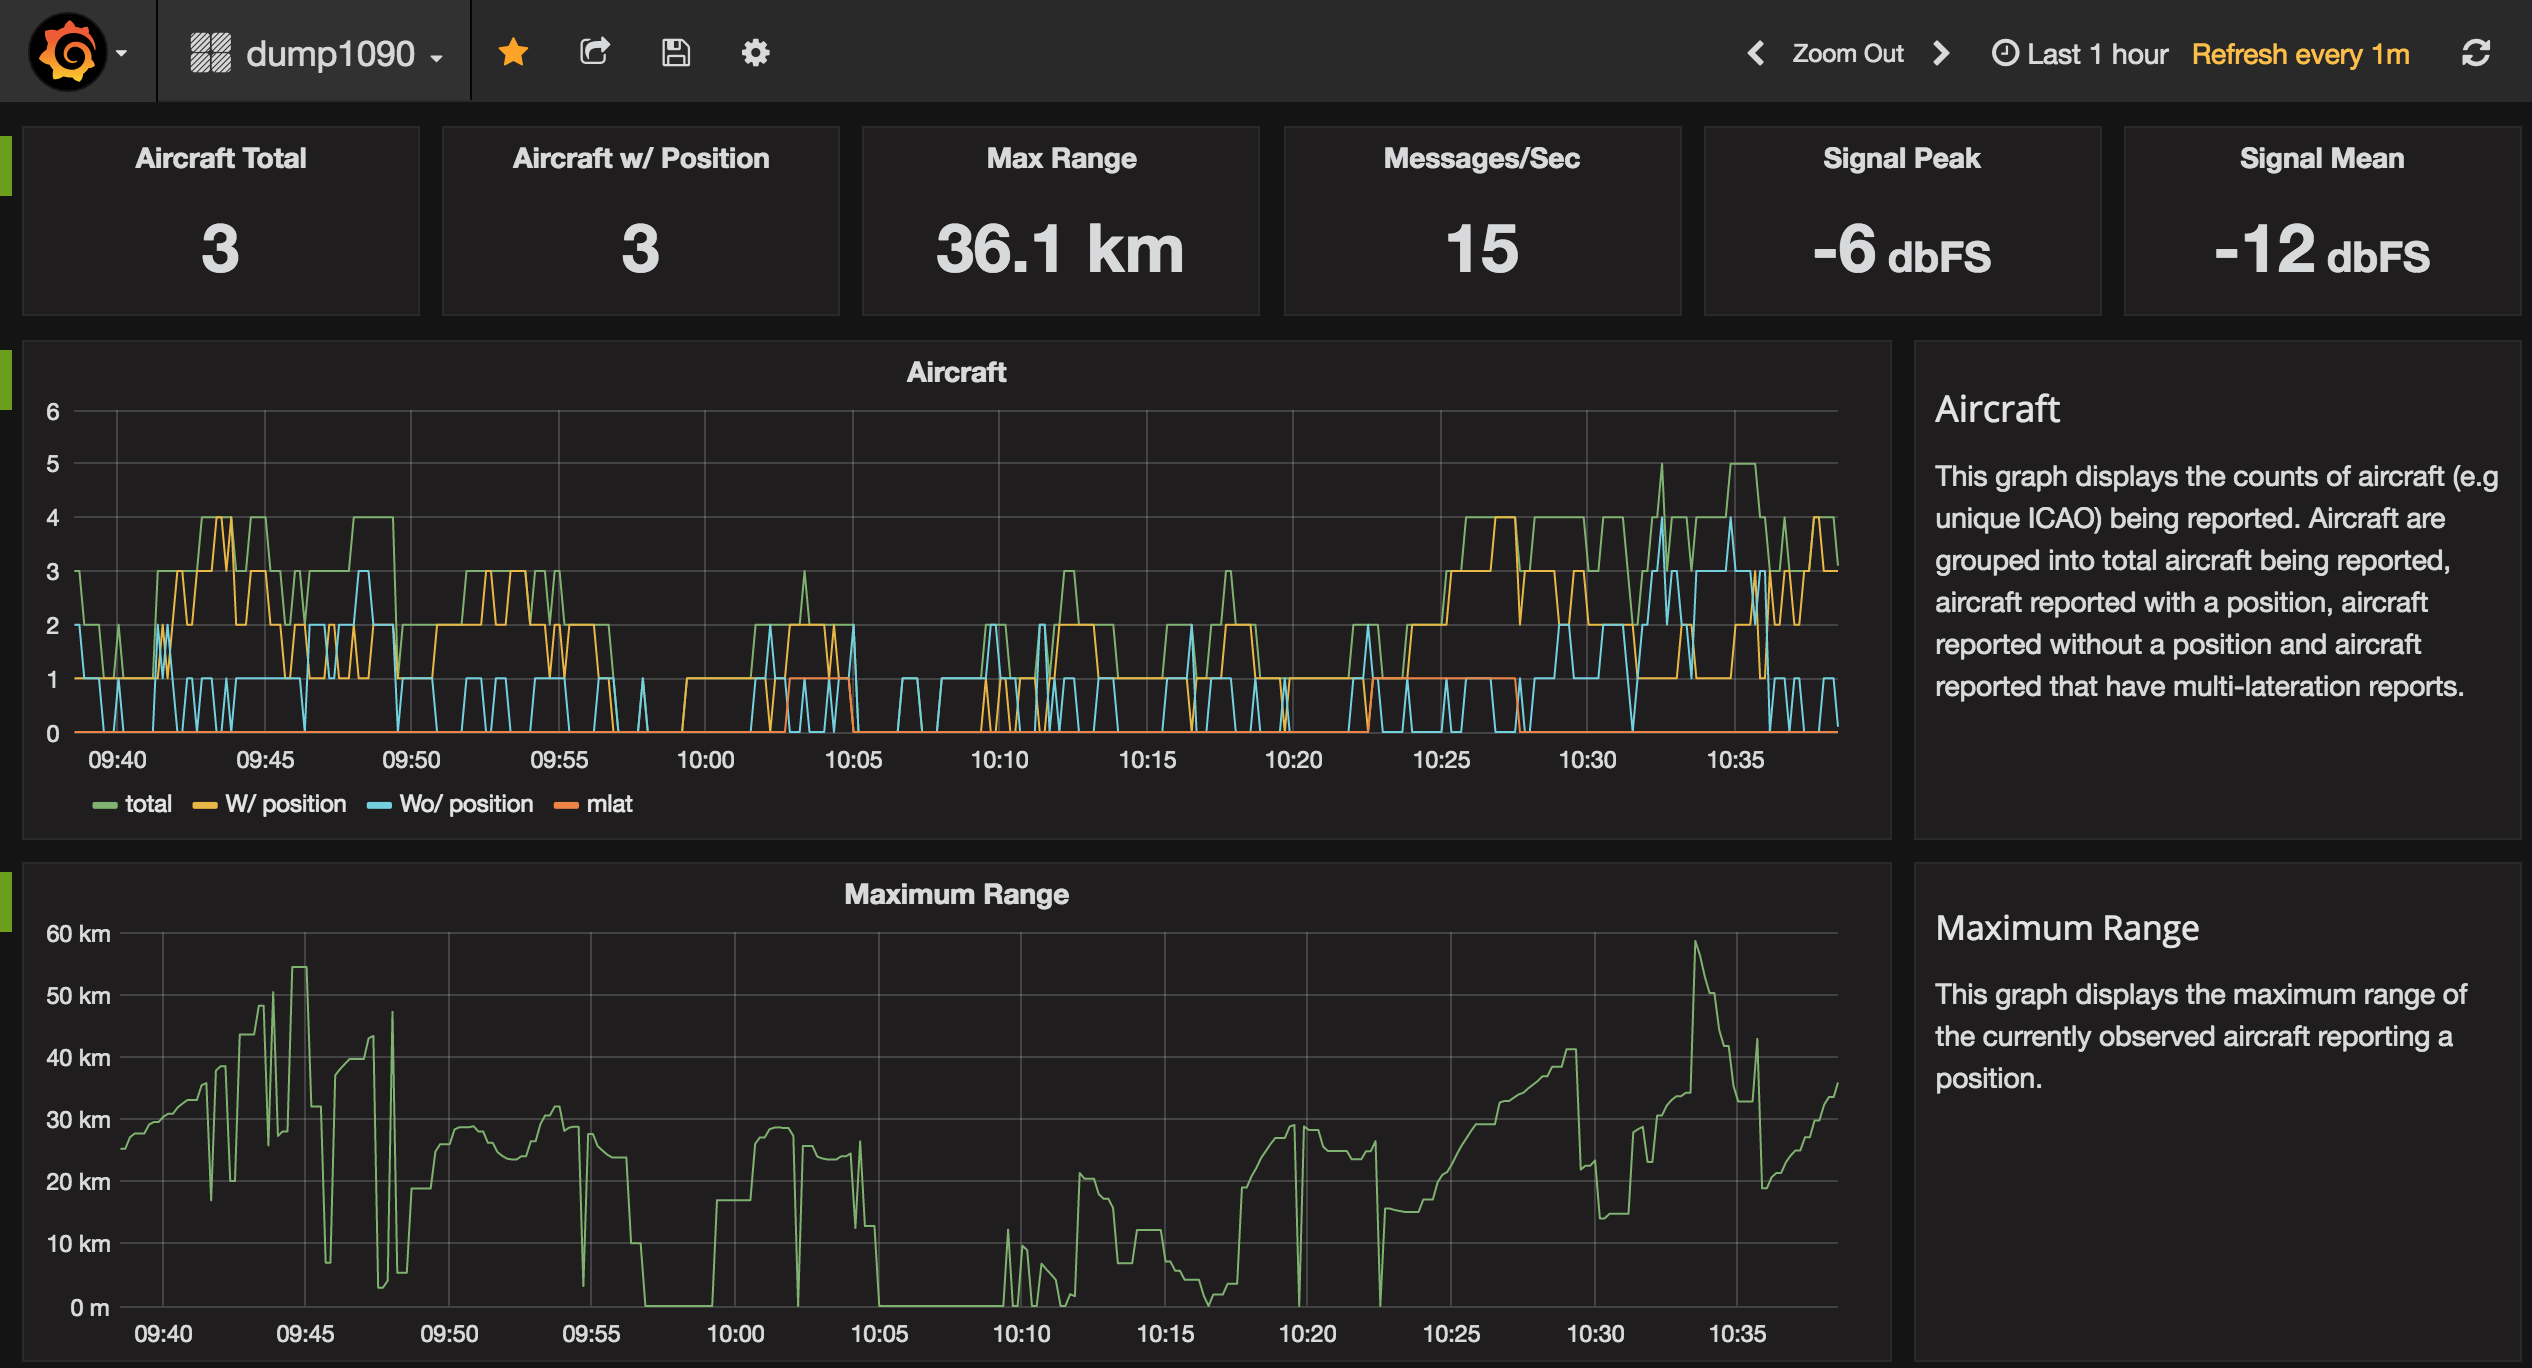
- targets: ['192.168.1.201:9105']The Granfana visualisation tool can display nice looking charts and it supports Prometheus. A dump1090export Grafana dashboard has been created to demonstrate how the data provided by the exporter can be visualised.
The dump1090 exporter has been packaged into a Docker container, which can simplify running it in some environments. The container is configured with an entry point that runs the dump1090 exporter with --help as the default argument.
$ docker run -it --rm clawsicus/dump1090exporter
usage: dump1090-exporter [-h] [--url <dump1090 url>]
...
To run the dump1090 exporter container simply pass the standard command line arguments to it:
$ docker run -p 9105:9105 \
  --detach \
  --restart always \
  clawsicus/dump1090exporter \
  --url=http://192.168.1.201:8080 \
  --latitude=-34.9285 \
  --longitude=138.6007