This package is developed for users to access and plot real-time air pollute PM2.5 level near you, at a city, at any location, or in a region around the world. The purpose is to increase overall awareness about the dangerous of air pollution to human health, particularly in some developing countries.
PM2.5 refers to atmospheric particulate matter (PM) that have a diameter less than 2.5 micrometers. PM2.5 can come from various sources. Many experts believe that two main sources are power plants and motor vehicles. The effects of inhaling PM that have been widely studied in humans and animals include asthma, lung cancer, cardiovascular disease, respiratory diseases, premature delivery, birth defects, and premature death. Please refer to the wikipedia page Particulate Matter about PM's health effects and more.
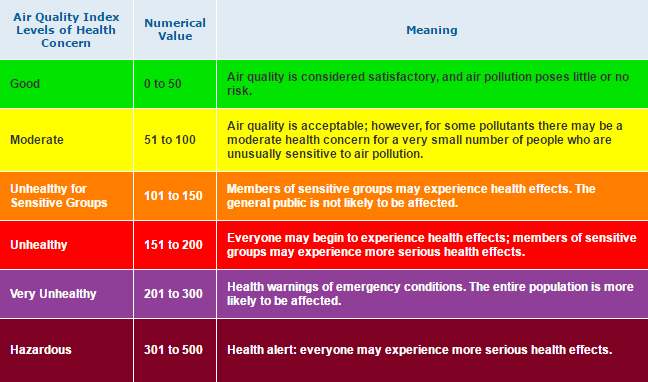
According to US EPA, PM2.5 can be both quantitatively measured by AQI (air quality index) and qualitatively measured by APL (air pollution level).
Please refer to US EPA official website airnow.gov for more information. In this package, both AQI and APL are provided.
The real-time PM2.5 data feed are from WAQ (World Air Quality) Project via JSON API. According to WAQ, "Real-time Air Quality information is available for than 9000 stations in 800 major cities from 70 countries, thanks to the huge effort from the world EPAs (Environmental Protection Agencies)."
To use globalPM25 package to access real-time PM2.5 data feed, users first need to request a personal token from WAQ website. To request your personal token, please visit this link. For more about JSON API, please visit this link.
There are 10 functions/.R files in the package. Below are the names and a short description for each of them.
-
settoken(token): set your personal token requested from WAQ website -
processPMdata(data): process raw data feed. extract information such as PM2.5 AQI, APL, local time, address, and geographical location into a dataframe -
getPMbyCityNames(citynames): query PM2.5 level by a city name or a vector of city names. this function will request real-time feed and process the feed by callingprocessPMdata. Output is organized in a dataframe. -
getPMbylatlon(latitude, longitude): similar togetPMbyCityNamesbut query by latitude and longitude instead of a city name -
getPMnearme(): similar togetPMbyCityNamesbut query by a station closest to you based on computer IP address. -
getPMinRegion(): similar togetPMbyCityNamesbut query by a list of stations in a region. The region can be defined in two ways: a)getPMinRegion(cityname, distance)a city name and a distance range. b)getPMinRegion(geobound = c(lat1, lon1, lat2, lon2))a rectangular boundary defined by a pair of latitudes and longitudes at opposite corners. -
getPMatMajorWorldCities(): similar togetPMbyCityNamesbut the cities are pre-selected major cities around the world. the city names can be listed usinggetglobalPM25Options()and set usingsetworldcities(citynames)inglobal.R. -
getPM_Country(countryname, countrybound): similar togetPMinRegionusing google map -
getPM_City(cityname, radius): similar togetPMinRegionusing google map -
plotPMdat(): demo to plot some results -
zzz.R: use to suppress no global variable binding note. -
global.R: set access to some variables such as token string, WAQ URL string, etc.
There are 2 data sets, which are:
-
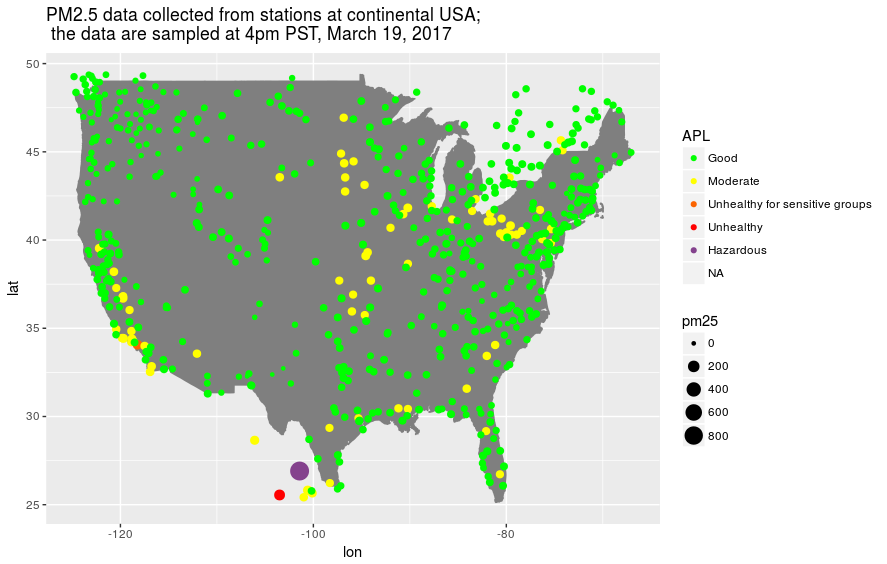
usdat.rda: this contains PM2.5 data collected from all stations at continental USA usinggetPMinRegion(). the data are collected at 4pm PST, March 19, 2017 -
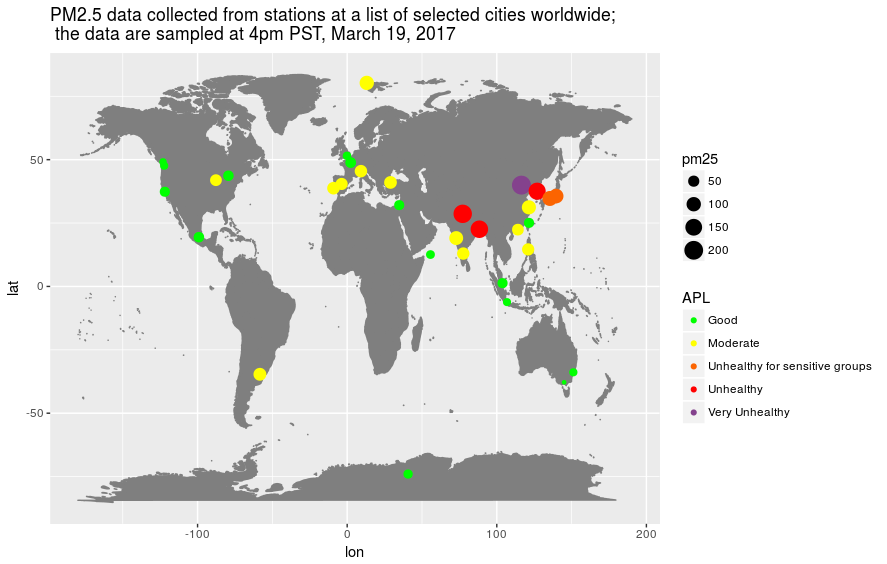
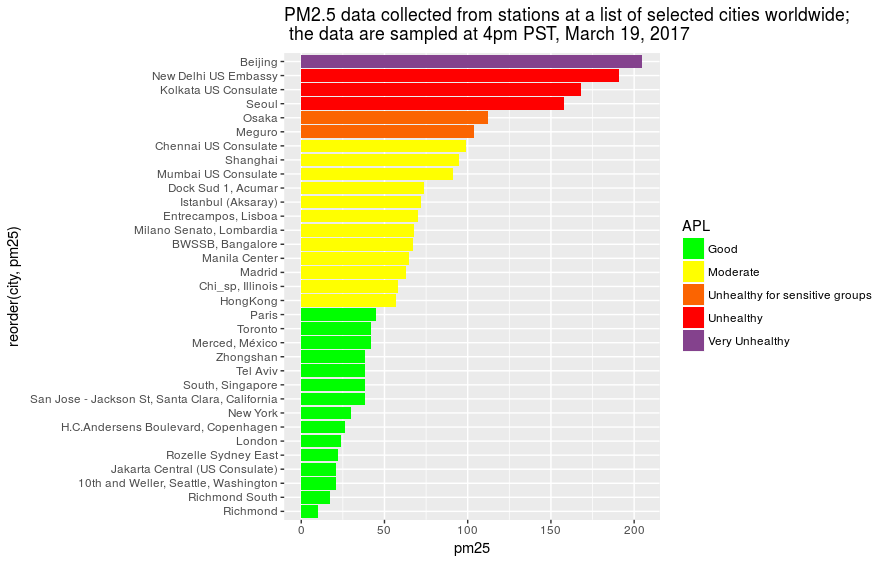
worlddat.rda: this contains PM2.5 data collected from a list of large cities worldwide usinggetPMatMajorWorldCities(). the data are collected at 4pm PST, March 19, 2017
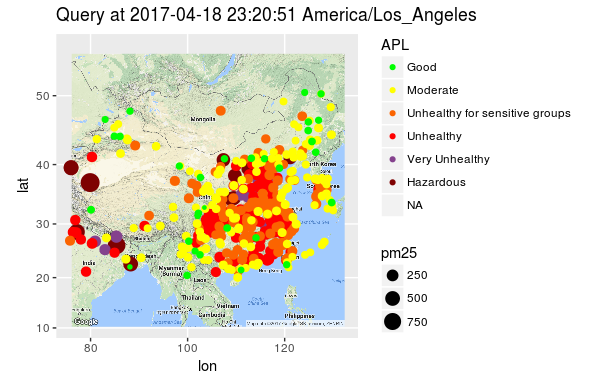
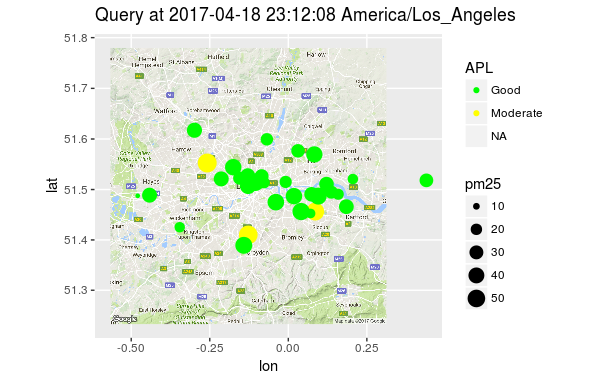
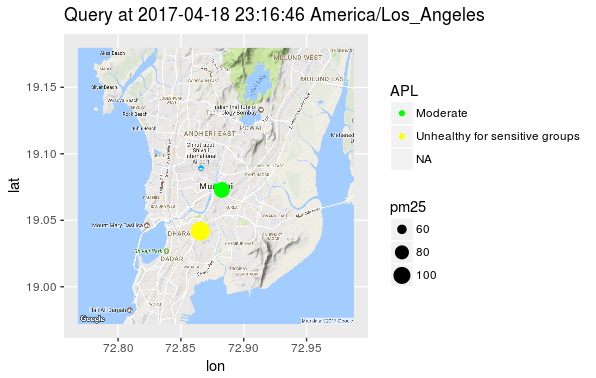
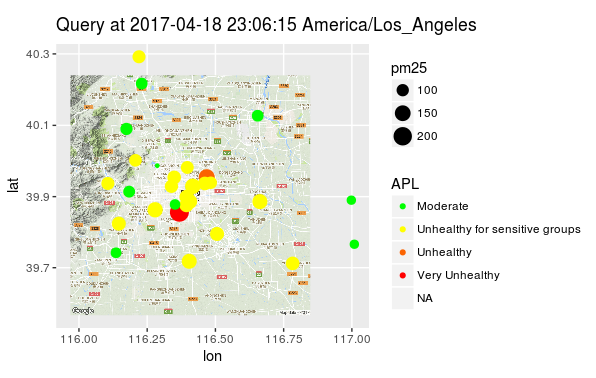
Some real-time PM2.5 data at different countries and cities
First of all, I would like to thank WAQ for making the data available. This package allows users to access real-time air pollute PM2.5 level in various ways: near the user, at any city, at any location, and/or in a region. Basic sorting and plot are implemented. The package was built using R studio with devtools and shared at github.
I plan to continue to maintain the package. Some future work can be: a) change to S6 or reference class, b) add more real-time air pollute parameters such O3, NO2, SO2, PM10 levels. that are available from WAQ server, c) add functions to save the data so that users can retrieve historical data.
