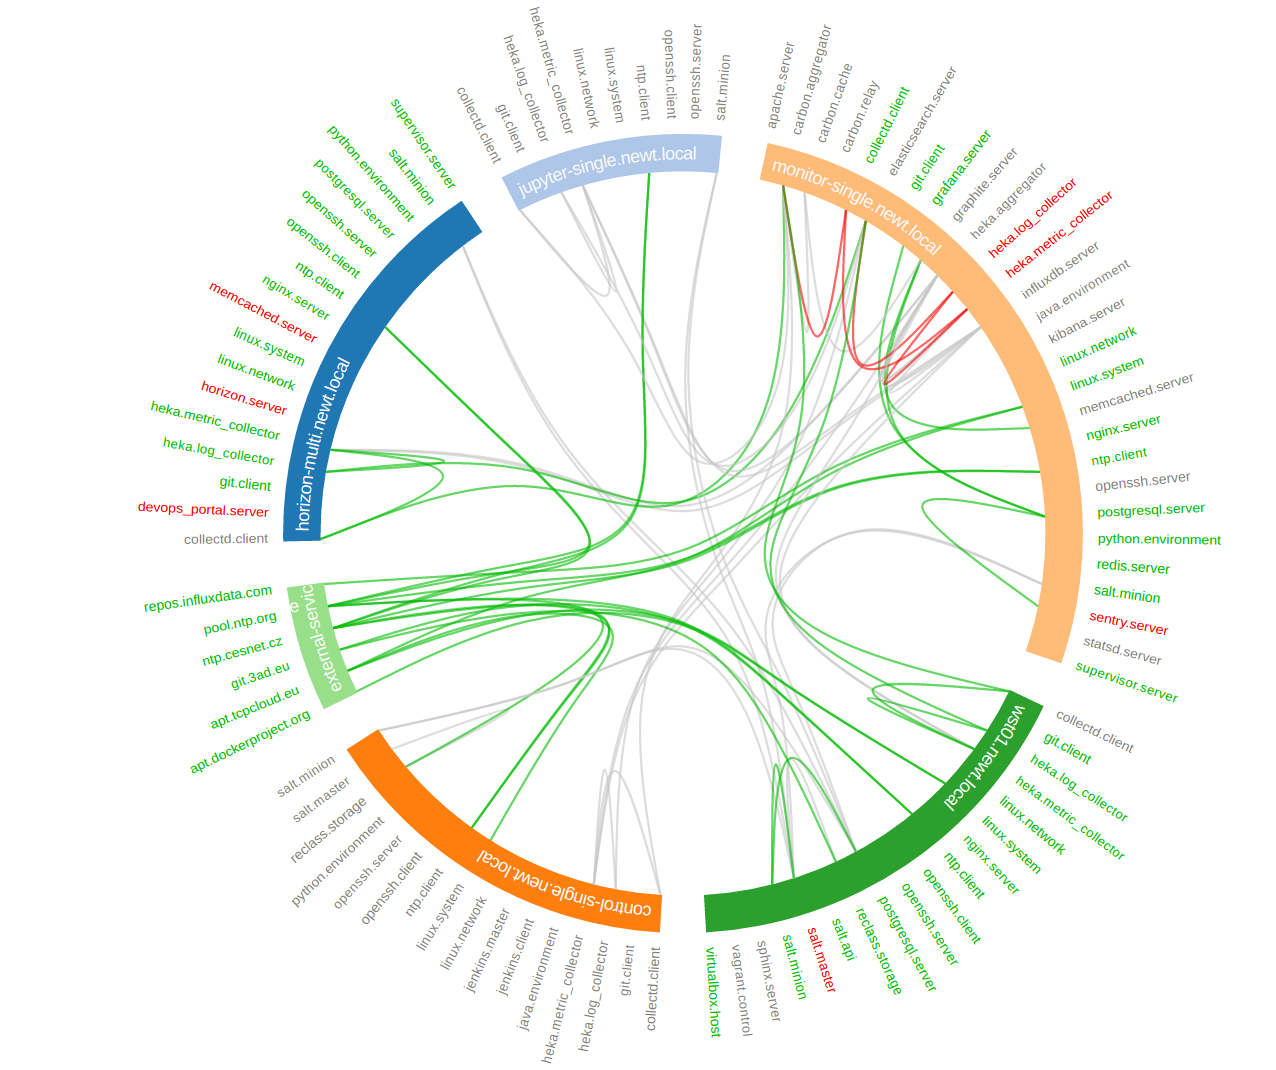
The aim of this project is to provide unified service modeling, management and visualization platform agnostic of delivery method. It creates virtual representations of any software services or physical resources and allows control over thier entire life-cycle. The name of project comes from Architect program in Matrix movie series:
In the Matrix the Architect is a highly specialized, humorless program of the machine world as well as the creator of the Matrix. As the chief administrator of the system, he is possibly a collective manifestation, or at the very least a virtual representation of the entire Machine mainframe.
The Architect service consists of several core compontents:
- Inventory Component
- Inventory is the Architect's metadata engine. It encapsulates and unifies data from various metadata sources to provide inventory/metadata for various orchestration services.
- Manager Component
- Manager is the Architect's orchestration engine. The aim of this module is to enforce infrastructure topologies models and acquire live infrastructure topology data from any resource provider for further relational and quantitative analysis and visualisations.
- Monitor Component
- The structure of infrastructure resources is directed graph that can be subject for further analysis. We can perform several transformation functions on this graph data in Monitor component.
A quick summary of integrations and capabilities of individual modules.
Inventory is the Architect's metadata engine. It encapsulates and unifies data from various metadata sources to provide inventory/metadata for various orchestration services. Currently supported metadata engines are:
- reclass (python3 version)
The following inventory providers are to be intergrated in near future.
- hiera
- saltstack
There is a plan to integrate workflow (multi-step forms) defitions to simplify creation of complex infrastructure models.
Manager is the Architect's orchestration engine. The aim of this module is to enforce infrastructure topologies models and acquire live infrastructure topology data from any resource provider for further relational and quantitative analysis and visualisations.
The pull approach for querying endpoint APIs is supported at the moment, the processing push from target services is supported for SaltStack events. Currently supported resource providers are:
- Kubernetes clusters
- OpenStack clouds
- Amazon web services
- SaltStack infrastructures
- Terraform templates
- Jenkins pipelines
The following resource providers are to be intergrated in near future.
- GCE and Azure clouds
- Cloudify TOSCA blueprints
- JUJU templates
The structure of infrastructure resources is directed graph that can be subject for further analysis. We can perform several transformation functions on this graph data in Monitor component.
Currently supported relational analysis visualizations:
- Adjacency Matrix
- Arc Diagram
- Force-directed Layouts
- Hierarchical Edge Bundling
- Hive Plot
- Node-link Trees (Reingold-Tilford, Dendrograms)
- Partition Layouts (Sunburst, Icicle Diagrams, Treemaps)
Following steps show how to deploy various components of the Architect service and connections to external services.
The core service responsible for handling HTTP API requests and providing simple UI based on Material design. Release version of architect-api is currently available on Pypi, to install it, simply execute:
pip install architect-apiTo bootstrap latest development version into local virtualenv, run following commands:
git clone git@github.com:cznewt/architect-api.git
cd architect-api
virtualenv venv
source venv/bin/activate
python setup.py install
You provide one configuration file for all service settings. The default
location is /etc/architect/api.yaml.
Following configuration for individual inventories/managers/models can be stored in config files or in the database.
Each manager endpoint expects different configuration. Following samples show the required parameters to setup individual invetory backends.
Following configuration points to the reclass inventory storage on local filesystem.
class_dir: /srv/salt/reclass/classes
node_dir: /srv/salt/reclass/nodes
storage_type: yaml_fs
filter_keys:
- _paramEach manager endpoint expects different configuration. Following samples show the required parameters to setup each endpoint type.
AWS manager uses boto3 high level AWS python SDK for accessing and
manipulating with AWS resources.
region: us-west-2
aws_access_key_id: {{ access_key_id }}
aws_secret_access_key: {{ secret_access_key }}
Kubernetes requires some information from kubeconfig file. You provide the
parameters of the cluster and the user to the manager. These can be found
under corresponding keys.
scope: global
cluster:
  certificate-authority-data: |
    {{ ca-for-server-and-clients }}
  server: https://{{ kubernetes-api }}:443
user:
  client-certificate-data: |
    {{ client-cert-public }}
  client-key-data: |
    {{ client-cert-private }}
Note
Options config.cluster and config.user can be found in your
kubeconfig file. Just copy the config fragment with cluster parameters
and fragment with user parameter.
Configuration for keystone v2.0 and keystone v3 clouds. Configuration
sample for single tenant access.
scope: local
region_name: RegionOne
compute_api_version: '2.1'
auth:
  username: {{ user-name }}
  password: {{ user-password }}
  project_name: {{ project-name }}
  domain_name: 'default'
  auth_url: https://{{ keystone-api }}:5000/v3
Config for managing resources of entire cloud, including hypervisors, tenants, etc in given region.
scope: global
region_name: RegionOne
auth:
  username: {{ admin-name }}
  password: {{ admin-password }}
  project_name: admin
auth_url: https://{{ keystone-api }}:5000/v2.0Configuration for manager connection to Salt API.
auth_url: http://{{ salt-api }}:8000
username: {{ user-name }}
password: {{ user-password }}Configuration for parsing Hashicorp Terraform templates.
dir: ~/terraform/{{ terraform-dir }}Following config snippets show configuration for supported types of visualization. Currently we support Network graphs, hierarchical structures for quatitative analysis.
The manager endpoint is used as source of relational data. The data can be sliced and diced as shown in the example.
name: Hive-plot
chart: hive
data_source:
  default:
    manager: openstack-project
    layout: graph
    filter_node_types:
    - os_server
    - os_key_pair
    - os_flavor
    - os_network
    - os_subnet
    - os_floating_ip
    - os_router
    filter_lone_nodes:
    - os_key_pair
- os_flavorThe manager endpoint is used as source of relational data. This data can be traversed to create hiearchies. The hierarchical data has it's own family of visualization techniques.
name: Tree Structure (cluster > namespace > pod > service)
height: 1
chart: tree
data_source:
  default:
    manager: k8s-demo
    layout: hierarchy
    hierarchy_layers:
      0:
        name: Kubernetes Root
        kind:
      1:
        kind: k8s_namespace
      2:
        kind: k8s_pod
        target: in_k8s_namespace
      3:
        kind: k8s_service
target: in_k8s_podManagers that do not expose any form of API can be controlled locally by using architect-adapter worker that wrap the local orchestration engine (Ansible, Cloudify, TerraForm).
To enable Salt Master inventory, you need to install http_architect Pillar
and Top modules and add following to the Salt Master configuration files.
http_architect: &http_architect
  project: local-salt
  host: architect.service.host
  port: 8181

ext_pillar:
  - http_architect: *http_architect

master_tops:
http_architect: *http_architectYou can control salt master infrasturctue and get the status of managed hosts
and resources. The Salt engine architect relays the state outpusts of
individual state runs and architect runners and modules provide the
capabilities to interface with salt and architect functions. The Salt Master
is managed through it's HTTP API service.
http_architect: &http_architect
  project: newt.work
  host: 127.0.0.1
port: 8181The most important part of the Architect is the analysis of the resource states provided by the managed/monitored systems.
You can analyse the resource models in several ways. Either you want to get the subsets of the resources (vertices and edges) or you want to combine multiple graphs and link the same nodes in each.
To slice and dice is to break a body of information down into smaller parts or to examine it from different viewpoints that we can understand it better.
In cooking, you can slice a vegetable or other food or you can dice it (which means to break it down into small cubes). One approach to dicing is to first slice and then cut the slices up into dices.
In data analysis, the term generally implies a systematic reduction of a body of data into smaller parts or views that will yield more information. The term is also used to mean the presentation of information in a variety of different and useful ways. In our case we find useful subgraphs of the infrastructures.
For example in OpenStack infrastructure we can show the aggregate zone -
hypervisor - instance relations and show the quantitative properties
of hypervisors and instances. The properties can be used RAM or CPU, runtime -
the age of resources or any other property of value.
name: Tree Structure (aggregate zone > hypervisor > instance)
height: 1
chart: tree
data_source:
  default:
    manager: openstack-region
    layout: hierarchy
    hierarchy_layers:
      0:
        name: Region1
        kind:
      1:
        kind: os_aggregate_zone
      2:
        kind: os_hypervisor
        target: in_os_aggregate_zone
      3:
        kind: os_server
        target: on_os_hypervisor
Another example would be filtering of resources by tenant or stack attributions. This reduces the number of nodes to the reasonable amount.
On other hand you want to combine several graphs to create one overlaying
graph. This is very useful to combine in other ways undelated resources. For
example we can say that OpenStack Server or AWS Instance and Salt
Minion are really the same resources.
With the relational information we are now able to corellate resources and joined topologies from varius information sources. This gives you the real power, while having the underlying relational structure, you can gather unstructured metrics, events, alarms and put them into proper context in you managed resources.
The metrics collected from you infrastrucute can be assigned to various vertices and edges in your network. This can give you more insight to the utilisation of depicted infrastructures.
You can have the following query to the prometheus server that gives you the rate of error response codes goint through a HAproxy for example.
sum(irate(haproxy_http_response_5xx{
    proxy=~"glance.*",
    sv="FRONTEND"
}[5m]))
Or you can have the query with the same result to the InfluxDB server:
SELECT sum("count")
    FROM "openstack_glance_http_response_times"
    WHERE "hostname" =~ /$server/
        AND "http_status" = '5xx'
        AND $timeFilter
    GROUP BY time($interval)
fill(0)
Having these metrics you can assign numerical properties of your relational nodes with these values and use them in correct context.
Different data require different diagram visualization. Diagrams are symbolic representation of information according to some visualization technique. Every time you need to emphasise different qualities of displayed resources you can choose from several layouts to display the data.
For most of the cases we will be dealing with network data that do not have any single root or beginning.
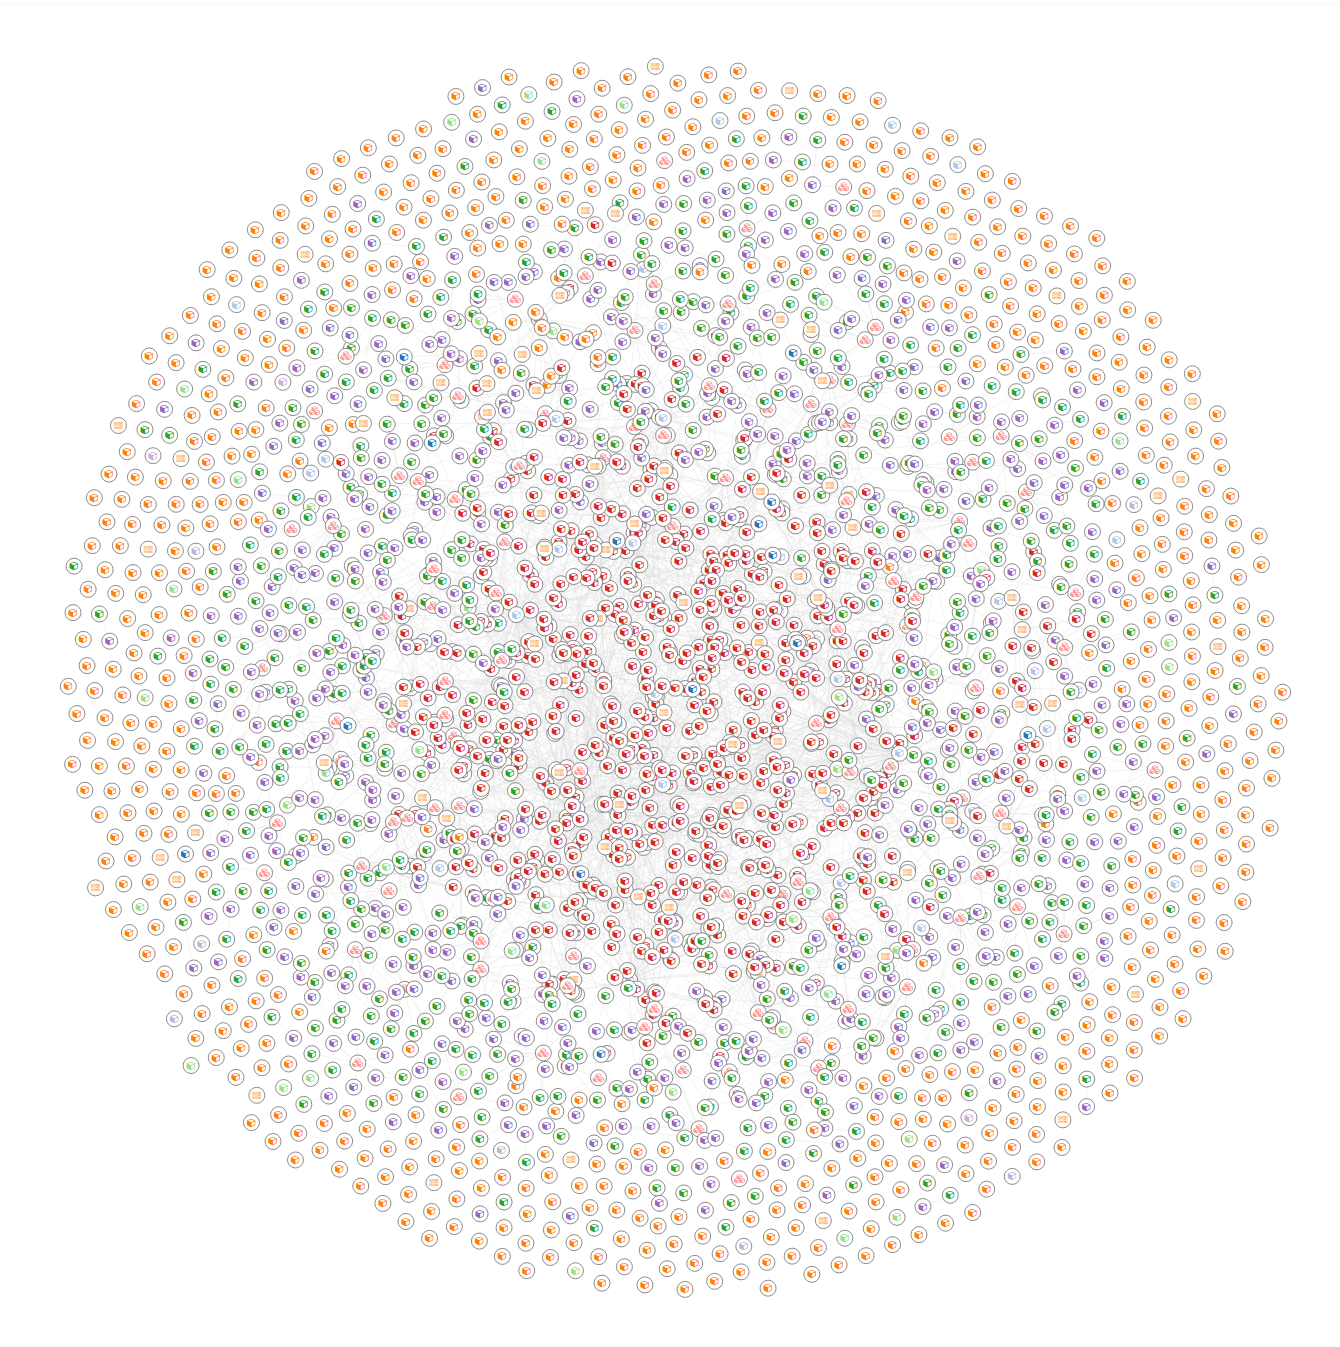
Force-directed graph drawing algorithms are used for drawing graphs in an aesthetically pleasing way. Their purpose is to position the nodes of a graph in two-dimensional or three-dimensional space so that all the edges are of more or less equal length and there are as few crossing edges as possible, by assigning forces among the set of edges and the set of nodes, based on their relative positions, and then using these forces either to simulate the motion of the edges and nodes or to minimize their energy.
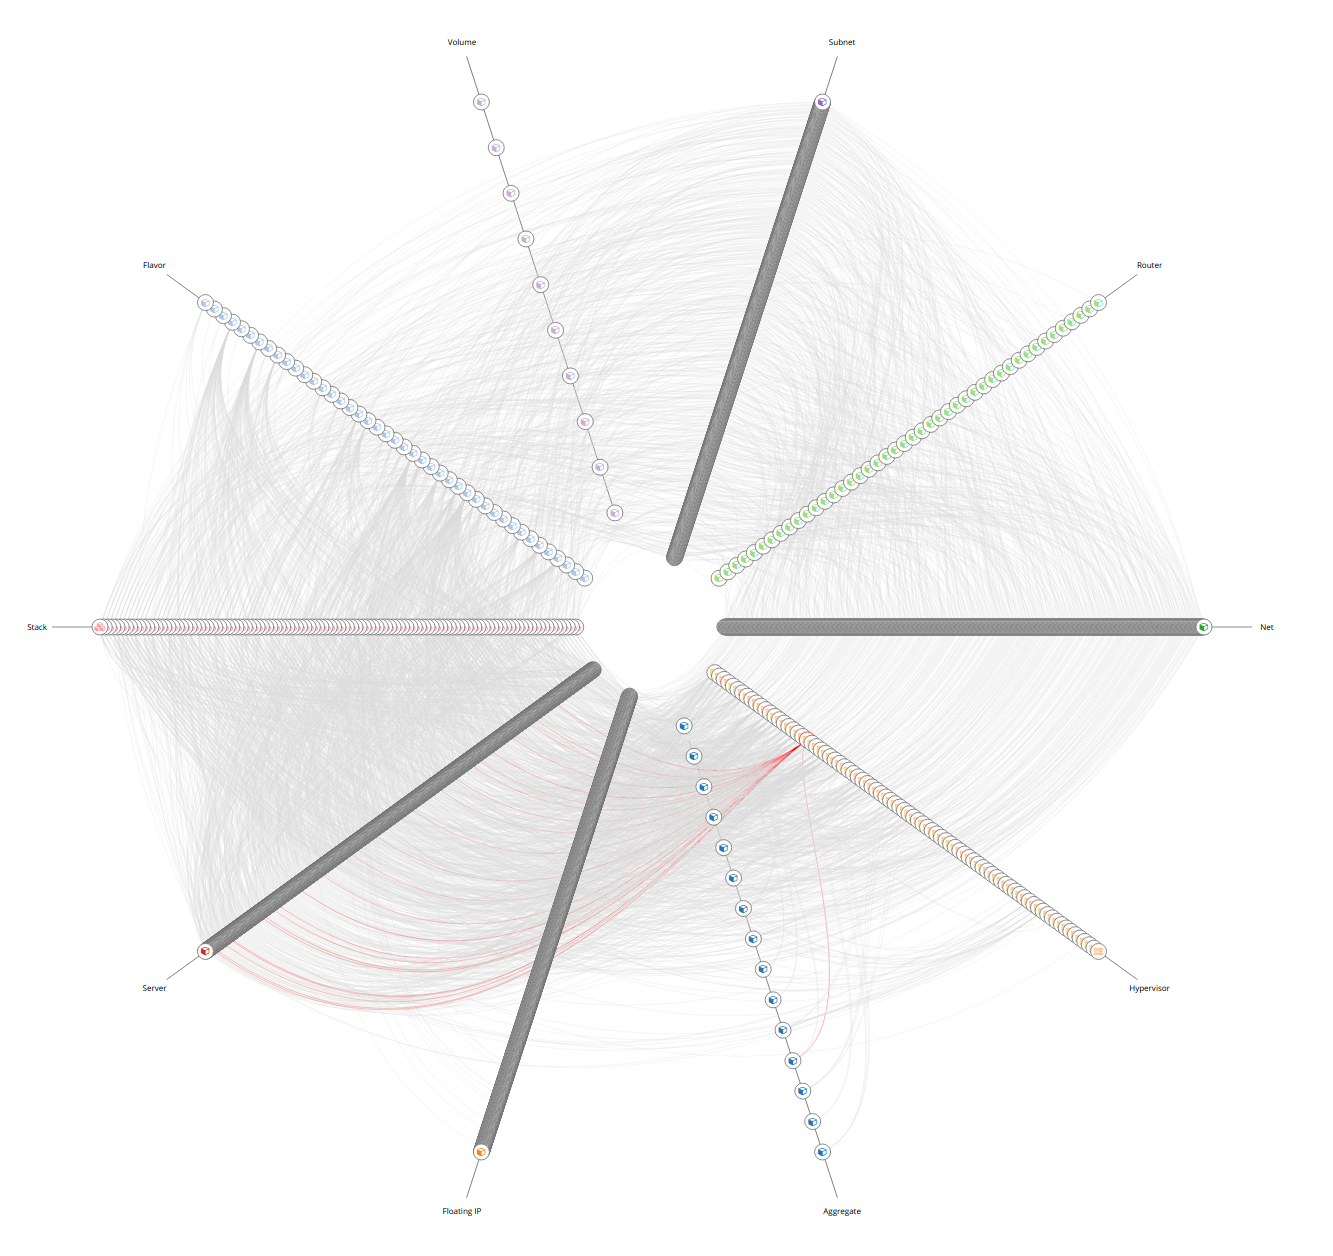
The hive plot is a visualization method for drawing networks. Nodes are mapped to and positioned on radially distributed linear axes — this mapping is based on network structural properties. Edges are drawn as curved links. Simple and interpretable.
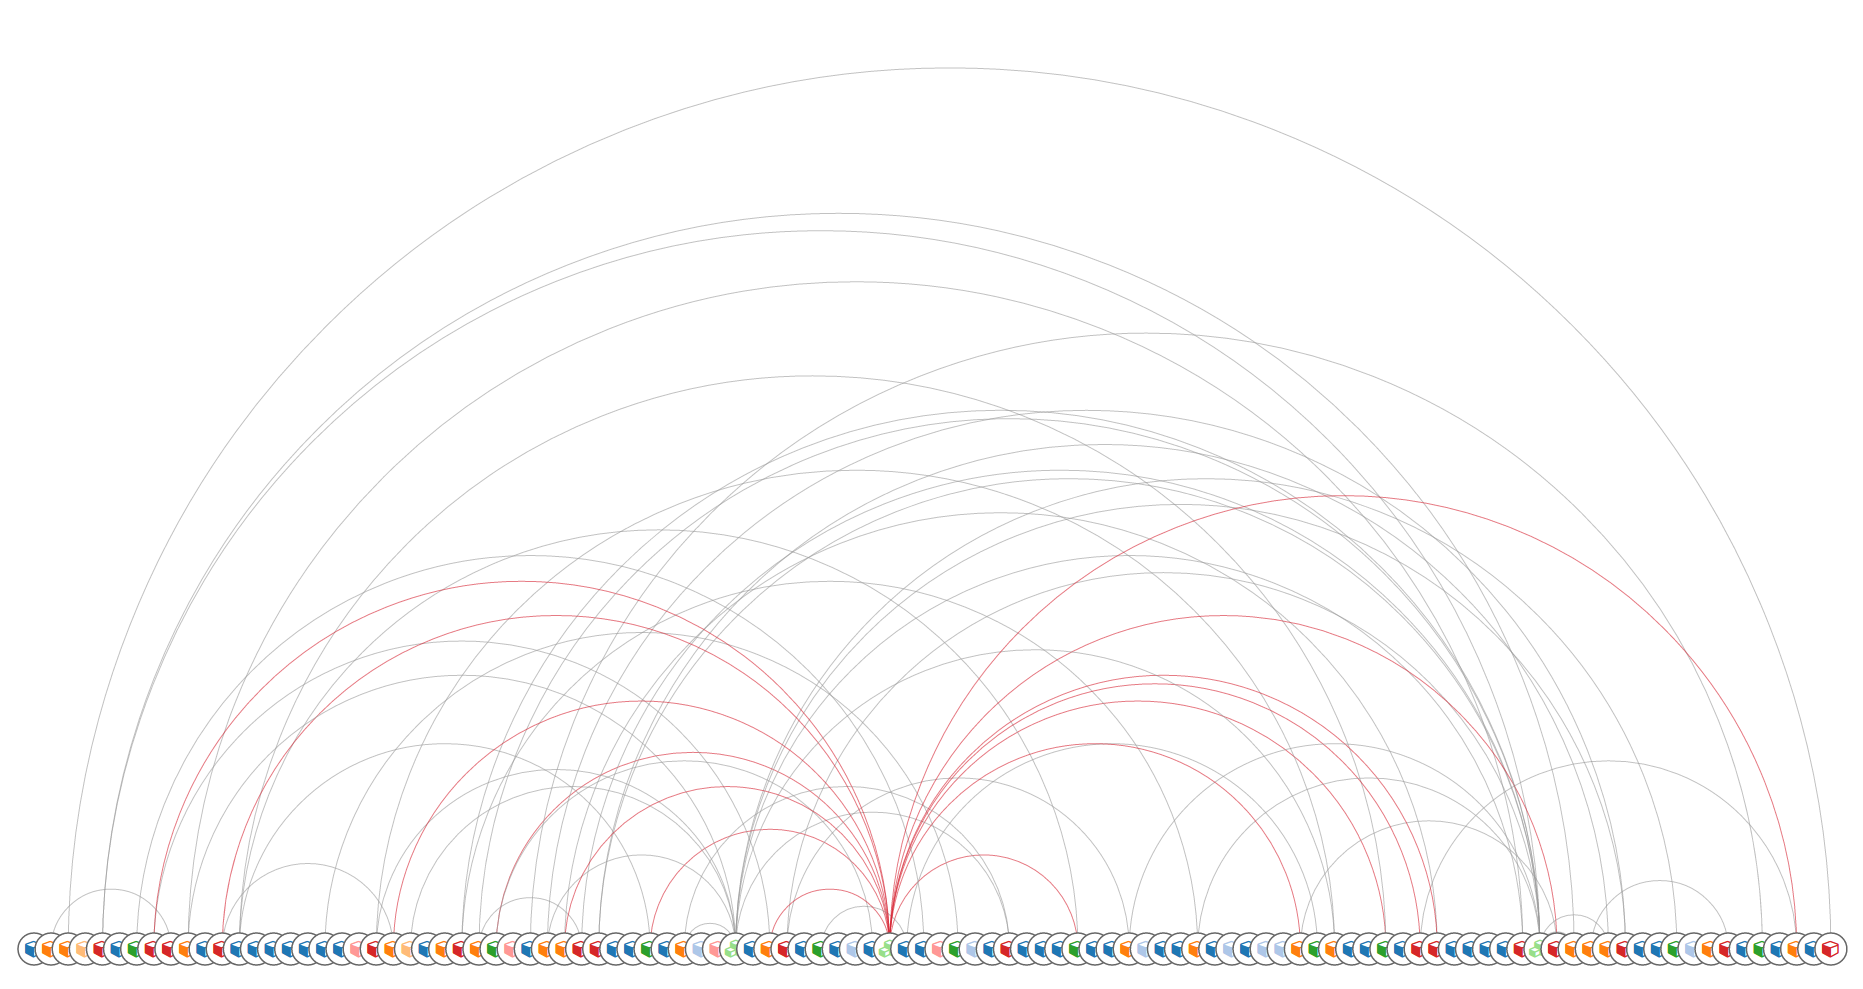
An arc diagram is a style of graph drawing, in which the vertices of a graph are placed along a line in the Euclidean plane, with edges being drawn as semicircles in one of the two halfplanes bounded by the line, or as smooth curves formed by sequences of semicircles. In some cases, line segments of the line itself are also allowed as edges, as long as they connect only vertices that are consecutive along the line.
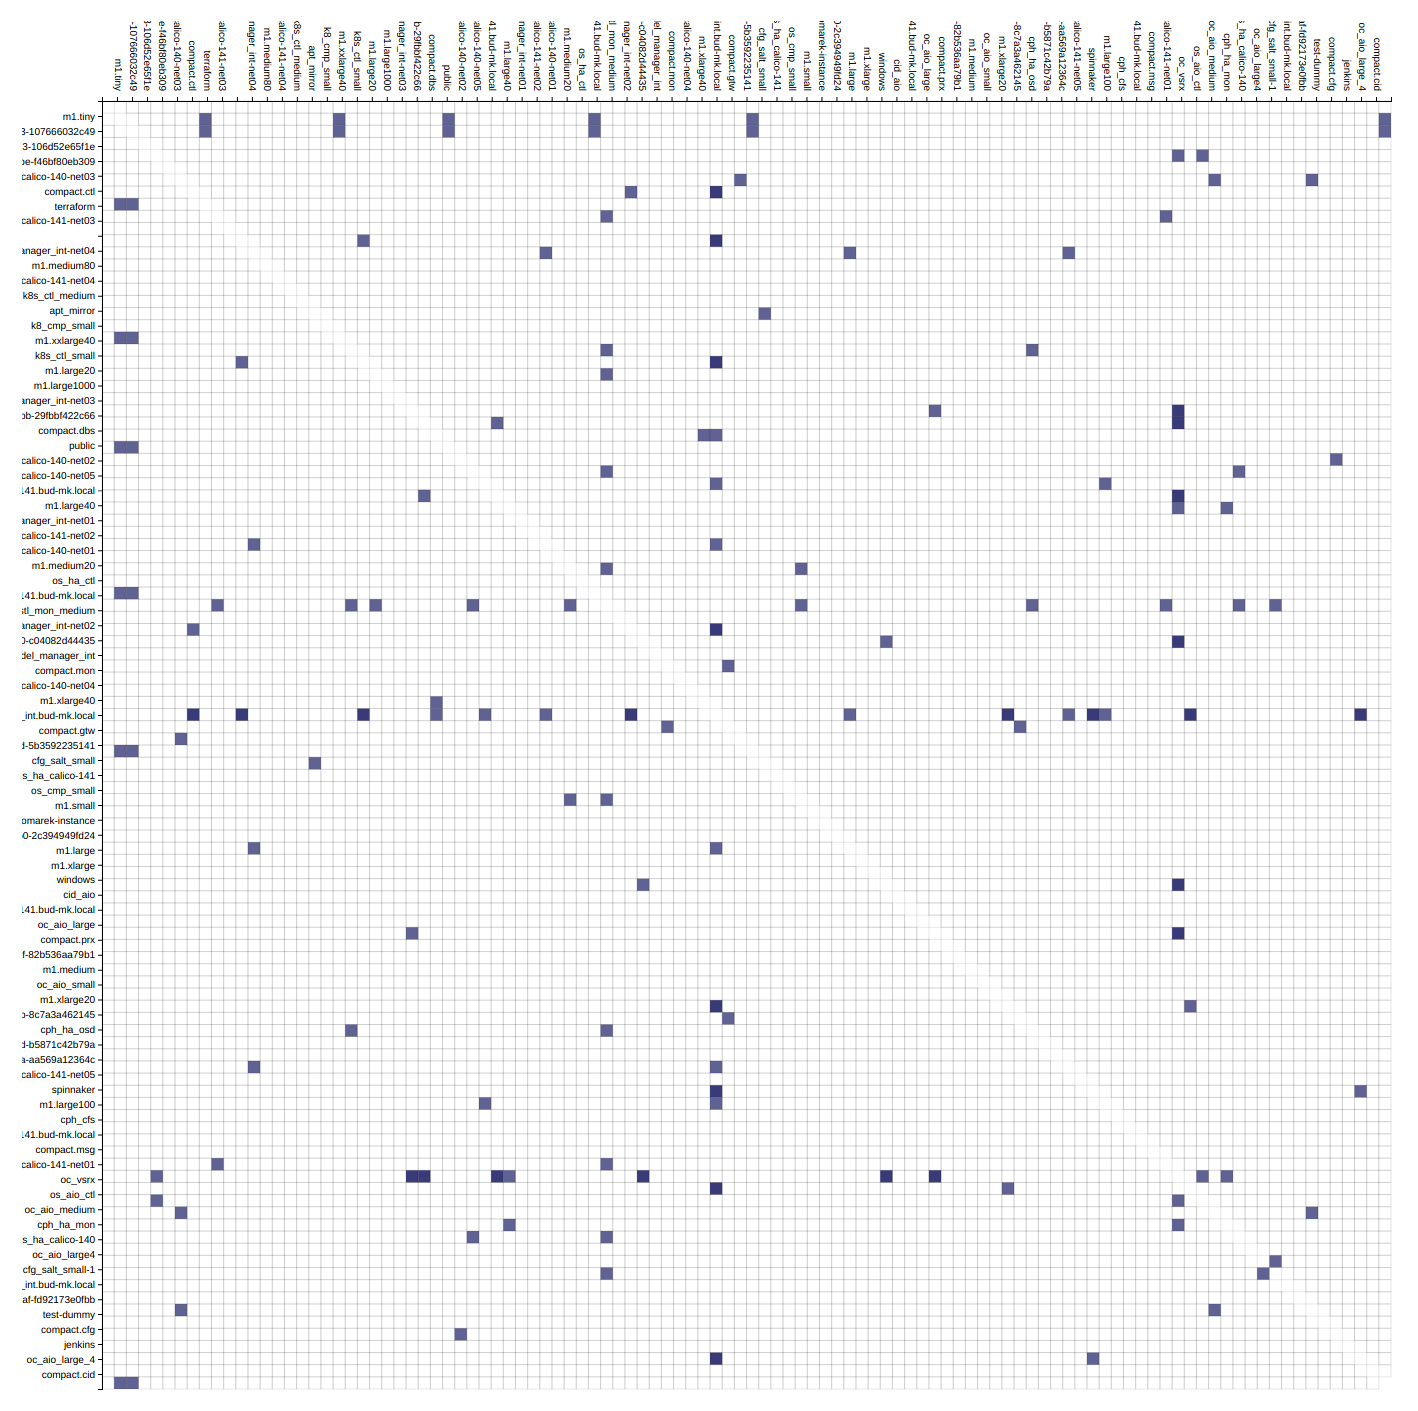
An adjacency matrix is a square matrix used to represent a finite graph. The elements of the matrix indicate whether pairs of vertices are adjacent or not in the graph.
Danny Holten presents an aesthetically pleasing way of simplifying graphs and making tree graphs more accessible. What makes his project so useful, however, is how he outlines the particular thought process that goes into making a visualization.
Directed graph traversal can give os acyclic structures suitable for showing parent-child relations in your subraphs.
