Please fill out:
- Student name: James M. Irving
- Student pace: full time
- Scheduled project review date/time: 03/08/19 at 12pm
- Instructor name: Jeff Herman
- Blog post URL: https://jirvingphd.github.io/harnessing_seaborn_subplots_for_eda
- Final Project Submission
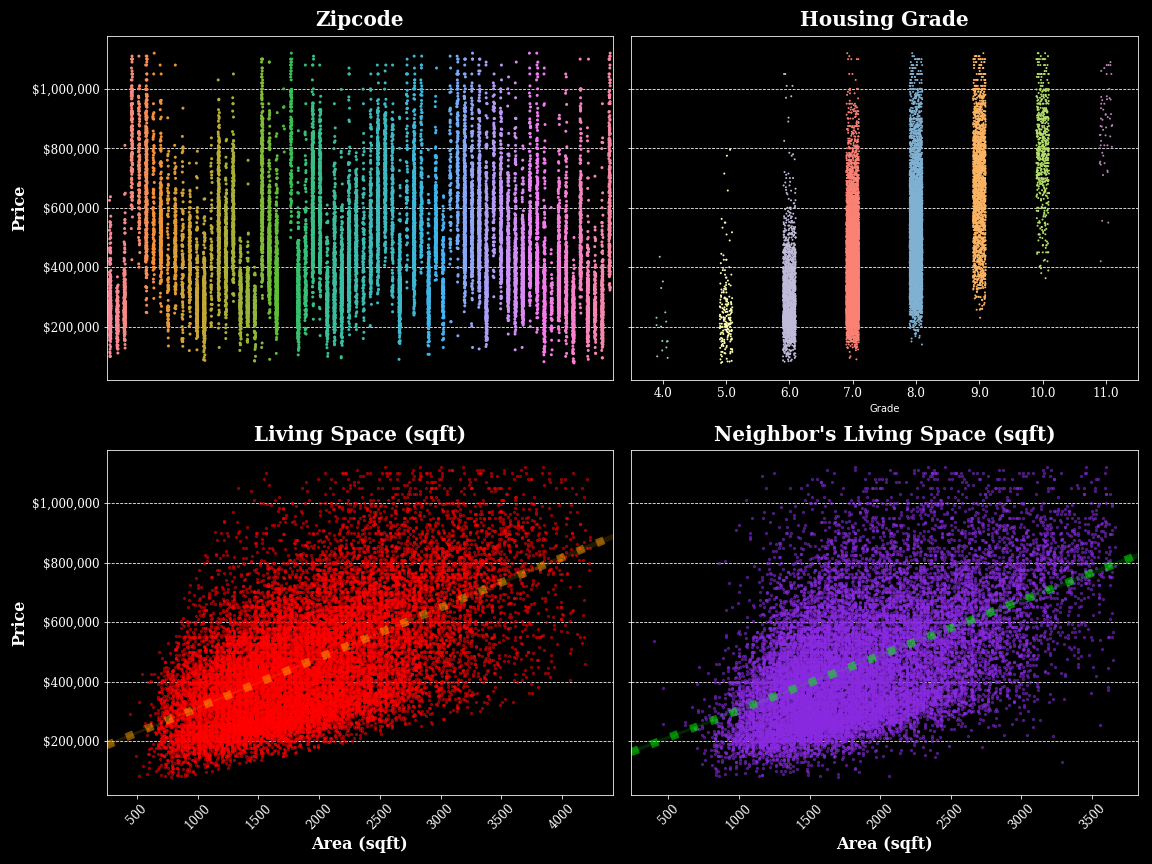
- FINAL SUMMARY FIGURES FROM PRESENTATION
- Outline of Data Processing and Analysis(using OSEMN model)
- OBTAIN:
- SCRUB:
- Fill in null values and recast variables for EDA
- Question 1: Which predictors should be analyzed as continuous data, vs binned/categorical data?
- COARSE-BINNING Numerical Data
- CHECKING FOR MULTICOLLINEARITY
- EXPLORE:
- [SCRUB-2] NORMALIZING & TRANSFORMING
- CHECKING NORMALIZED DATASET
- FITTING AN INTIAL MODEL:
- DETERMINING IDEAL FEATURES TO USE
- PRELIMINARY UNIVARIATE LINEAR REGRESSION MODELING
- MULTIVARIATE REGRESSIONS
- Cross-Validation with K-Fold Test-Train Splits:
- FINAL REGRESSION RESULTS
- FINAL MODEL - New
- SUMMARY FIGURE CODE FOR PRESENTATION
- END OF PROJECT 1 RE-SUBMISSION
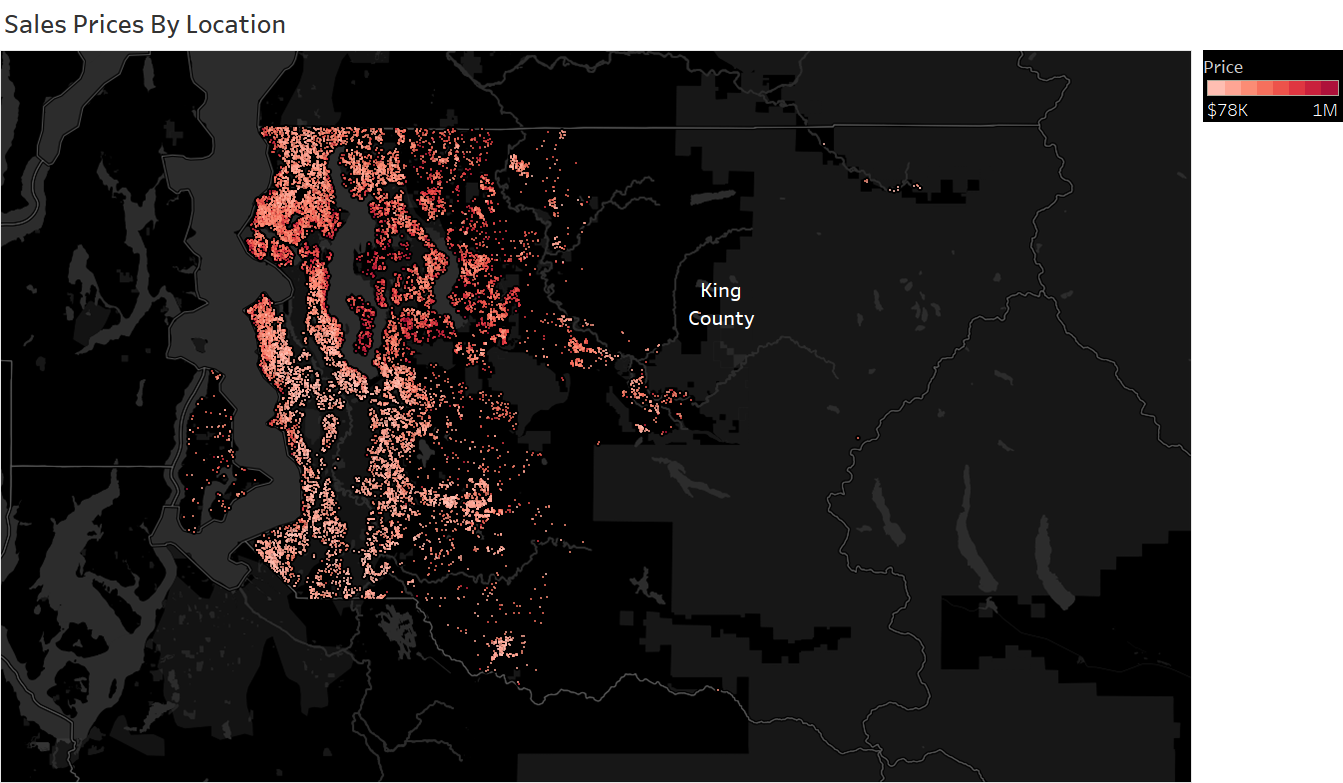
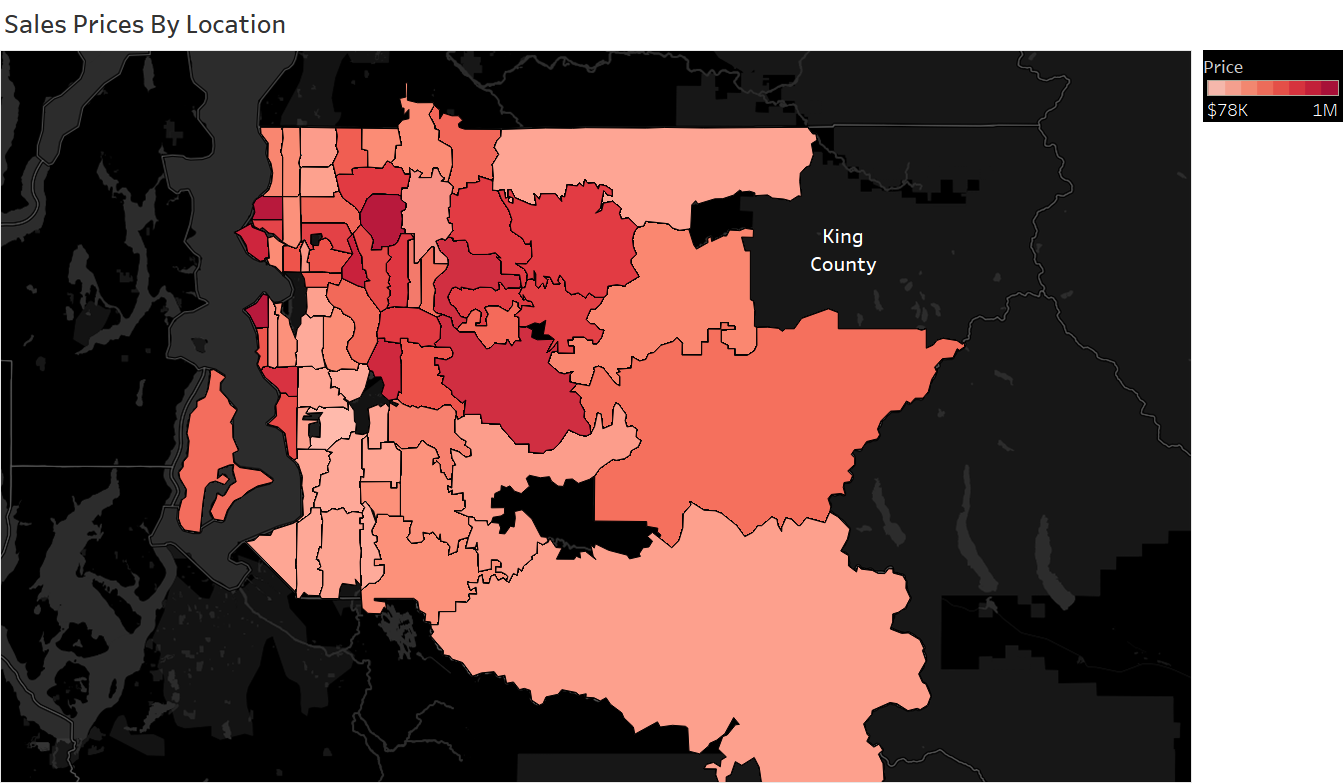
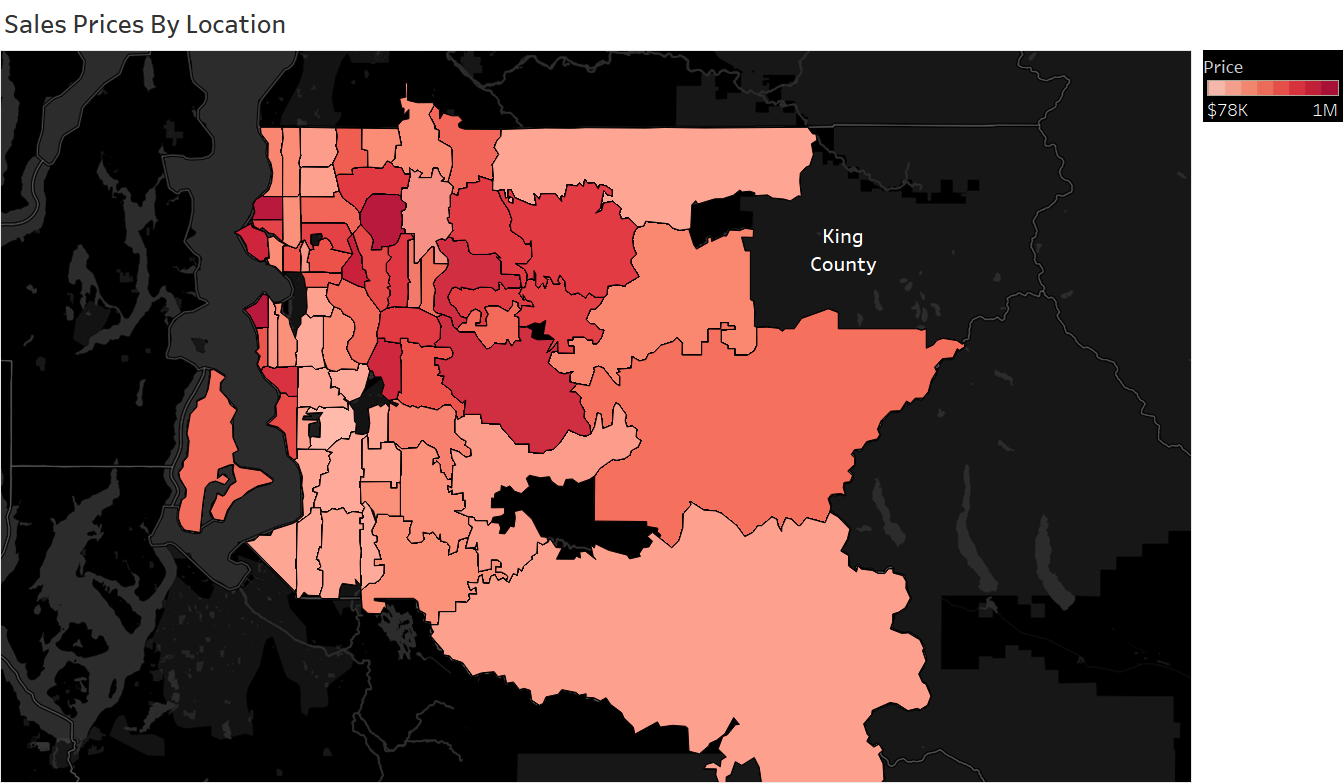
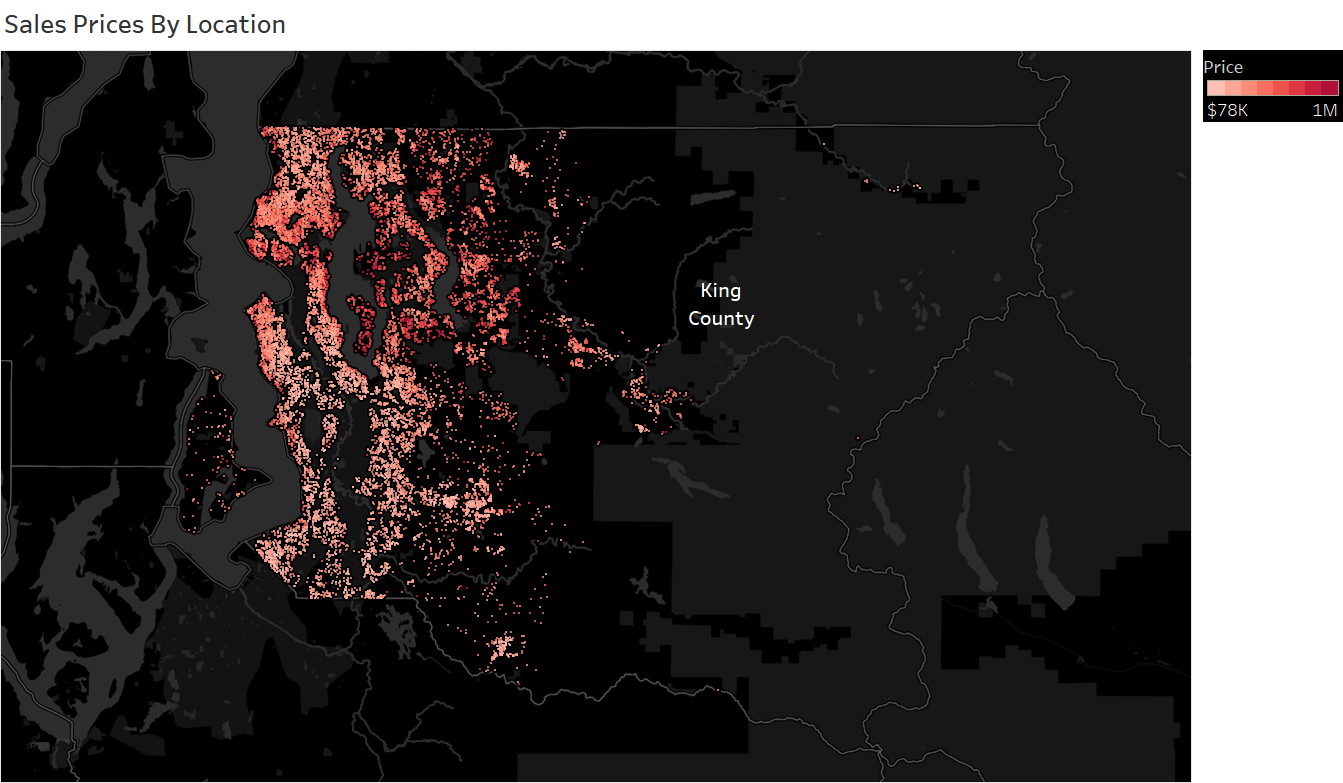
HOW TO: Tableau Maps were from final .csv loaded into Tableau Public and can be viewed and downloaded from https://public.tableau.com/profile/james.irving#!/
- Load in your .csv dataset from your project.
- Let it use data interpreter. It should identify zipcode as a location.
- On your worksheet page:
- For plotting each price for each house:
- Drag the Measures Lat and Long onto the rows and columns boxes (top of sheet)
- Drag the Measure price onto the Color Button under Marks.
It should now be listed at the bottom of the Marks panel. - Right-click and select "Dimension"
- For plotting median income by zipcode:
- Drag zipcode form the Dimensions panel onto the main graph window.
- It will automatically load in map of location.
- Drag price onto the color button (it will now appear in the Marks window)
- Rich click on Price. Select "Measure" > Median
- Drag zipcode form the Dimensions panel onto the main graph window.
- Customize map features by selecting "Map" > Map Layers on the Menu Bar.
- For plotting each price for each house:
-
OBTAIN: Import data, inspect, check for datatypes to convert and null values
- Display header and info
- Drop any unneeded columns (df.drop(['col1','col2'],axis=1)
-
SCRUB: cast data types, identify outliers, check for multicollinearity, normalize data
- Check and cast data types
- Check for #'s that are store as objects (df.info())
- when converting to #'s, look for odd values (like many 0's), or strings that can't be converted
- Decide how to deal weird/null values (df.unique(), df.isna().sum(), df.describe()-min/max, etc
- Check for categorical variables stored as integers
- Check for #'s that are store as objects (df.info())
- Check for missing values (df.isna().sum())
- Can drop rows or colums
- For missing numeric data with median or bin/convert to categorical
- For missing categorical data: make NaN own category OR replace with most common category
- Check for multicollinearity
- use seaborn to make correlation matrix plot Evernote Link
- Good rule of thumb is anything over 0.75 corr is high, remove the variable that has the most correl with the largest # of variables
- Normalize data (may want to do after some exploring)
- Most popular is Z-scoring (but won't fix skew)
- Can log-transform to fix skewed data
- Check and cast data types
-
EXPLORE:Check distributions, outliers, etc
- Check scales, ranges (df.describe())
- Check histograms to get an idea of distributions (df.hist()) and dat transformations to perform
- Can also do kernel density estimates
- Use scatterplots to check for linearity and possible categorical variables (df.plot(kind-'scatter')
- categoricals will look like vertical lines
- Use pd.plotting.scatter_matrix to visualize possible relationships
- Check for linearity
-
FIT AN INITIAL MODEL:
- Various forms, detail later...
- Assessing the model:
- Assess parameters (slope,intercept)
- Check if the model explains the variation in the data (RMSE, F, R_square)
- Are the coeffs, slopes, intercepts in appropriate units?
- Whats the impact of collinearity? Can we ignore?
-
Revise the fitted model
- Multicollinearity is big issue for lin regression and cannot fully remove it
- Use the predictive ability of model to test it (like R2 and RMSE)
- Check for missed non-linearity
-
Holdout validation / Train/test split
- use sklearn train_test_split
- Import required packages, read in dataframe, and definefunctions
from _functions_jirving import *
df = pd.read_csv('kc_house_data.csv')
# Set index, create dataframe for dropped variables with id as index for both
# df.set_index=('id')
drop_me =['id','lat','long','date']
df_dropped = df[drop_me].copy()
df_dropped.set_index('id')
df.drop(drop_me,axis=1,inplace=True)- The below cell determines the output filepaths and should not be altered unless you intend to change those locations
folder = %pwd
fig_filepath = folder+'/Figures/'
data_filepath = folder+'/Data/'df.indexRangeIndex(start=0, stop=21597, step=1)
df.head().dataframe tbody tr th {
vertical-align: top;
}
.dataframe thead th {
text-align: right;
}
| price | bedrooms | bathrooms | sqft_living | sqft_lot | floors | waterfront | view | condition | grade | sqft_above | sqft_basement | yr_built | yr_renovated | zipcode | sqft_living15 | sqft_lot15 | |
|---|---|---|---|---|---|---|---|---|---|---|---|---|---|---|---|---|---|
| 0 | 221900.0 | 3 | 1.00 | 1180 | 5650 | 1.0 | NaN | 0.0 | 3 | 7 | 1180 | 0.0 | 1955 | 0.0 | 98178 | 1340 | 5650 |
| 1 | 538000.0 | 3 | 2.25 | 2570 | 7242 | 2.0 | 0.0 | 0.0 | 3 | 7 | 2170 | 400.0 | 1951 | 1991.0 | 98125 | 1690 | 7639 |
| 2 | 180000.0 | 2 | 1.00 | 770 | 10000 | 1.0 | 0.0 | 0.0 | 3 | 6 | 770 | 0.0 | 1933 | NaN | 98028 | 2720 | 8062 |
| 3 | 604000.0 | 4 | 3.00 | 1960 | 5000 | 1.0 | 0.0 | 0.0 | 5 | 7 | 1050 | 910.0 | 1965 | 0.0 | 98136 | 1360 | 5000 |
| 4 | 510000.0 | 3 | 2.00 | 1680 | 8080 | 1.0 | 0.0 | 0.0 | 3 | 8 | 1680 | 0.0 | 1987 | 0.0 | 98074 | 1800 | 7503 |
# Display DataFrame Infro
df.info()
<class 'pandas.core.frame.DataFrame'>
RangeIndex: 21597 entries, 0 to 21596
Data columns (total 17 columns):
price 21597 non-null float64
bedrooms 21597 non-null int64
bathrooms 21597 non-null float64
sqft_living 21597 non-null int64
sqft_lot 21597 non-null int64
floors 21597 non-null float64
waterfront 19221 non-null float64
view 21534 non-null float64
condition 21597 non-null int64
grade 21597 non-null int64
sqft_above 21597 non-null int64
sqft_basement 21597 non-null object
yr_built 21597 non-null int64
yr_renovated 17755 non-null float64
zipcode 21597 non-null int64
sqft_living15 21597 non-null int64
sqft_lot15 21597 non-null int64
dtypes: float64(6), int64(10), object(1)
memory usage: 2.8+ MB
# Check for columns with null values (remember strings/objects are not counted here)
res = df.isna().sum()
print(res[res>0],'\nTotal:',len(df))
# Waterfront, view, yr_renovated have missing values
waterfront 2376
view 63
yr_renovated 3842
dtype: int64
Total: 21597
- From examining the df.info and df.isna().sum(), there is 1 numerical data column that is currently text/object data type.
- I will address these first since they would be excluded from preliminary visualizations.
- There are also null values to address in waterfront, view, and yr_renovated
- The Date column will be recast as datetime
# Recast zipcode as a category
df['zipcode'] = df['zipcode'].astype('category')# RECASTING SQFT_BASEMENT
# Checking why sqft_basement might be an object:
# df['sqft_basement'].value_counts().nlargest(10)
check_column(df['sqft_basement'],10)Column: df['sqft_basement']':
dtype: object
isna: 0 out of 21597 - 0.0%
Unique non-na values:
0.0 12826
? 454
600.0 217
500.0 209
700.0 208
800.0 201
400.0 184
1000.0 148
900.0 142
300.0 142
Name: sqft_basement, dtype: int64
- sqft_basement is current an object, needs to be converted to int
- Need to
replacedrop the 454 '?' values - There are a lot of 0's, for sqft_basement. Not sure if I should keep them in the dataset. I am for now.
- Note: I originally replaced the ?'s with 0's, but am re-running the dataset with them dropped altogether.
- Need to
# Removing rows with ? for sqft_basement and converting to float
print(len(df))
df['sqft_basement'].replace(to_replace = '?',value=np.nan,inplace=True) #,inplace=True)
df.dropna(axis=0,subset=['sqft_basement'],inplace=True)
df['sqft_basement'] = df['sqft_basement'].astype('float')
df['sqft_basement'].isna().sum()
check_column(df['sqft_basement'],10)
21597
Column: df['sqft_basement']':
dtype: float64
isna: 0 out of 21143 - 0.0%
Unique non-na values:
0.0 12826
600.0 217
500.0 209
700.0 208
800.0 201
400.0 184
1000.0 148
900.0 142
300.0 142
200.0 105
Name: sqft_basement, dtype: int64
Replace the 61 null values with appropriate value for data type- Drop the 61 view null values
# Check for columns with null values (remember strings/objects are not counted here)
res = df.isna().sum()
print(res[res>0])
# Waterfront, view, yr_renovated have missing values
waterfront 2339
view 61
yr_renovated 3754
dtype: int64
check_column(df['view'])Column: df['view']':
dtype: float64
isna: 61 out of 21143 - 0.289%
Unique non-na values:
0.0 19018
2.0 930
3.0 496
1.0 327
4.0 311
Name: view, dtype: int64
# Drop null values from view and re-check column
print(len(df))
df.dropna(axis=0,subset=['view'],inplace=True)
print(len(df))
check_column(df['view'])
21143
21082
Column: df['view']':
dtype: float64
isna: 0 out of 21082 - 0.0%
Unique non-na values:
0.0 19018
2.0 930
3.0 496
1.0 327
4.0 311
Name: view, dtype: int64
# Convert view to category and create a coded version called code_view
df['view'] = df['view'].astype('category')
df['code_view'] = df.view.cat.codes
df['code_view'].value_counts()
0 19018
2 930
3 496
1 327
4 311
Name: code_view, dtype: int64
# Drop drop_me variable from main df, save in df_dropped
drop_me = 'view'
df_dropped[drop_me] = df[drop_me].copy()
df.drop(drop_me,axis=1,inplace=True)- Recast as
intstring - Waterfront has 2339 null values to
replace.make into unordered and coded into "NaN" category- Note this is string "NaN" not np.nan
check_column(df['waterfront'])Column: df['waterfront']':
dtype: float64
isna: 2333 out of 21082 - 11.066%
Unique non-na values:
0.0 18608
1.0 141
Name: waterfront, dtype: int64
# Convert waterfront to category, replace null values with "NaN"' string to make it a category
df['waterfront'] = df['waterfront'].astype('category')
df['waterfront'].replace(np.nan,"NaN",inplace=True)
df['waterfront'] = df['waterfront'].astype('category')
# df['waterfront'].value_counts()
check_column(df['waterfront'],10)Column: df['waterfront']':
dtype: category
isna: 0 out of 21082 - 0.0%
Unique non-na values:
0.0 18608
NaN 2333
1.0 141
Name: waterfront, dtype: int64
# Turn waterfront into coded column
df['code_waterfront'] = df.waterfront.cat.codes
check_column(df['code_waterfront'])
Column: df['code_waterfront']':
dtype: int8
isna: 0 out of 21082 - 0.0%
Unique non-na values:
0 18608
2 2333
1 141
Name: code_waterfront, dtype: int64
# Drop drop_me variable from main df, save in df_dropped
drop_me = 'waterfront'
df_dropped[drop_me] = df[drop_me].copy()
df.drop(drop_me,axis=1,inplace=True)- yr_renovated has 3754 null values
- Presumably this is because the homes were never renovated
Will replace with 0.0- Replace all 0.0's with NaN
- Replacing yr_renovated with binary category based on it if has been renovated or not
- Make new column 'is_reno'
check_column(df['yr_renovated'],10)Column: df['yr_renovated']':
dtype: float64
isna: 3742 out of 21082 - 17.75%
Unique non-na values:
0.0 16618
2014.0 69
2003.0 31
2013.0 31
2007.0 30
2000.0 29
2005.0 29
1990.0 22
2009.0 21
2004.0 21
Name: yr_renovated, dtype: int64
# Fill in 0.0 yr_renovated as np.nan temporarily
df['yr_renovated'].replace(0.0,np.nan,inplace=True)

# Recheck for null values
check_column(df['yr_renovated'],10) #df.isna().sum()
Column: df['yr_renovated']':
dtype: float64
isna: 20360 out of 21082 - 96.575%
Unique non-na values:
2014.0 69
2013.0 31
2003.0 31
2007.0 30
2000.0 29
2005.0 29
1990.0 22
2009.0 21
2004.0 21
2006.0 20
Name: yr_renovated, dtype: int64
# Get indices of all np.nan values to be used for is_reno category below
idx_nan = df['yr_renovated'].loc[df['yr_renovated'].isna()].index
idx_notnan = df['yr_renovated'].loc[~df['yr_renovated'].isna()].index

# Make df['is_reno']
df['is_reno'] = df['yr_renovated'].copy
df['is_reno'][idx_nan] = 0
df['is_reno'][idx_notnan] = 1

check_column(df['is_reno'],10)
Column: df['is_reno']':
dtype: int64
isna: 0 out of 21082 - 0.0%
Unique non-na values:
0 20360
1 722
Name: is_reno, dtype: int64
//anaconda3/envs/learn-env/lib/python3.6/site-packages/ipykernel_launcher.py:7: SettingWithCopyWarning:
A value is trying to be set on a copy of a slice from a DataFrame
See the caveats in the documentation: http://pandas.pydata.org/pandas-docs/stable/user_guide/indexing.html#returning-a-view-versus-a-copy
import sys
//anaconda3/envs/learn-env/lib/python3.6/site-packages/ipykernel_launcher.py:8: SettingWithCopyWarning:
A value is trying to be set on a copy of a slice from a DataFrame
See the caveats in the documentation: http://pandas.pydata.org/pandas-docs/stable/user_guide/indexing.html#returning-a-view-versus-a-copy
# Drop drop_me variable from main df, save in df_dropped
drop_me = 'yr_renovated'
df_dropped[drop_me] = df[drop_me].copy()
df.drop(drop_me,axis=1,inplace=True)-
Removed null values by dropping na from sqft_basement and view.
-
Converted waterfront to category and made NaN its own separate category (since there were so many null vlaues)
-
Converted yr_renovated to is_reno simple 0 or 1 value
-
Recase zipcodes as category since there is no numerical relationship between zipcode values
-
Next to inspect distributions and scatterplots to identify which numerical columns may be better analyzed as categories
df.info()<class 'pandas.core.frame.DataFrame'>
Int64Index: 21082 entries, 0 to 21596
Data columns (total 17 columns):
price 21082 non-null float64
bedrooms 21082 non-null int64
bathrooms 21082 non-null float64
sqft_living 21082 non-null int64
sqft_lot 21082 non-null int64
floors 21082 non-null float64
condition 21082 non-null int64
grade 21082 non-null int64
sqft_above 21082 non-null int64
sqft_basement 21082 non-null float64
yr_built 21082 non-null int64
zipcode 21082 non-null category
sqft_living15 21082 non-null int64
sqft_lot15 21082 non-null int64
code_view 21082 non-null int8
code_waterfront 21082 non-null int8
is_reno 21082 non-null int64
dtypes: category(1), float64(4), int64(10), int8(2)
memory usage: 3.1 MB
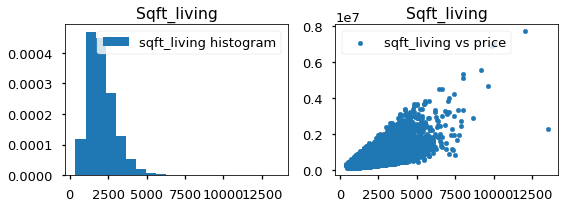
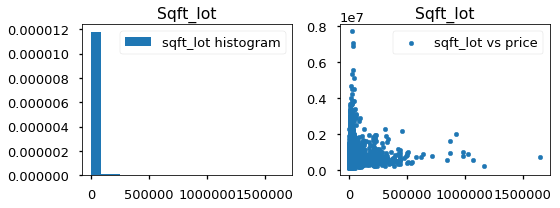
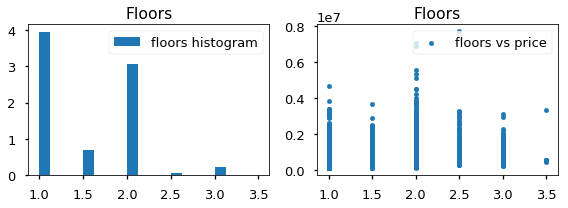
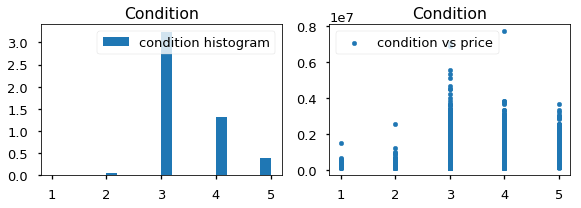
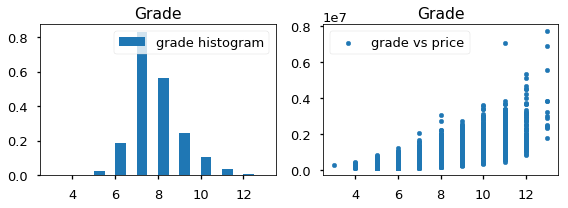
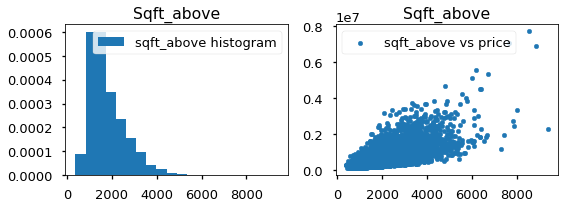
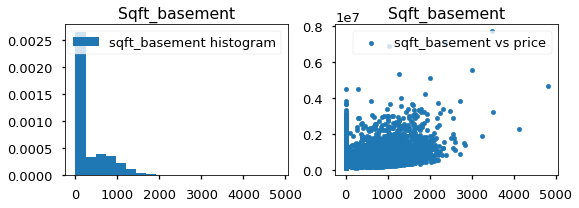
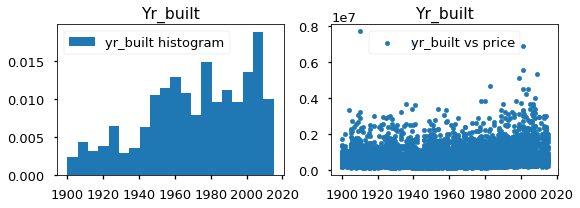
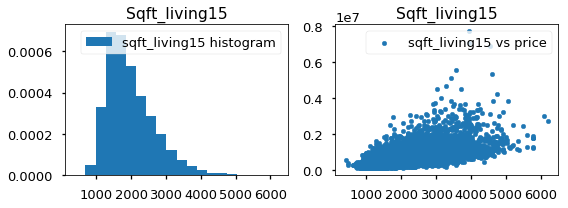
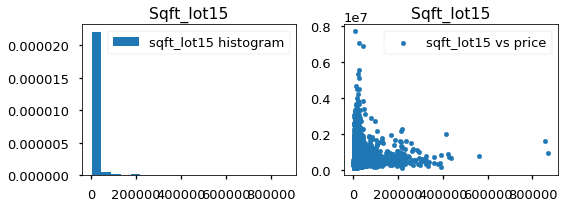
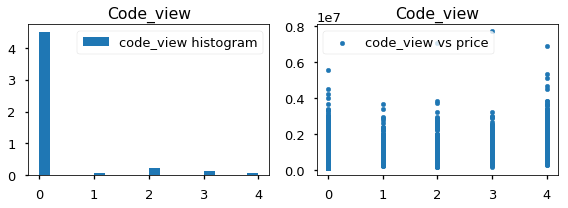
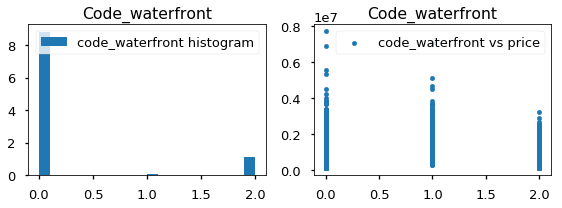
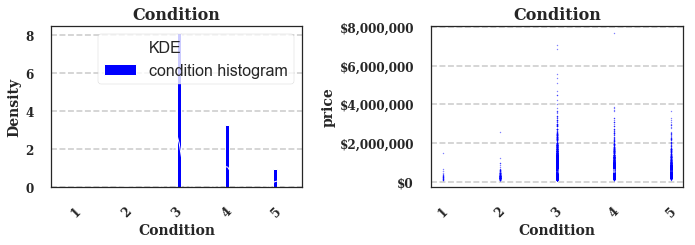
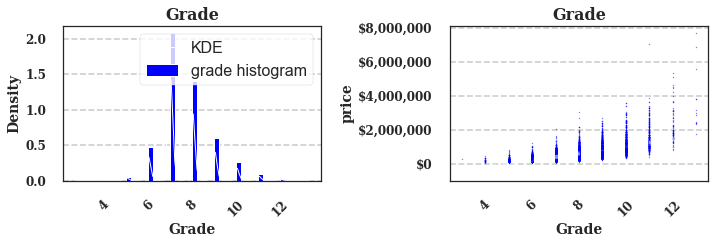
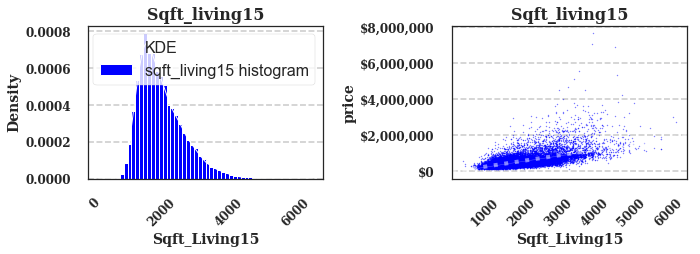
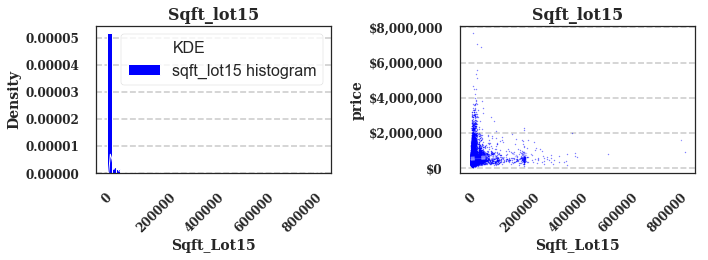
- Will examine histogram distributions and scatter plots vs price for each variable in df.describe()
# Plot histograms and scatterplots vs target variable price for all numerical columns in df (show up in .describe())

fig = plot_hist_scat(df)
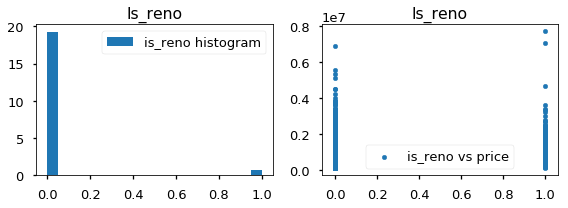
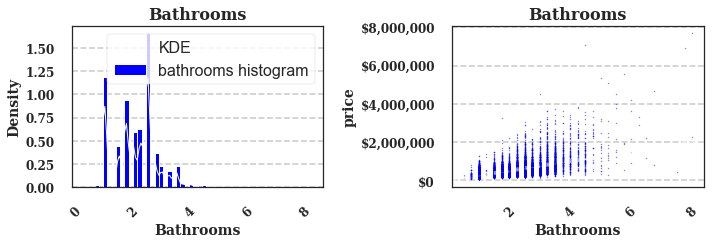
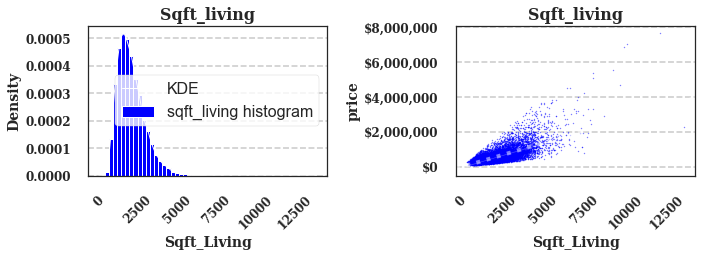
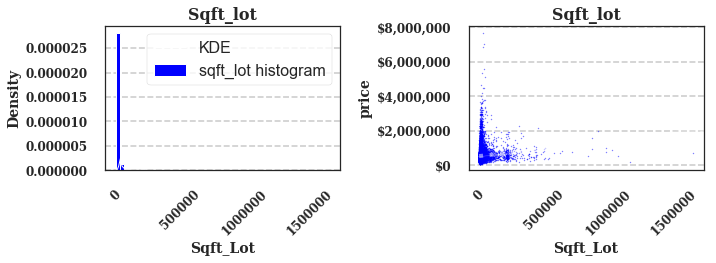
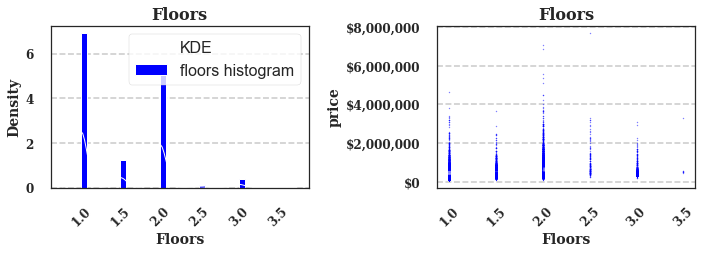
# fig = plot_hist_scat_sns(df)- Notes on histograms and scatterplots
- Columns to be analyzed as categorical data: (cast as int for now, make sure its .
astype('category').cat.as_ordered()one-hot coded later before running regression- Waterfront
- View
- Zipcode
- Columns that are ordinal data. (e.g. 2 floors is indeed double 1 floor)
- Floors
- Bedrooms
- Bathrooms
- Condition
- Grade
- Columns that may be best analyzed by binning and casting as categorical data
- Yr_built
- is_reno
- classified as simply renovated or not.**
- sqft_basement
- sqft_above
- Numerical columns (that may be best analyzed as such)
- All sqft categories
- price
- Note: moved sqft_basement to binned category to deal with 0's, also added sqft_above to accompany it
- Numerical columns that were dropped
- id
- Lat
- Long
- Date
- yr_renovated -> is_reno
- The target variable, price, seems a bit skewed and may be better analyzed as log-transformed.
- Try both log-transformed and unaltered
- All sqft columns seem to be skewed and should be transformed. (log)
# Create tuples with columns names of categorical variables for easy extraction
cat_vars = ('waterfront','view','zipcode')
ord_vars = ('grade','condition','floors','bedrooms','bathrooms')
vars_to_bin = ('yr_built','yr_renovated','sqft_above','sqft_basement')
num_vars = ('sqft_living', 'sqft_lot','sqft_living15', 'sqft_lot15')- yr_built, yr_renovated
- Added sqft_basement due to 0 values
- Added sqft_above to accompany basement
# Check the min and max of the yr variables for binning range
df['yr_built'].describe().round(2)
count 21082.00
mean 1971.02
std 29.32
min 1900.00
25% 1952.00
50% 1975.00
75% 1997.00
max 2015.00
Name: yr_built, dtype: float64
## Bin yr_built then make yr_built category
# yr_built min is 1900, max is 2015
bins = list(range(1900,2030,10))

df['yr_built'].replace(np.nan,0,inplace=True)
bins_yrbuilt = pd.cut(df['yr_built'], bins,include_lowest=True) # Cut into bins
# check_column(bins_yrbuilt)

df['bins_yrbuilt'] = bins_yrbuilt.astype('category').cat.as_ordered() #.cat.as_ordered()

# Inspecting the binned data counts
check_column(df['bins_yrbuilt'])
Column: df['bins_yrbuilt']':
dtype: category
isna: 0 out of 21082 - 0.0%
Unique non-na values:
(2000.0, 2010.0] 3354
(1960.0, 1970.0] 2484
(1950.0, 1960.0] 2411
(1970.0, 1980.0] 2351
(1980.0, 1990.0] 2297
(1990.0, 2000.0] 2085
(1940.0, 1950.0] 1806
(1920.0, 1930.0] 1142
(2010.0, 2020.0] 1066
(1899.999, 1910.0] 759
(1910.0, 1920.0] 747
(1930.0, 1940.0] 580
Name: bins_yrbuilt, dtype: int64
# Drop original
drop_me = 'yr_built'
df_dropped[drop_me] = df[drop_me].copy()
df.drop(drop_me,axis=1,inplace=True)df['sqft_basement'].describe()count 21082.000000
mean 291.359975
std 442.007858
min 0.000000
25% 0.000000
50% 0.000000
75% 560.000000
max 4820.000000
Name: sqft_basement, dtype: float64
check_column(df['sqft_basement'],10)Column: df['sqft_basement']':
dtype: float64
isna: 0 out of 21082 - 0.0%
Unique non-na values:
0.0 12798
600.0 216
500.0 209
700.0 207
800.0 201
400.0 184
1000.0 147
900.0 142
300.0 140
200.0 105
Name: sqft_basement, dtype: int64
# Definine bins where bins 0-1 is its own interval
bins=[-np.inf]
[bins.append(x) for x in range(1,5500,500)]
# bins

# cut_basement = df['sqft_basement'].replace(0,np.nan)
cut_basement = df['sqft_basement'].replace(np.nan,0).copy()
# cut_basement = cut_basement.replace('NaN',0)

bins_sqftbase = pd.cut(cut_basement, bins=bins, include_lowest=True) # Cut into bins
df['bins_sqftbasement'] = bins_sqftbase.copy()

# Cast as ordered category
df['bins_sqftbasement'] = df['bins_sqftbasement'].astype('category').cat.as_ordered()

# Check result
check_column(df['bins_sqftbasement'])
Column: df['bins_sqftbasement']':
dtype: category
isna: 0 out of 21082 - 0.0%
Unique non-na values:
(-inf, 1.0] 12798
(501.0, 1001.0] 3849
(1.0, 501.0] 2617
(1001.0, 1501.0] 1476
(1501.0, 2001.0] 269
(2001.0, 2501.0] 57
(2501.0, 3001.0] 11
(3001.0, 3501.0] 3
(4501.0, 5001.0] 1
(4001.0, 4501.0] 1
(3501.0, 4001.0] 0
Name: bins_sqftbasement, dtype: int64
# Drop original
drop_me = 'sqft_basement'
df_dropped[drop_me] = df[drop_me].copy()
df.drop(drop_me,axis=1,inplace=True)check_column(df['sqft_above'],10)
df['sqft_above'].describe()Column: df['sqft_above']':
dtype: int64
isna: 0 out of 21082 - 0.0%
Unique non-na values:
1300 208
1010 206
1200 197
1220 190
1140 181
1180 174
1400 174
1340 173
1060 173
1250 168
Name: sqft_above, dtype: int64
count 21082.000000
mean 1789.000000
std 828.369355
min 370.000000
25% 1200.000000
50% 1560.000000
75% 2210.000000
max 9410.000000
Name: sqft_above, dtype: float64
# sqft_above
# Bins to cover range seen above in .describe
bins = list(range(0,9501,500))

# cut_above = df['sqft_above'].replace(0,np.nan)
bins_sqftabove = pd.cut(df['sqft_above'], bins=bins, include_lowest=True) # Cut into bins, including left edge
check_column(bins_sqftabove)
Column: df['sqft_above']':
dtype: category
isna: 0 out of 21082 - 0.0%
Unique non-na values:
(1000.0, 1500.0] 7352
(1500.0, 2000.0] 4686
(2000.0, 2500.0] 2764
(500.0, 1000.0] 2488
(2500.0, 3000.0] 1815
(3000.0, 3500.0] 1088
(3500.0, 4000.0] 466
(4000.0, 4500.0] 239
(4500.0, 5000.0] 80
(5000.0, 5500.0] 42
(-0.001, 500.0] 19
(6000.0, 6500.0] 16
(5500.0, 6000.0] 14
(6500.0, 7000.0] 4
(7500.0, 8000.0] 3
(8500.0, 9000.0] 2
(7000.0, 7500.0] 2
(8000.0, 8500.0] 1
(9000.0, 9500.0] 1
Name: sqft_above, dtype: int64
bins_sqftabove.replace(np.nan,'NaN',inplace=True)
df['bins_sqftabove']=bins_sqftabove.astype('category').cat.as_ordered()

check_column(df['bins_sqftabove'])
Column: df['bins_sqftabove']':
dtype: category
isna: 0 out of 21082 - 0.0%
Unique non-na values:
(1000.0, 1500.0] 7352
(1500.0, 2000.0] 4686
(2000.0, 2500.0] 2764
(500.0, 1000.0] 2488
(2500.0, 3000.0] 1815
(3000.0, 3500.0] 1088
(3500.0, 4000.0] 466
(4000.0, 4500.0] 239
(4500.0, 5000.0] 80
(5000.0, 5500.0] 42
(-0.001, 500.0] 19
(6000.0, 6500.0] 16
(5500.0, 6000.0] 14
(6500.0, 7000.0] 4
(7500.0, 8000.0] 3
(8500.0, 9000.0] 2
(7000.0, 7500.0] 2
(8000.0, 8500.0] 1
(9000.0, 9500.0] 1
Name: bins_sqftabove, dtype: int64
# Drop original
drop_me = 'sqft_above'
df_dropped[drop_me] = df[drop_me].copy()
df.drop(drop_me,axis=1,inplace=True)# Plot correlation heatmaps for all data
# pause
to_drop = ['price']
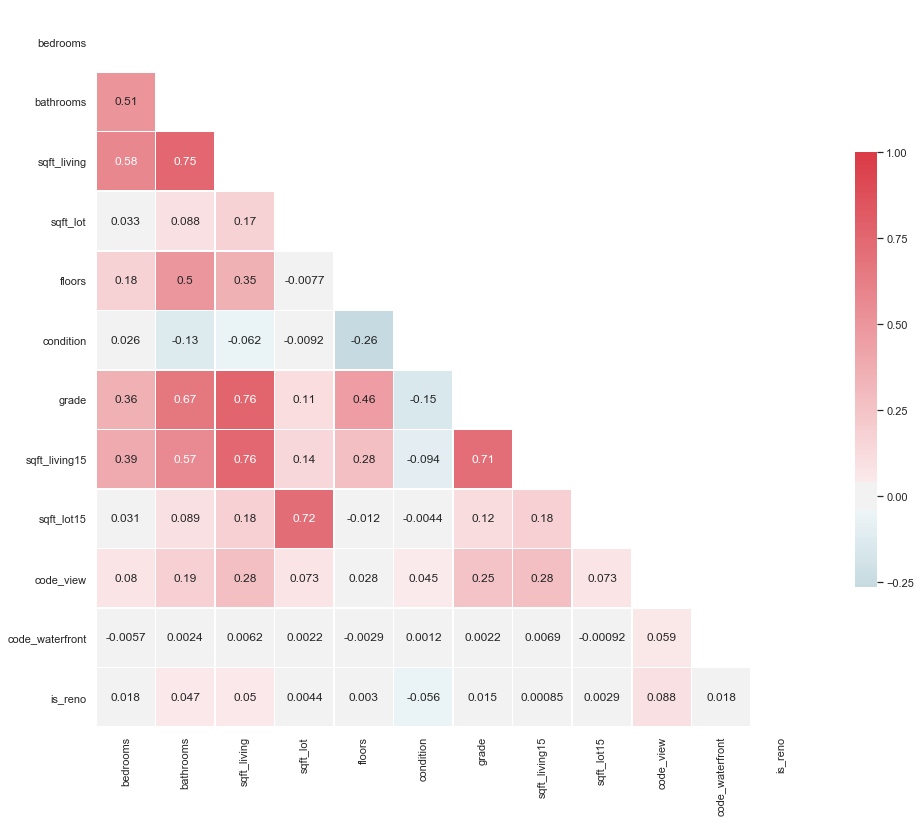
multiplot(df.drop(to_drop,axis=1))- Sqft_living is highly correlated with sqft_living15 and grade,
- These correlations make sense sense since neighborhoods probably have similar construction.
- The r values are ~0.75 (threshold) and have sufficient intuitive rationale to keep.
- Re-examining the basic stats and distributions of the data.
- Decide on transformations to perform
- Normalize afterwards.
- Visually examine for possible relationships
df.head().dataframe tbody tr th {
vertical-align: top;
}
.dataframe thead th {
text-align: right;
}
| price | bedrooms | bathrooms | sqft_living | sqft_lot | floors | condition | grade | zipcode | sqft_living15 | sqft_lot15 | code_view | code_waterfront | is_reno | bins_yrbuilt | bins_sqftbasement | bins_sqftabove | |
|---|---|---|---|---|---|---|---|---|---|---|---|---|---|---|---|---|---|
| 0 | 221900.0 | 3 | 1.00 | 1180 | 5650 | 1.0 | 3 | 7 | 98178 | 1340 | 5650 | 0 | 2 | 0 | (1950.0, 1960.0] | (-inf, 1.0] | (1000.0, 1500.0] |
| 1 | 538000.0 | 3 | 2.25 | 2570 | 7242 | 2.0 | 3 | 7 | 98125 | 1690 | 7639 | 0 | 0 | 1 | (1950.0, 1960.0] | (1.0, 501.0] | (2000.0, 2500.0] |
| 2 | 180000.0 | 2 | 1.00 | 770 | 10000 | 1.0 | 3 | 6 | 98028 | 2720 | 8062 | 0 | 0 | 0 | (1930.0, 1940.0] | (-inf, 1.0] | (500.0, 1000.0] |
| 3 | 604000.0 | 4 | 3.00 | 1960 | 5000 | 1.0 | 5 | 7 | 98136 | 1360 | 5000 | 0 | 0 | 0 | (1960.0, 1970.0] | (501.0, 1001.0] | (1000.0, 1500.0] |
| 4 | 510000.0 | 3 | 2.00 | 1680 | 8080 | 1.0 | 3 | 8 | 98074 | 1800 | 7503 | 0 | 0 | 0 | (1980.0, 1990.0] | (-inf, 1.0] | (1500.0, 2000.0] |
df.describe().dataframe tbody tr th {
vertical-align: top;
}
.dataframe thead th {
text-align: right;
}
| price | bedrooms | bathrooms | sqft_living | sqft_lot | floors | condition | grade | sqft_living15 | sqft_lot15 | code_view | code_waterfront | is_reno | |
|---|---|---|---|---|---|---|---|---|---|---|---|---|---|
| count | 2.108200e+04 | 21082.000000 | 21082.000000 | 21082.000000 | 2.108200e+04 | 21082.00000 | 21082.000000 | 21082.000000 | 21082.000000 | 21082.000000 | 21082.000000 | 21082.000000 | 21082.000000 |
| mean | 5.402469e+05 | 3.372403 | 2.115916 | 2080.359975 | 1.507759e+04 | 1.49362 | 3.409828 | 7.657717 | 1986.917418 | 12732.514135 | 0.233327 | 0.228014 | 0.034247 |
| std | 3.667323e+05 | 0.924996 | 0.768142 | 917.856396 | 4.117338e+04 | 0.53937 | 0.650597 | 1.173690 | 685.544250 | 27148.781580 | 0.765066 | 0.630372 | 0.181868 |
| min | 7.800000e+04 | 1.000000 | 0.500000 | 370.000000 | 5.200000e+02 | 1.00000 | 1.000000 | 3.000000 | 399.000000 | 651.000000 | 0.000000 | 0.000000 | 0.000000 |
| 25% | 3.220000e+05 | 3.000000 | 1.750000 | 1430.000000 | 5.040000e+03 | 1.00000 | 3.000000 | 7.000000 | 1490.000000 | 5100.000000 | 0.000000 | 0.000000 | 0.000000 |
| 50% | 4.500000e+05 | 3.000000 | 2.250000 | 1910.000000 | 7.620000e+03 | 1.50000 | 3.000000 | 7.000000 | 1840.000000 | 7626.000000 | 0.000000 | 0.000000 | 0.000000 |
| 75% | 6.450000e+05 | 4.000000 | 2.500000 | 2550.000000 | 1.069775e+04 | 2.00000 | 4.000000 | 8.000000 | 2360.000000 | 10088.750000 | 0.000000 | 0.000000 | 0.000000 |
| max | 7.700000e+06 | 33.000000 | 8.000000 | 13540.000000 | 1.651359e+06 | 3.50000 | 5.000000 | 13.000000 | 6210.000000 | 871200.000000 | 4.000000 | 2.000000 | 1.000000 |
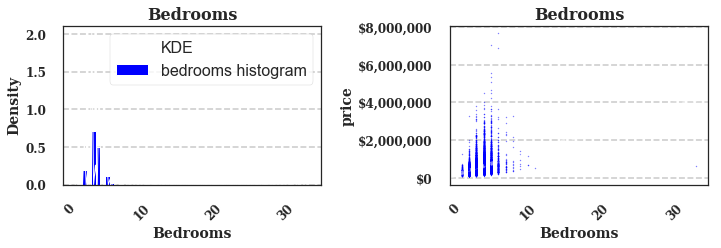
- Bedrooms has some very clear outliers (max is 33, but 75% quartile is only 4)
- May want to remove outliers after Z-scoring (Absolute Z-score > 3)
- Same with bathrooms (8 is max, 75% quartile is only 2.5)
- Same with sqft_living (max 13540, 75% quartile = 2550)
- Also same with sqft_lot15, sqftliving15
- Distributions and scatterplots
- Note: May want to cast all categoricals as strings/categories for visualization
- Keeping as is for now
from fsds_100719.imports import *
import warnings
warnings.filterwarnings('ignore')
fsds_1007219 v0.4.8 loaded. Read the docs: https://fsds.readthedocs.io/en/latest/
> For convenient loading of standard modules use: `>> from fsds_100719.imports import *`
            <tr>
                            <td id="T_b5405dd4_f853_11e9_9656_acde48001122row0_col0" class="data row0 col0" >IPython.display</td>
                    <td id="T_b5405dd4_f853_11e9_9656_acde48001122row0_col1" class="data row0 col1" >dp</td>
                    <td id="T_b5405dd4_f853_11e9_9656_acde48001122row0_col2" class="data row0 col2" >Display modules with helpful display and clearing commands.</td>
        </tr>
        <tr>
                            <td id="T_b5405dd4_f853_11e9_9656_acde48001122row1_col0" class="data row1 col0" >fsds_100719</td>
                    <td id="T_b5405dd4_f853_11e9_9656_acde48001122row1_col1" class="data row1 col1" >fs</td>
                    <td id="T_b5405dd4_f853_11e9_9656_acde48001122row1_col2" class="data row1 col2" >Custom data science bootcamp student package</td>
        </tr>
        <tr>
                            <td id="T_b5405dd4_f853_11e9_9656_acde48001122row2_col0" class="data row2 col0" >matplotlib</td>
                    <td id="T_b5405dd4_f853_11e9_9656_acde48001122row2_col1" class="data row2 col1" >mpl</td>
                    <td id="T_b5405dd4_f853_11e9_9656_acde48001122row2_col2" class="data row2 col2" >Matplotlib's base OOP module with formatting artists</td>
        </tr>
        <tr>
                            <td id="T_b5405dd4_f853_11e9_9656_acde48001122row3_col0" class="data row3 col0" >matplotlib.pyplot</td>
                    <td id="T_b5405dd4_f853_11e9_9656_acde48001122row3_col1" class="data row3 col1" >plt</td>
                    <td id="T_b5405dd4_f853_11e9_9656_acde48001122row3_col2" class="data row3 col2" >Matplotlib's matlab-like plotting module</td>
        </tr>
        <tr>
                            <td id="T_b5405dd4_f853_11e9_9656_acde48001122row4_col0" class="data row4 col0" >numpy</td>
                    <td id="T_b5405dd4_f853_11e9_9656_acde48001122row4_col1" class="data row4 col1" >np</td>
                    <td id="T_b5405dd4_f853_11e9_9656_acde48001122row4_col2" class="data row4 col2" >scientific computing with Python</td>
        </tr>
        <tr>
                            <td id="T_b5405dd4_f853_11e9_9656_acde48001122row5_col0" class="data row5 col0" >pandas</td>
                    <td id="T_b5405dd4_f853_11e9_9656_acde48001122row5_col1" class="data row5 col1" >pd</td>
                    <td id="T_b5405dd4_f853_11e9_9656_acde48001122row5_col2" class="data row5 col2" >High performance data structures and tools</td>
        </tr>
        <tr>
                            <td id="T_b5405dd4_f853_11e9_9656_acde48001122row6_col0" class="data row6 col0" >seaborn</td>
                    <td id="T_b5405dd4_f853_11e9_9656_acde48001122row6_col1" class="data row6 col1" >sns</td>
                    <td id="T_b5405dd4_f853_11e9_9656_acde48001122row6_col2" class="data row6 col2" >High-level data visualization library based on matplotlib</td>
        </tr>
</tbody></table>
# fs.ds.reload()
# stop
fs.ihelp(plot_hist_scat_sns)
------------------------------------------------------------------------------------
------ HELP ------------------------------------------------------------------------
Help on function plot_hist_scat_sns in module _functions_jirving:
plot_hist_scat_sns(df, target='price', style='seaborn-talk', stats=False, hist_kwds={}, scatter_kwds={}, figsize=(8, 3), fig_filepath=None)
Plots 2 subplots: a seaborn distplot of each column, and a regplot of each column vs target.
Args:
df (df): Dataframe of data
target (str, optional): Name of target column. Defaults to 'price'.
style (str, optional): Matplotlib style to use. Defaults to 'seaborn-talk'.
stats (bool, optional): Show normality test. Defaults to False.
hist_kwds (dict, optional): Plotting **kwargs for seaborn hist. Defaults to {}.
scatter_kwds (dict, optional): Plotting **kwargs for seaborn scatter. Defaults to {}.
figsize (tuple, optional): Figure size Defaults to (8,3).
fig_filepath ([type], optional): To save, give filename to saveas. Defaults to None.
------------------------------------------------------------------------------------
------ SOURCE ----------------------------------------------------------------------
def plot_hist_scat_sns(df,target='price',style='seaborn-talk',stats=False,
                   hist_kwds={},scatter_kwds={},figsize=(8,3),fig_filepath=None):
    """
    Plots 2 subplots: a seaborn distplot of each column, and a regplot of each column vs target.

    Args:
        df (df): Dataframe of data
        target (str, optional): Name of target column. Defaults to 'price'.
        style (str, optional): Matplotlib style to use. Defaults to 'seaborn-talk'.
        stats (bool, optional): Show normality test. Defaults to False.
        hist_kwds (dict, optional): Plotting **kwargs for seaborn hist. Defaults to {}.
        scatter_kwds (dict, optional): Plotting **kwargs for seaborn scatter. Defaults to {}.
        figsize (tuple, optional): Figure size Defaults to (8,3).
        fig_filepath ([type], optional): To save, give filename to saveas. Defaults to None.
    """
    with plt.style.context(style):


        ## ----------- DEFINE AESTHETIC CUSTOMIZATIONS ----------- ##
        # Axis Label fonts
        fontTitle = {'fontsize': 16,
                'fontweight': 'bold',
                    'fontfamily':'serif'}

        fontAxis = {'fontsize': 14,
                'fontweight': 'bold',
                    'fontfamily':'serif'}

        fontTicks = {'fontsize': 12,
                'fontweight':'bold',
                    'fontfamily':'serif'}

        # Formatting dollar sign labels
        fmtPrice = '${x:,.0f}'
        tickPrice = mtick.StrMethodFormatter(fmtPrice)


        ## ----------- PLOTTING ----------- ##

        ## Loop through dataframe to plot
        for column in df.describe():

            # Create figure with subplots for current column
            # Note: in order to use identical syntax for large # of subplots (ax[i,j]),
            #  declare an extra row of subplots to be removed later
            fig, ax = plt.subplots(figsize=figsize, ncols=2, nrows=2)

            ## ----- SUBPLOT 1 -----##
            i,j = 0,0
            ax[i,j].set_title(column.capitalize(),fontdict=fontTitle)

            # Define graphing keyword dictionaries for distplot (Subplot 1)
            hist_kws = {"linewidth": 1, "alpha": 1, "color": 'blue','edgecolor':'w'}
            kde_kws = {"color": "white", "linewidth": 1, "label": "KDE"}

            # Plot distplot on ax[i,j] using hist_kws and kde_kws
            sns.distplot(df[column], norm_hist=True, kde=True,
                        hist_kws = hist_kws, kde_kws = kde_kws,
                        label=column+' histogram', ax=ax[i,j])


            # Set x axis label
            ax[i,j].set_xlabel(column.title(),fontdict=fontAxis)

            # Get x-ticks, rotate labels, and return
            xticklab1 = ax[i,j].get_xticklabels(which = 'both')
            ax[i,j].set_xticklabels(labels=xticklab1, fontdict=fontTicks, rotation=45)
            ax[i,j].xaxis.set_major_formatter(mtick.ScalarFormatter())


            # Set y-label
            ax[i,j].set_ylabel('Density',fontdict=fontAxis)
            yticklab1=ax[i,j].get_yticklabels(which='both')
            ax[i,j].set_yticklabels(labels=yticklab1,fontdict=fontTicks)
            ax[i,j].yaxis.set_major_formatter(mtick.ScalarFormatter())


            # Set y-grid
            ax[i, j].set_axisbelow(True)
            ax[i, j].grid(axis='y',ls='--')


            ## ----- SUBPLOT 2-----  ##
            i,j = 0,1
            ax[i,j].set_title(column.capitalize(),fontdict=fontTitle)

            # Define the ketword dictionaries for  scatter plot and regression line (subplot 2)
            line_kws={"color":"white","alpha":0.5,"lw":4,"ls":":"}
            scatter_kws={'s': 2, 'alpha': 0.5,'marker':'.','color':'blue'}

            # Plot regplot on ax[i,j] using line_kws and scatter_kws
            sns.regplot(df[column], df[target],
                        line_kws = line_kws,
                        scatter_kws = scatter_kws,
                        ax=ax[i,j])

            # Set x-axis label
            ax[i,j].set_xlabel(column.title(),fontdict=fontAxis)

            # Get x ticks, rotate labels, and return
            xticklab2=ax[i,j].get_xticklabels(which='both')
            ax[i,j].set_xticklabels(labels=xticklab2,fontdict=fontTicks, rotation=45)
            ax[i,j].xaxis.set_major_formatter(mtick.ScalarFormatter())

            # Set  y-axis label
            ax[i,j].set_ylabel(target,fontdict=fontAxis)

            # Get, set, and format y-axis Price labels
            yticklab = ax[i,j].get_yticklabels()
            ax[i,j].set_yticklabels(yticklab,fontdict=fontTicks)
            ax[i,j].get_yaxis().set_major_formatter(tickPrice)

            # Set y-grid
            ax[i, j].set_axisbelow(True)
            ax[i, j].grid(axis='y',ls='--')

            ## ---------- Final layout adjustments ----------- ##
            # Deleted unused subplots
            fig.delaxes(ax[1,1])
            fig.delaxes(ax[1,0])

            # Optimizing spatial layout
            fig.tight_layout()
            figtitle=column+'_dist_regr_plots.png'

            if fig_filepath is not None:
                plt.savefig(fig_filepath+figtitle)
        return
# INSPECTING NUMERICAL DATA DISTPLOTS + KDE
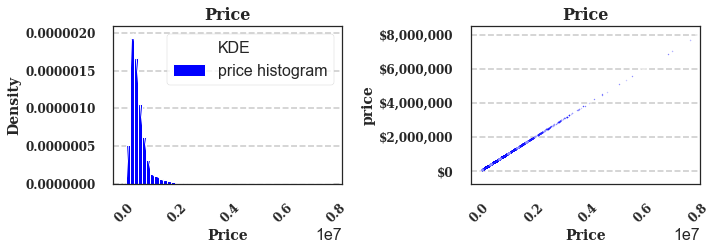
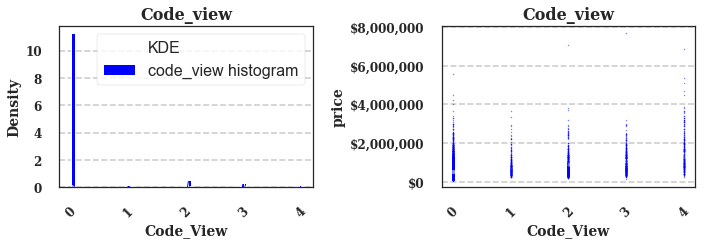
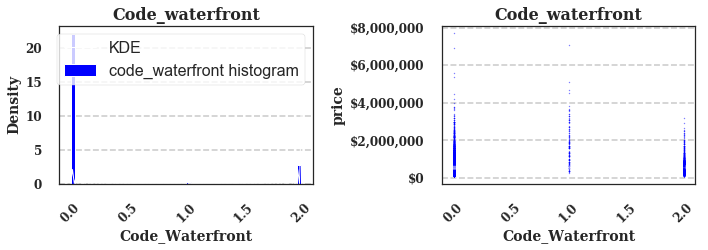
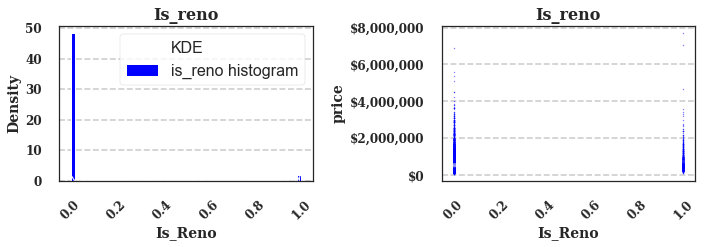
plot_hist_scat_sns(df,style='seaborn-poster',figsize=(10,6))- Essentialy all numerical data seems to be at least slightly skewed.
- Do not think it is sufficient to log-transform the data and lose model interpretability
# Define list of all categorical variables
list_cat_vars = ['zipcode', 'bins_yrbuilt', 'bins_sqftbasement', 'bins_sqftabove','condition','grade','code_view','code_waterfront']
# # Plotting scatterplots and boxplots for categorical data
# # plt.style.use('seaborn')
# list_cat_vars = ['zipcode', 'bins_yrbuilt', 'bins_sqftbasement', 'bins_sqftabove','condition','grade','code_view','code_waterfront']
# def plot_cat_box_sns(df,target='price',figsize=(12,6)):
# for column in list_cat_vars:
# ## Create figure and axes
# fig, (ax1,ax2) = plt.subplots(ncols=2,figsize=figsize)
# # ax1.set_title('Price vs ',column,' scatter plot')
# title1=column+' scatter'
# ax1.set_title(title1.title())
# ax1.set_xlabel(column)
# ax1.set_ylabel(target)
# sns.stripplot(x=df[column],y=df[target],marker='.',ax=ax1)
# sns.boxplot(x=df[column],y=df[target],ax=ax2)
# ## Create keywords for .set_xticklabels()
# tick_kwds = dict(horizontalalignment='right',
# fontweight='light',
# fontsize='x-large',
# rotation=45)
# ax1.set_xticklabels(ax1.get_xticklabels(),**tick_kwds)
# ax2.set_xticklabels(ax1.get_xticklabels(),**tick_kwds)
# title2=column+' boxplot'
# ax2.set_title(title2.title())
# ax2.set_xlabel(column)
# ax2.set_ylabel(target)
# fig.tight_layout()
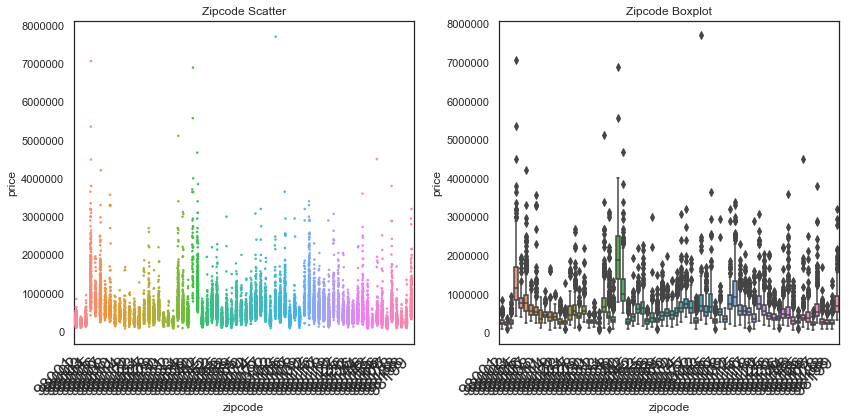
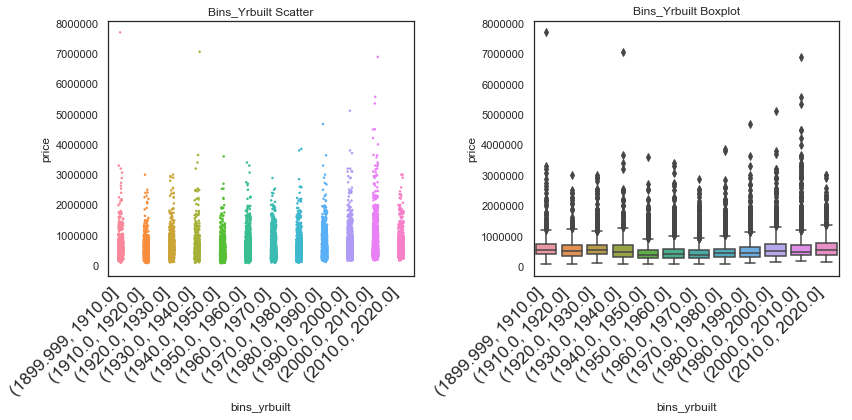
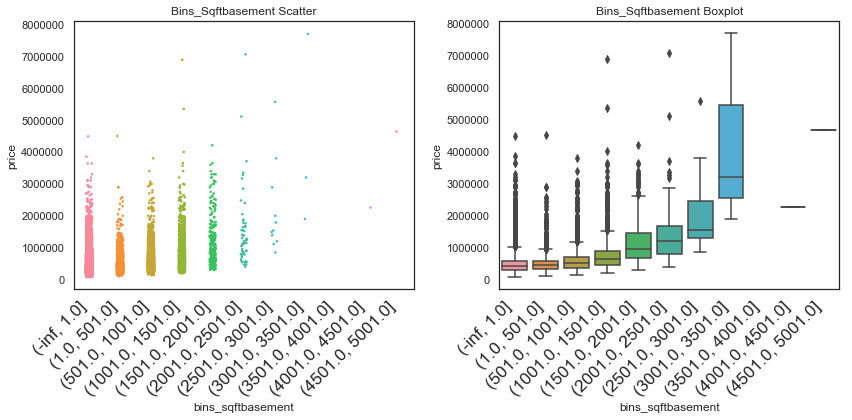
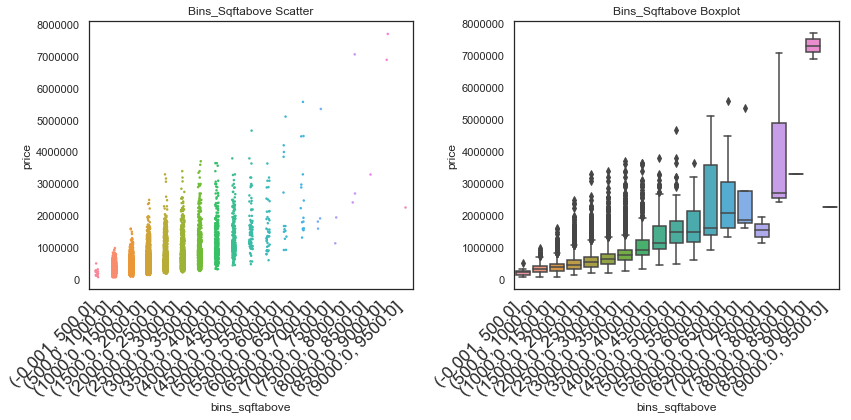
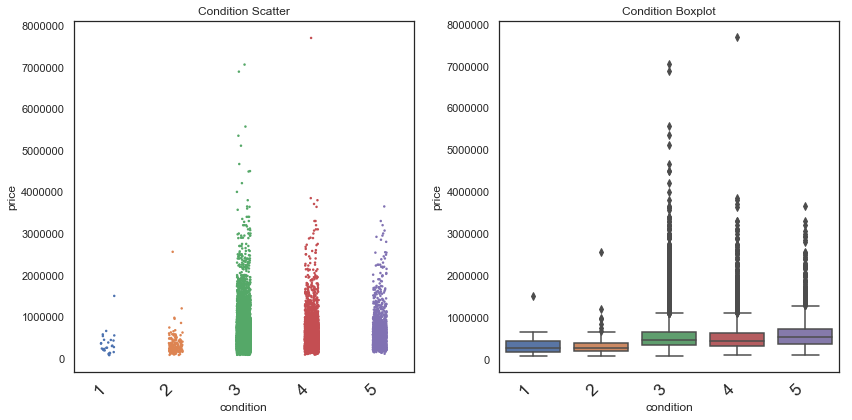
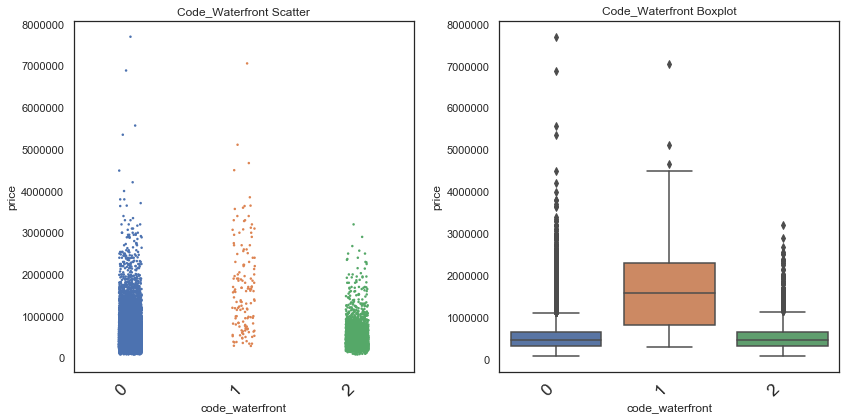
plot_cat_box_sns(df)Notes on categorical scatter plots
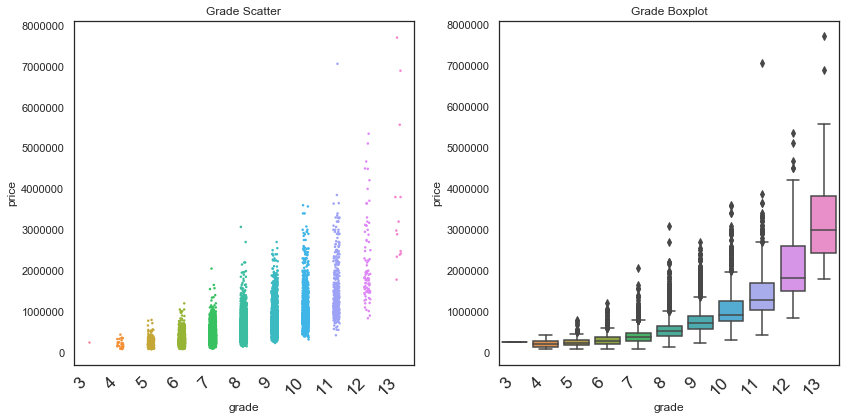
- grade seems to be strongly related to price (notice how the whole range of values seems to increase in price at higher grades.
- Zipcodes look to differ quite a bit in terms of price.
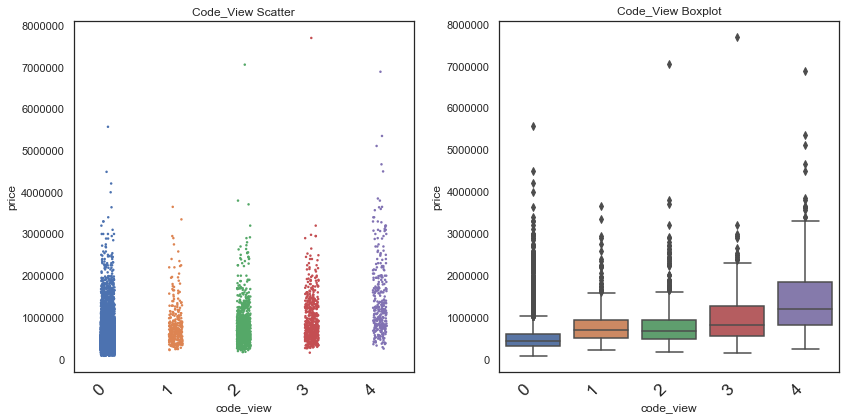
- Condition looks to be highly related to price (at least above condition level 2)
- View does not look as strongly related to price as I expected.
- Floors do not seem as related as expected
- yr_built may have some relationship with price
- yr_renovated has somewhat of a trend, but recent renovations buck this trend
# # INSPECTING REGRESSION PLOTS
# plt.style.use('seaborn')

# plot_vars=df.describe().columns

# for column in plot_vars:
# #     df_plot=df[column]
# #     df_plot = df.loc[df[column]>0]
#     plot= sns.regplot(df[column], df['price'],robust=False,marker='.') #kde=True,label = column+' histogram')
# #     plot = sns.boxplot(df[column],df['price'])
#     title = column+' linear regression'
#     plt.title(title.title())
# #     plt.legend()
# plt.show()df.describe().round(2).dataframe tbody tr th {
vertical-align: top;
}
.dataframe thead th {
text-align: right;
}
| Package | Handle | Description |
|---|
| price | bedrooms | bathrooms | sqft_living | sqft_lot | floors | condition | grade | sqft_living15 | sqft_lot15 | code_view | code_waterfront | is_reno | |
|---|---|---|---|---|---|---|---|---|---|---|---|---|---|
| count | 21082.00 | 21082.00 | 21082.00 | 21082.00 | 21082.00 | 21082.00 | 21082.00 | 21082.00 | 21082.00 | 21082.00 | 21082.00 | 21082.00 | 21082.00 |
| mean | 540246.89 | 3.37 | 2.12 | 2080.36 | 15077.59 | 1.49 | 3.41 | 7.66 | 1986.92 | 12732.51 | 0.23 | 0.23 | 0.03 |
| std | 366732.34 | 0.92 | 0.77 | 917.86 | 41173.38 | 0.54 | 0.65 | 1.17 | 685.54 | 27148.78 | 0.77 | 0.63 | 0.18 |
| min | 78000.00 | 1.00 | 0.50 | 370.00 | 520.00 | 1.00 | 1.00 | 3.00 | 399.00 | 651.00 | 0.00 | 0.00 | 0.00 |
| 25% | 322000.00 | 3.00 | 1.75 | 1430.00 | 5040.00 | 1.00 | 3.00 | 7.00 | 1490.00 | 5100.00 | 0.00 | 0.00 | 0.00 |
| 50% | 450000.00 | 3.00 | 2.25 | 1910.00 | 7620.00 | 1.50 | 3.00 | 7.00 | 1840.00 | 7626.00 | 0.00 | 0.00 | 0.00 |
| 75% | 645000.00 | 4.00 | 2.50 | 2550.00 | 10697.75 | 2.00 | 4.00 | 8.00 | 2360.00 | 10088.75 | 0.00 | 0.00 | 0.00 |
| max | 7700000.00 | 33.00 | 8.00 | 13540.00 | 1651359.00 | 3.50 | 5.00 | 13.00 | 6210.00 | 871200.00 | 4.00 | 2.00 | 1.00 |
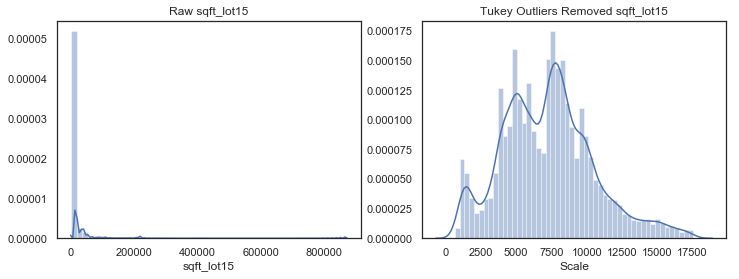
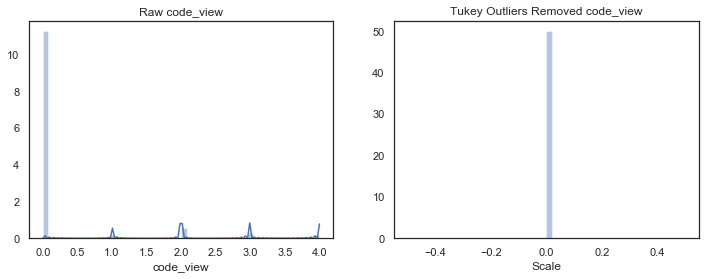
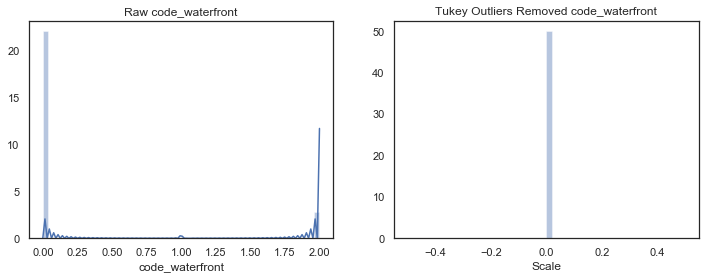
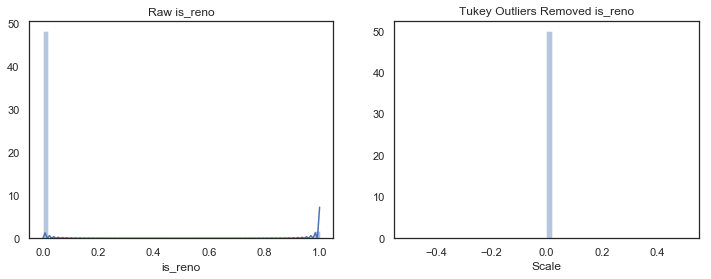
Graphing raw vs normalized results to decide if dataset should be normalized
log-transform and z-score numerical data.- Am using detect_outlier function to apply Tukey's method for outlier remnoval based on IQR
- Will be using pre-defined function detect_outliers(df,n,var_name)
- Returns index of rows containing outliers based in IQR
df.info()<class 'pandas.core.frame.DataFrame'>
Int64Index: 21082 entries, 0 to 21596
Data columns (total 17 columns):
price 21082 non-null float64
bedrooms 21082 non-null int64
bathrooms 21082 non-null float64
sqft_living 21082 non-null int64
sqft_lot 21082 non-null int64
floors 21082 non-null float64
condition 21082 non-null int64
grade 21082 non-null int64
zipcode 21082 non-null category
sqft_living15 21082 non-null int64
sqft_lot15 21082 non-null int64
code_view 21082 non-null int8
code_waterfront 21082 non-null int8
is_reno 21082 non-null int64
bins_yrbuilt 21082 non-null category
bins_sqftbasement 21082 non-null category
bins_sqftabove 21082 non-null category
dtypes: category(4), float64(3), int64(8), int8(2)
memory usage: 2.7 MB
# Define variables to plot vs tukey-cleaned outliers
vars_to_norm = ['sqft_living','sqft_lot','sqft_living15','sqft_lot15','bedrooms','bathrooms']
df.describe().columns
Index(['price', 'bedrooms', 'bathrooms', 'sqft_living', 'sqft_lot', 'floors',
'condition', 'grade', 'sqft_living15', 'sqft_lot15', 'code_view',
'code_waterfront', 'is_reno'],
dtype='object')
from collections import Counter
from sklearn.preprocessing import RobustScaler
robscaler = RobustScaler()

# vars_to_norm = ['sqft_living','sqft_lot','sqft_living15','sqft_lot15','bedrooms','bathrooms']
norm_results = [['column','K_square','p-val']]

# Graph all potential normalizedvariables
for var_name in df.describe():

    var = df[var_name]
    fig = plt.figure(figsize=(12,4))
    ax1 = fig.add_subplot(121)
    ax1 = sns.distplot(var, norm_hist=True)
    ax1.set_title('Raw '+var_name)
    #robscaler.fit_transform(np.array(var).reshape(-1,1)

    # OUTLIER REMOVAL
    outliers_to_drop = detect_outliers(df,0,[var_name])
    var_clean =df[var_name].drop(outliers_to_drop)

    ax2 = fig.add_subplot(122)

    ax2 = sns.distplot(var_clean,norm_hist=True)
#     ax2 = sns.distplot(robscaler.fit_transform(np.array(var_clean).reshape(-1,1)),norm_hist=True)

    ax2.set_title('Tukey Outliers Removed '+var_name) #+var)
    ax2.set_xlabel('Scale')
    stat, p = normtest(var_clean)
#     norm_results.append([var_clean,stat, p])
# norm_results = pd.DataFrame(norm_results[2:],columns=norm_results[0])#,index='columns')
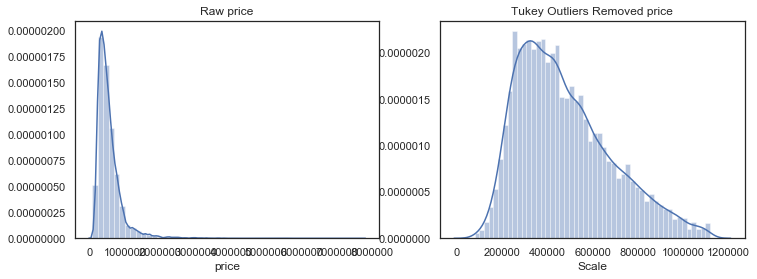
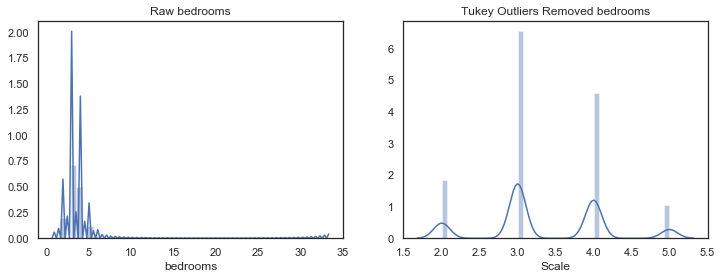
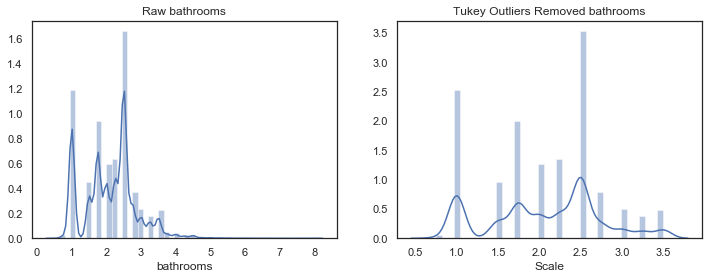
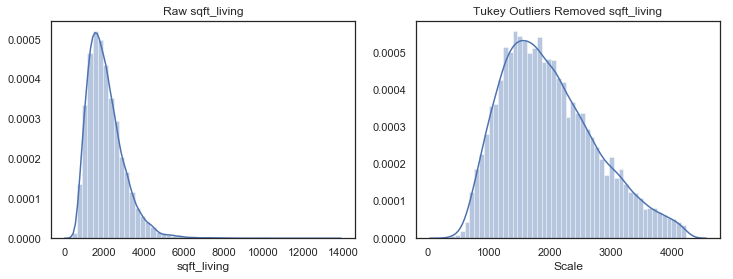
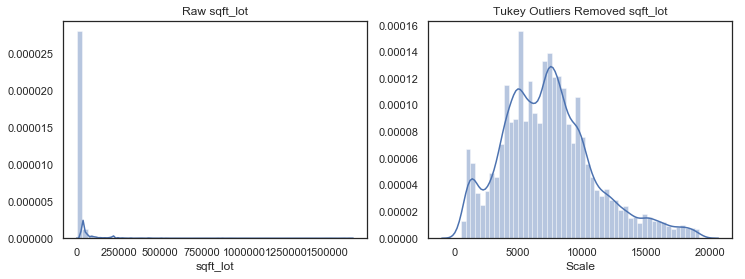
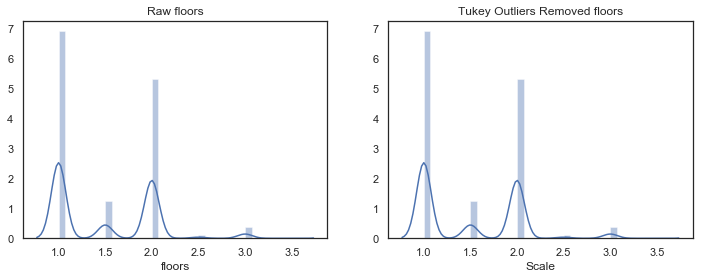
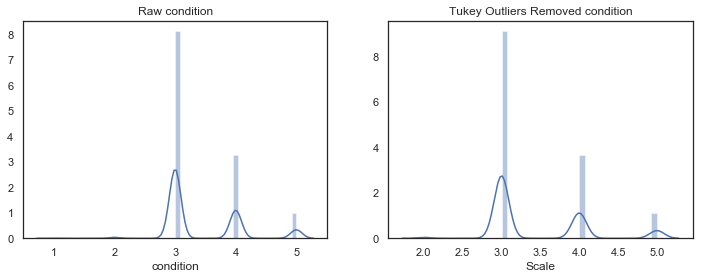
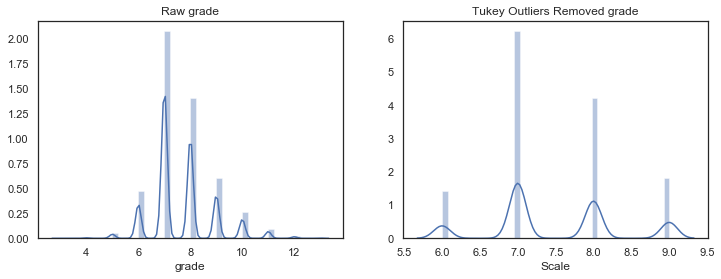
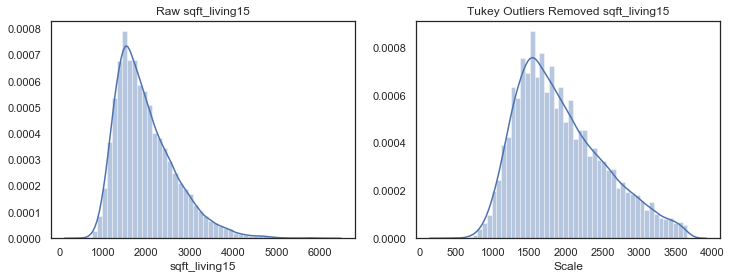
# norm_results- The data is skewed by outliers.
- Comparing it to IQR-method outlier elimination reveals much improved results
- The distributions look much more reasonabile with outliers removed.
- Bedrooms has some very clear outliers (max is 33, but 75% quartile is only 4)
- May want to remove outliers after Z-scoring (Absolute Z-score > 3)
- Same with bathrooms (8 is max, 75% quartile is only 2.5)
- Same with sqft_living (max 13540, 75% quartile = 2550)
- Also same with sqft_lot15, sqftliving15
# DEFINE VARIABLES TO GET THE OUTLIERS FOR (based on observations)
# vars_to_norm = ['price','bedrooms''sqft_living','sqft_lot','sqft_living15','sqft_lot15','bedrooms','bathrooms'
vars_to_clean = ['price','bedrooms','sqft_living','bathrooms','sqft_living15']
# GET OUTLIER INDICES AND REPORT
outliers_to_drop = {}
for col in vars_to_clean:
outliers_to_drop[col] = detect_outliers(df,0,[col])
# outliers_to_drop.keys()
# outliers_to_drop.values()
# Print out # of outliers
for k, v in outliers_to_drop.items():
print(f'col: {k} has {len(v)} outliers. ({round(len(v)/len(df),2)*100}%)' )col: price has 1131 outliers. (5.0%)
col: bedrooms has 511 outliers. (2.0%)
col: sqft_living has 557 outliers. (3.0%)
col: bathrooms has 546 outliers. (3.0%)
col: sqft_living15 has 532 outliers. (3.0%)
# Intialize df_norm with df's values
df_norm=df.copy()
# Iterate throught outliers_to_drop dictionary to replace outliers with np.nan
for k, v in outliers_to_drop.items():
df_norm.loc[v,k] = np.nan # axis=0,inplace=True)
# Display null values
df_norm.isna().sum()price 1131
bedrooms 511
bathrooms 546
sqft_living 557
sqft_lot 0
floors 0
condition 0
grade 0
zipcode 0
sqft_living15 532
sqft_lot15 0
code_view 0
code_waterfront 0
is_reno 0
bins_yrbuilt 0
bins_sqftbasement 0
bins_sqftabove 0
dtype: int64
# REMOVING OUTLIERS FROM PRICE
drop_col = 'price'

print(f'for {drop_col}:')
print(f'# of intial rows: {len(df_norm)}')
df_norm.dropna(subset=['price'],inplace=True)
print(f'# after dropping rows: {len(df_norm)}')
print(f'\nOutliers remaining: \n{df_norm.isna().sum()}')
for price:
# of intial rows: 21082
# after dropping rows: 19951
Outliers remaining:
price 0
bedrooms 449
bathrooms 253
sqft_living 169
sqft_lot 0
floors 0
condition 0
grade 0
zipcode 0
sqft_living15 231
sqft_lot15 0
code_view 0
code_waterfront 0
is_reno 0
bins_yrbuilt 0
bins_sqftbasement 0
bins_sqftabove 0
dtype: int64
# REMOVING OUTLIERS FROM BEDROOMS
drop_col = 'bedrooms'

print(f'for {drop_col}:')
print(f'# of intial rows: {len(df_norm)}')
df_norm.dropna(subset=[drop_col],inplace=True)
print(f'# after dropping rows: {len(df_norm)}')
print(f'\nOutliers remaining: \n{df_norm.isna().sum()}')
for bedrooms:
# of intial rows: 19951
# after dropping rows: 19502
Outliers remaining:
price 0
bedrooms 0
bathrooms 196
sqft_living 150
sqft_lot 0
floors 0
condition 0
grade 0
zipcode 0
sqft_living15 228
sqft_lot15 0
code_view 0
code_waterfront 0
is_reno 0
bins_yrbuilt 0
bins_sqftbasement 0
bins_sqftabove 0
dtype: int64
# REMOVING OUTLIERS FROM PRICE

drop_col = 'sqft_living'

print(f'for {drop_col}:')
print(f'# of intial rows: {len(df_norm)}')
df_norm.dropna(subset=[drop_col],inplace=True)
print(f'# after dropping rows: {len(df_norm)}')
print(f'\nOutliers remaining: \n{df_norm.isna().sum()}')
for sqft_living:
# of intial rows: 19502
# after dropping rows: 19352
Outliers remaining:
price 0
bedrooms 0
bathrooms 147
sqft_living 0
sqft_lot 0
floors 0
condition 0
grade 0
zipcode 0
sqft_living15 176
sqft_lot15 0
code_view 0
code_waterfront 0
is_reno 0
bins_yrbuilt 0
bins_sqftbasement 0
bins_sqftabove 0
dtype: int64
# REMOVING OUTLIERS FROM BATHROOMS
drop_col = 'bathrooms'

print(f'for {drop_col}:')
print(f'# of intial rows: {len(df_norm)}')
df_norm.dropna(subset=[drop_col],inplace=True)
print(f'# after dropping rows: {len(df_norm)}')
print(f'\nOutliers remaining: \n{df_norm.isna().sum()}')
for bathrooms:
# of intial rows: 19352
# after dropping rows: 19205
Outliers remaining:
price 0
bedrooms 0
bathrooms 0
sqft_living 0
sqft_lot 0
floors 0
condition 0
grade 0
zipcode 0
sqft_living15 152
sqft_lot15 0
code_view 0
code_waterfront 0
is_reno 0
bins_yrbuilt 0
bins_sqftbasement 0
bins_sqftabove 0
dtype: int64
drop_col = 'sqft_living15'

print(f'for {drop_col}:')
print(f'# of intial rows: {len(df_norm)}')
df_norm.dropna(subset=[drop_col],inplace=True)
print(f'# after dropping rows: {len(df_norm)}')
print(f'\nOutliers remaining: \n{df_norm.isna().sum()}')
for sqft_living15:
# of intial rows: 19205
# after dropping rows: 19053
Outliers remaining:
price 0
bedrooms 0
bathrooms 0
sqft_living 0
sqft_lot 0
floors 0
condition 0
grade 0
zipcode 0
sqft_living15 0
sqft_lot15 0
code_view 0
code_waterfront 0
is_reno 0
bins_yrbuilt 0
bins_sqftbasement 0
bins_sqftabove 0
dtype: int64
# ADDING OUTLIER REMOVAL FROM preprocessing.RobuseScaler
from sklearn.preprocessing import RobustScaler

robscaler = RobustScaler()
robscaler
RobustScaler(copy=True, quantile_range=(25.0, 75.0), with_centering=True,
with_scaling=True)
vars_to_scale = ['sqft_living','sqft_lot','sqft_living15','sqft_lot15','bedrooms','bathrooms']

for col in vars_to_scale:

    col_data = np.array(np.array(df_norm[col]))
    res = robscaler.fit_transform(col_data.reshape(-1,1)) #,df['price'])
    df_norm['sca_'+col] = res.flatten()
# IF DROPPING VARS UNCOMMENT BELOW
# df_norm.drop(vars_to_scale,axis=1,inplace=True)df_norm.info()<class 'pandas.core.frame.DataFrame'>
Int64Index: 19053 entries, 0 to 21596
Data columns (total 23 columns):
price 19053 non-null float64
bedrooms 19053 non-null float64
bathrooms 19053 non-null float64
sqft_living 19053 non-null float64
sqft_lot 19053 non-null int64
floors 19053 non-null float64
condition 19053 non-null int64
grade 19053 non-null int64
zipcode 19053 non-null category
sqft_living15 19053 non-null float64
sqft_lot15 19053 non-null int64
code_view 19053 non-null int8
code_waterfront 19053 non-null int8
is_reno 19053 non-null int64
bins_yrbuilt 19053 non-null category
bins_sqftbasement 19053 non-null category
bins_sqftabove 19053 non-null category
sca_sqft_living 19053 non-null float64
sca_sqft_lot 19053 non-null float64
sca_sqft_living15 19053 non-null float64
sca_sqft_lot15 19053 non-null float64
sca_bedrooms 19053 non-null float64
sca_bathrooms 19053 non-null float64
dtypes: category(4), float64(12), int64(5), int8(2)
memory usage: 2.7 MB
df_norm.head().dataframe tbody tr th {
vertical-align: top;
}
.dataframe thead th {
text-align: right;
}
| price | bedrooms | bathrooms | sqft_living | sqft_lot | floors | condition | grade | zipcode | sqft_living15 | ... | is_reno | bins_yrbuilt | bins_sqftbasement | bins_sqftabove | sca_sqft_living | sca_sqft_lot | sca_sqft_living15 | sca_sqft_lot15 | sca_bedrooms | sca_bathrooms | |
|---|---|---|---|---|---|---|---|---|---|---|---|---|---|---|---|---|---|---|---|---|---|
| 0 | 221900.0 | 3.0 | 1.00 | 1180.0 | 5650 | 1.0 | 3 | 7 | 98178 | 1340.0 | ... | 0 | (1950.0, 1960.0] | (-inf, 1.0] | (1000.0, 1500.0] | -0.663265 | -0.355075 | -0.569620 | -0.391872 | 0.0 | -1.00 |
| 1 | 538000.0 | 3.0 | 2.25 | 2570.0 | 7242 | 2.0 | 3 | 7 | 98125 | 1690.0 | ... | 1 | (1950.0, 1960.0] | (1.0, 501.0] | (2000.0, 2500.0] | 0.755102 | -0.047858 | -0.126582 | 0.026953 | 0.0 | 0.25 |
| 2 | 180000.0 | 2.0 | 1.00 | 770.0 | 10000 | 1.0 | 3 | 6 | 98028 | 2720.0 | ... | 0 | (1930.0, 1940.0] | (-inf, 1.0] | (500.0, 1000.0] | -1.081633 | 0.484369 | 1.177215 | 0.116024 | -1.0 | -1.00 |
| 3 | 604000.0 | 4.0 | 3.00 | 1960.0 | 5000 | 1.0 | 5 | 7 | 98136 | 1360.0 | ... | 0 | (1960.0, 1970.0] | (501.0, 1001.0] | (1000.0, 1500.0] | 0.132653 | -0.480509 | -0.544304 | -0.528743 | 1.0 | 1.00 |
| 4 | 510000.0 | 3.0 | 2.00 | 1680.0 | 8080 | 1.0 | 3 | 8 | 98074 | 1800.0 | ... | 0 | (1980.0, 1990.0] | (-inf, 1.0] | (1500.0, 2000.0] | -0.153061 | 0.113856 | 0.012658 | -0.001685 | 0.0 | 0.00 |
5 rows × 23 columns
# plt.style.use('fivethirtyeight')
plot_hist_scat_sns(df_norm)df_norm.info()<class 'pandas.core.frame.DataFrame'>
Int64Index: 19053 entries, 0 to 21596
Data columns (total 23 columns):
price 19053 non-null float64
bedrooms 19053 non-null float64
bathrooms 19053 non-null float64
sqft_living 19053 non-null float64
sqft_lot 19053 non-null int64
floors 19053 non-null float64
condition 19053 non-null int64
grade 19053 non-null int64
zipcode 19053 non-null category
sqft_living15 19053 non-null float64
sqft_lot15 19053 non-null int64
code_view 19053 non-null int8
code_waterfront 19053 non-null int8
is_reno 19053 non-null int64
bins_yrbuilt 19053 non-null category
bins_sqftbasement 19053 non-null category
bins_sqftabove 19053 non-null category
sca_sqft_living 19053 non-null float64
sca_sqft_lot 19053 non-null float64
sca_sqft_living15 19053 non-null float64
sca_sqft_lot15 19053 non-null float64
sca_bedrooms 19053 non-null float64
sca_bathrooms 19053 non-null float64
dtypes: category(4), float64(12), int64(5), int8(2)
memory usage: 2.7 MB
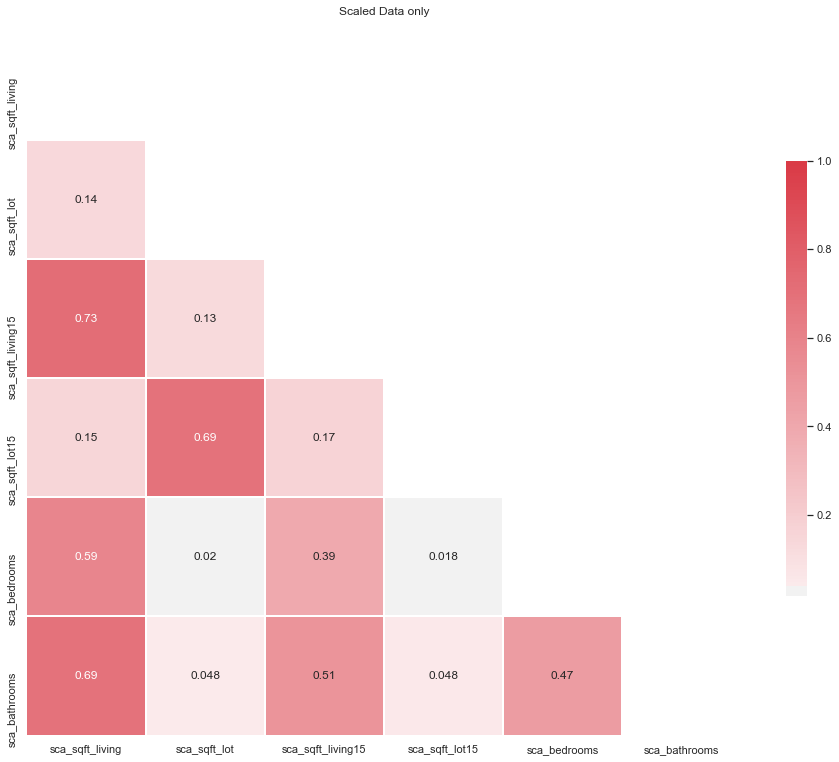
multiplot(df_norm.filter(regex='sca',axis=1))
plt.title('Scaled Data only')
Text(0.5, 1.0, 'Scaled Data only')
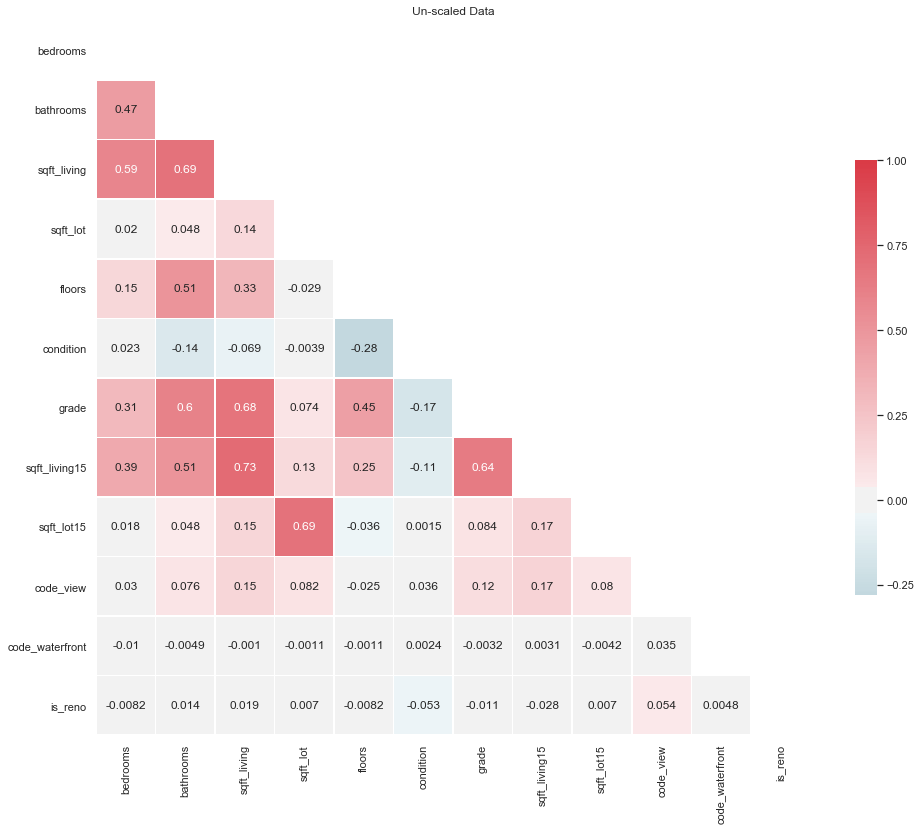
X =df_norm.loc[:,~(df_norm.columns.str.startswith('sca'))]
multiplot(X.drop('price',axis=1))
plt.title('Un-scaled Data')
X=[]# DEFINING DATASET TO RUN (df_run)
df_run = df_norm.copy()
# df_run.to_csv(data_filepath+'df_run_pre_codes.csv')
df_run.info()<class 'pandas.core.frame.DataFrame'>
Int64Index: 19053 entries, 0 to 21596
Data columns (total 23 columns):
price 19053 non-null float64
bedrooms 19053 non-null float64
bathrooms 19053 non-null float64
sqft_living 19053 non-null float64
sqft_lot 19053 non-null int64
floors 19053 non-null float64
condition 19053 non-null int64
grade 19053 non-null int64
zipcode 19053 non-null category
sqft_living15 19053 non-null float64
sqft_lot15 19053 non-null int64
code_view 19053 non-null int8
code_waterfront 19053 non-null int8
is_reno 19053 non-null int64
bins_yrbuilt 19053 non-null category
bins_sqftbasement 19053 non-null category
bins_sqftabove 19053 non-null category
sca_sqft_living 19053 non-null float64
sca_sqft_lot 19053 non-null float64
sca_sqft_living15 19053 non-null float64
sca_sqft_lot15 19053 non-null float64
sca_bedrooms 19053 non-null float64
sca_bathrooms 19053 non-null float64
dtypes: category(4), float64(12), int64(5), int8(2)
memory usage: 2.7 MB
df_filt = pd.DataFrame({})

df_filt = df_run.filter(regex=('bins_'),axis =1).copy()
df_filt['zipcode']=df_run['zipcode'].copy()
df_filt.info()
<class 'pandas.core.frame.DataFrame'>
Int64Index: 19053 entries, 0 to 21596
Data columns (total 4 columns):
bins_yrbuilt 19053 non-null category
bins_sqftbasement 19053 non-null category
bins_sqftabove 19053 non-null category
zipcode 19053 non-null category
dtypes: category(4)
memory usage: 228.2 KB
df_norm.head().dataframe tbody tr th {
vertical-align: top;
}
.dataframe thead th {
text-align: right;
}
| price | bedrooms | bathrooms | sqft_living | sqft_lot | floors | condition | grade | zipcode | sqft_living15 | ... | is_reno | bins_yrbuilt | bins_sqftbasement | bins_sqftabove | sca_sqft_living | sca_sqft_lot | sca_sqft_living15 | sca_sqft_lot15 | sca_bedrooms | sca_bathrooms | |
|---|---|---|---|---|---|---|---|---|---|---|---|---|---|---|---|---|---|---|---|---|---|
| 0 | 221900.0 | 3.0 | 1.00 | 1180.0 | 5650 | 1.0 | 3 | 7 | 98178 | 1340.0 | ... | 0 | (1950.0, 1960.0] | (-inf, 1.0] | (1000.0, 1500.0] | -0.663265 | -0.355075 | -0.569620 | -0.391872 | 0.0 | -1.00 |
| 1 | 538000.0 | 3.0 | 2.25 | 2570.0 | 7242 | 2.0 | 3 | 7 | 98125 | 1690.0 | ... | 1 | (1950.0, 1960.0] | (1.0, 501.0] | (2000.0, 2500.0] | 0.755102 | -0.047858 | -0.126582 | 0.026953 | 0.0 | 0.25 |
| 2 | 180000.0 | 2.0 | 1.00 | 770.0 | 10000 | 1.0 | 3 | 6 | 98028 | 2720.0 | ... | 0 | (1930.0, 1940.0] | (-inf, 1.0] | (500.0, 1000.0] | -1.081633 | 0.484369 | 1.177215 | 0.116024 | -1.0 | -1.00 |
| 3 | 604000.0 | 4.0 | 3.00 | 1960.0 | 5000 | 1.0 | 5 | 7 | 98136 | 1360.0 | ... | 0 | (1960.0, 1970.0] | (501.0, 1001.0] | (1000.0, 1500.0] | 0.132653 | -0.480509 | -0.544304 | -0.528743 | 1.0 | 1.00 |
| 4 | 510000.0 | 3.0 | 2.00 | 1680.0 | 8080 | 1.0 | 3 | 8 | 98074 | 1800.0 | ... | 0 | (1980.0, 1990.0] | (-inf, 1.0] | (1500.0, 2000.0] | -0.153061 | 0.113856 | 0.012658 | -0.001685 | 0.0 | 0.00 |
5 rows × 23 columns
# Creating binned vars cat codes
for col in df_filt:
    df_filt['code'+col] = df_filt[col].cat.codes
    df_filt.drop(col,axis=1,inplace=True)
df_filt.info()
<class 'pandas.core.frame.DataFrame'>
Int64Index: 19053 entries, 0 to 21596
Data columns (total 4 columns):
codebins_yrbuilt 19053 non-null int8
codebins_sqftbasement 19053 non-null int8
codebins_sqftabove 19053 non-null int8
codezipcode 19053 non-null int8
dtypes: int8(4)
memory usage: 223.3 KB
df_filt.head().dataframe tbody tr th {
vertical-align: top;
}
.dataframe thead th {
text-align: right;
}
| codebins_yrbuilt | codebins_sqftbasement | codebins_sqftabove | codezipcode | |
|---|---|---|---|---|
| 0 | 5 | 0 | 2 | 66 |
| 1 | 5 | 1 | 4 | 55 |
| 2 | 3 | 0 | 1 | 16 |
| 3 | 6 | 2 | 2 | 58 |
| 4 | 8 | 0 | 3 | 37 |
# Concatenate codebins from df_filt + df_run
df_run = pd.concat([df_run, df_filt],axis=1)  #).filter(regex=('code'))],axis=1)
df_run.info()
<class 'pandas.core.frame.DataFrame'>
Int64Index: 19053 entries, 0 to 21596
Data columns (total 27 columns):
price 19053 non-null float64
bedrooms 19053 non-null float64
bathrooms 19053 non-null float64
sqft_living 19053 non-null float64
sqft_lot 19053 non-null int64
floors 19053 non-null float64
condition 19053 non-null int64
grade 19053 non-null int64
zipcode 19053 non-null category
sqft_living15 19053 non-null float64
sqft_lot15 19053 non-null int64
code_view 19053 non-null int8
code_waterfront 19053 non-null int8
is_reno 19053 non-null int64
bins_yrbuilt 19053 non-null category
bins_sqftbasement 19053 non-null category
bins_sqftabove 19053 non-null category
sca_sqft_living 19053 non-null float64
sca_sqft_lot 19053 non-null float64
sca_sqft_living15 19053 non-null float64
sca_sqft_lot15 19053 non-null float64
sca_bedrooms 19053 non-null float64
sca_bathrooms 19053 non-null float64
codebins_yrbuilt 19053 non-null int8
codebins_sqftbasement 19053 non-null int8
codebins_sqftabove 19053 non-null int8
codezipcode 19053 non-null int8
dtypes: category(4), float64(12), int64(5), int8(6)
memory usage: 2.8 MB
df_run.head(2).dataframe tbody tr th {
vertical-align: top;
}
.dataframe thead th {
text-align: right;
}
| price | bedrooms | bathrooms | sqft_living | sqft_lot | floors | condition | grade | zipcode | sqft_living15 | ... | sca_sqft_living | sca_sqft_lot | sca_sqft_living15 | sca_sqft_lot15 | sca_bedrooms | sca_bathrooms | codebins_yrbuilt | codebins_sqftbasement | codebins_sqftabove | codezipcode | |
|---|---|---|---|---|---|---|---|---|---|---|---|---|---|---|---|---|---|---|---|---|---|
| 0 | 221900.0 | 3.0 | 1.00 | 1180.0 | 5650 | 1.0 | 3 | 7 | 98178 | 1340.0 | ... | -0.663265 | -0.355075 | -0.569620 | -0.391872 | 0.0 | -1.00 | 5 | 0 | 2 | 66 |
| 1 | 538000.0 | 3.0 | 2.25 | 2570.0 | 7242 | 2.0 | 3 | 7 | 98125 | 1690.0 | ... | 0.755102 | -0.047858 | -0.126582 | 0.026953 | 0.0 | 0.25 | 5 | 1 | 4 | 55 |
2 rows × 27 columns
# Select columns that do not contain the string 'logZ'
df_run =df_run.loc[:,~(df_run.columns.str.startswith('logZ'))]- Use MinMaxScaler to get on same scale
- Use RFE to find the best features
- Get ranking of feature importance (from both scaled and unscaled data)
from sklearn.feature_selection import RFE
from sklearn.linear_model import LinearRegression
from sklearn.preprocessing import MinMaxScaler

import sklearn.metrics as metricsdf_run.info()<class 'pandas.core.frame.DataFrame'>
Int64Index: 19053 entries, 0 to 21596
Data columns (total 27 columns):
price 19053 non-null float64
bedrooms 19053 non-null float64
bathrooms 19053 non-null float64
sqft_living 19053 non-null float64
sqft_lot 19053 non-null int64
floors 19053 non-null float64
condition 19053 non-null int64
grade 19053 non-null int64
zipcode 19053 non-null category
sqft_living15 19053 non-null float64
sqft_lot15 19053 non-null int64
code_view 19053 non-null int8
code_waterfront 19053 non-null int8
is_reno 19053 non-null int64
bins_yrbuilt 19053 non-null category
bins_sqftbasement 19053 non-null category
bins_sqftabove 19053 non-null category
sca_sqft_living 19053 non-null float64
sca_sqft_lot 19053 non-null float64
sca_sqft_living15 19053 non-null float64
sca_sqft_lot15 19053 non-null float64
sca_bedrooms 19053 non-null float64
sca_bathrooms 19053 non-null float64
codebins_yrbuilt 19053 non-null int8
codebins_sqftbasement 19053 non-null int8
codebins_sqftabove 19053 non-null int8
codezipcode 19053 non-null int8
dtypes: category(4), float64(12), int64(5), int8(6)
memory usage: 2.8 MB
df.columns = [col.lower().replace(' ','_') for col in df.columns]
df.head().dataframe tbody tr th {
vertical-align: top;
}
.dataframe thead th {
text-align: right;
}
| price | bedrooms | bathrooms | sqft_living | sqft_lot | floors | condition | grade | zipcode | sqft_living15 | sqft_lot15 | code_view | code_waterfront | is_reno | bins_yrbuilt | bins_sqftbasement | bins_sqftabove | |
|---|---|---|---|---|---|---|---|---|---|---|---|---|---|---|---|---|---|
| 0 | 221900.0 | 3 | 1.00 | 1180 | 5650 | 1.0 | 3 | 7 | 98178 | 1340 | 5650 | 0 | 2 | 0 | (1950.0, 1960.0] | (-inf, 1.0] | (1000.0, 1500.0] |
| 1 | 538000.0 | 3 | 2.25 | 2570 | 7242 | 2.0 | 3 | 7 | 98125 | 1690 | 7639 | 0 | 0 | 1 | (1950.0, 1960.0] | (1.0, 501.0] | (2000.0, 2500.0] |
| 2 | 180000.0 | 2 | 1.00 | 770 | 10000 | 1.0 | 3 | 6 | 98028 | 2720 | 8062 | 0 | 0 | 0 | (1930.0, 1940.0] | (-inf, 1.0] | (500.0, 1000.0] |
| 3 | 604000.0 | 4 | 3.00 | 1960 | 5000 | 1.0 | 5 | 7 | 98136 | 1360 | 5000 | 0 | 0 | 0 | (1960.0, 1970.0] | (501.0, 1001.0] | (1000.0, 1500.0] |
| 4 | 510000.0 | 3 | 2.00 | 1680 | 8080 | 1.0 | 3 | 8 | 98074 | 1800 | 7503 | 0 | 0 | 0 | (1980.0, 1990.0] | (-inf, 1.0] | (1500.0, 2000.0] |
# Define selector function combining RFE and linear regression
linreg = LinearRegression()
selector = RFE(linreg, n_features_to_select=1)

# Drop already scaled variables for this feature testing
X =df_run.loc[:,~(df_run.columns.str.startswith(('bins','zip')))]
X = X.drop('price',axis=1)

# RUNNING RFE ON THE UNSCALED DATA(DEMONSTRATION)
Y = df_run['price']
# Y = df_run['logz_price']
# X = df_run.drop(['price'],axis=1)
# Checking X
X.info()<class 'pandas.core.frame.DataFrame'>
Int64Index: 19053 entries, 0 to 21596
Data columns (total 22 columns):
bedrooms 19053 non-null float64
bathrooms 19053 non-null float64
sqft_living 19053 non-null float64
sqft_lot 19053 non-null int64
floors 19053 non-null float64
condition 19053 non-null int64
grade 19053 non-null int64
sqft_living15 19053 non-null float64
sqft_lot15 19053 non-null int64
code_view 19053 non-null int8
code_waterfront 19053 non-null int8
is_reno 19053 non-null int64
sca_sqft_living 19053 non-null float64
sca_sqft_lot 19053 non-null float64
sca_sqft_living15 19053 non-null float64
sca_sqft_lot15 19053 non-null float64
sca_bedrooms 19053 non-null float64
sca_bathrooms 19053 non-null float64
codebins_yrbuilt 19053 non-null int8
codebins_sqftbasement 19053 non-null int8
codebins_sqftabove 19053 non-null int8
codezipcode 19053 non-null int8
dtypes: float64(11), int64(5), int8(6)
memory usage: 2.6 MB
# Run regressions on X,Y
selector = selector.fit(X,Y)

# Saving unscaled rankings for demo purposes
no_scale = selector.ranking_
# Scale all variables to value between 0-1 to use RFE to determine which features are the most important for determining price?
from sklearn.preprocessing import MinMaxScaler
scaler = MinMaxScaler()
# Scale the data before running RFE
print('Consider revisiting this step and dummy-coding zipcode.')
# ONLY SCALE NON-CATEGORICAL, ONE-HOT CATEGORICAL
scaler.fit(X,Y)
scaled_data = scaler.transform(X)
scaled_data.shapeConsider revisiting this step and dummy-coding zipcode.
(19053, 22)
# Running RFE with scaled data
selector = selector.fit(scaled_data, Y)
scaled = selector.ranking_
type(scaled)
numpy.ndarray
# Create a dataframe with the ranked values of each feature for both scaled and unscaled data
best_features = pd.DataFrame({'columns':X.columns, 'scaled_rank' : scaled,'unscaled_rank':no_scale})
best_features.set_index('columns',inplace=True)
# Display dataframe (sorted based on unscaled rank)
best_features.sort_values('unscaled_rank').dataframe tbody tr th {
vertical-align: top;
}
.dataframe thead th {
text-align: right;
}
| scaled_rank | unscaled_rank | |
|---|---|---|
| columns | ||
| grade | 1 | 1 |
| code_view | 8 | 2 |
| codebins_sqftbasement | 11 | 3 |
| codebins_sqftabove | 21 | 4 |
| floors | 9 | 5 |
| codebins_yrbuilt | 3 | 6 |
| sca_bathrooms | 15 | 7 |
| is_reno | 20 | 8 |
| condition | 13 | 9 |
| sca_bedrooms | 16 | 10 |
| bathrooms | 18 | 11 |
| bedrooms | 19 | 12 |
| code_waterfront | 22 | 13 |
| codezipcode | 17 | 14 |
| sqft_living | 2 | 15 |
| sqft_living15 | 7 | 16 |
| sqft_lot15 | 14 | 17 |
| sqft_lot | 10 | 18 |
| sca_sqft_living15 | 12 | 19 |
| sca_sqft_living | 4 | 20 |
| sca_sqft_lot15 | 6 | 21 |
| sca_sqft_lot | 5 | 22 |
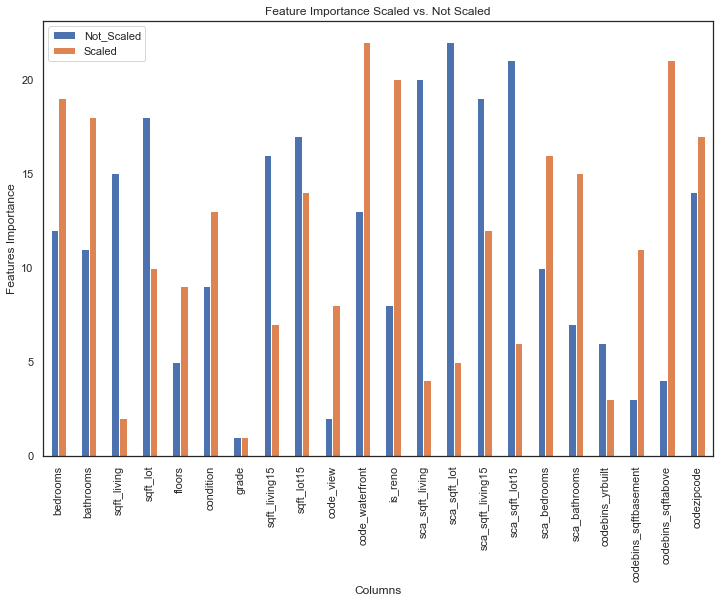
# Plot the difference in feature importance between analyzing scaled and unscaled data.
# For demonstration purposes.
features = pd.DataFrame({'Columns':X.columns, 'Not_Scaled':no_scale, 'Scaled':scaled})
# PLot the difference between
ax = features.set_index('Columns').plot(kind = 'bar',figsize=(12,8))
ax.set_title('Feature Importance Scaled vs. Not Scaled')
ax.set_ylabel('Features Importance')
Text(0, 0.5, 'Features Importance')
X.info()<class 'pandas.core.frame.DataFrame'>
Int64Index: 19053 entries, 0 to 21596
Data columns (total 22 columns):
bedrooms 19053 non-null float64
bathrooms 19053 non-null float64
sqft_living 19053 non-null float64
sqft_lot 19053 non-null int64
floors 19053 non-null float64
condition 19053 non-null int64
grade 19053 non-null int64
sqft_living15 19053 non-null float64
sqft_lot15 19053 non-null int64
code_view 19053 non-null int8
code_waterfront 19053 non-null int8
is_reno 19053 non-null int64
sca_sqft_living 19053 non-null float64
sca_sqft_lot 19053 non-null float64
sca_sqft_living15 19053 non-null float64
sca_sqft_lot15 19053 non-null float64
sca_bedrooms 19053 non-null float64
sca_bathrooms 19053 non-null float64
codebins_yrbuilt 19053 non-null int8
codebins_sqftbasement 19053 non-null int8
codebins_sqftabove 19053 non-null int8
codezipcode 19053 non-null int8
dtypes: float64(11), int64(5), int8(6)
memory usage: 2.6 MB
r_squared = []
for x in range(1, len(X.columns)):
    selector = RFE(linreg, n_features_to_select=x)
    selector.fit(scaled_data, Y)
    linreg.fit(X[X.columns[selector.support_]], Y)
    r_sq = linreg.score(X[X.columns[selector.support_]], Y)
    r_squared.append(r_sq)
# r_squaredfrom sklearn.metrics import mean_squared_error
mse=[]
for x in range(1, len(X.columns)):
selector = RFE(linreg, n_features_to_select=x)
selector.fit(scaled_data, Y)
linreg.fit(X[X.columns[selector.support_]], Y)
y_pred = linreg.predict(X[X.columns[selector.support_]])
mse.append(mean_squared_error(Y, y_pred))
# msefrom sklearn.metrics import mean_squared_error
fig = plt.figure(figsize=(12 ,6))
ax1 = plt.subplot(121)
ax1.plot(range(1, len(X.columns)), r_squared)
ax1.set_ylabel('R_Squared')
ax1.set_xlabel('Number of Features')
ax1.grid()
ax2 = plt.subplot(122)
ax2.plot(range(1,len(mse)+1), mse )
ax2.set_ylabel('MSE')
ax2.set_xlabel('Number of Features',fontsize=20)
ax2.grid()r_squared = []
for x in range(1, len(X.columns)):
selector = RFE(linreg, n_features_to_select=x)
selector.fit(X, Y)
linreg.fit(X[X.columns[selector.support_]], Y)
r_sq = linreg.score(X[X.columns[selector.support_]], Y)
r_squared.append(r_sq)
from sklearn.metrics import mean_squared_error
mse=[]
for x in range(1, len(X.columns)):
selector = RFE(linreg, n_features_to_select=x)
selector.fit(X, Y)
linreg.fit(X[X.columns[selector.support_]], Y)
y_pred = linreg.predict(X[X.columns[selector.support_]])
mse.append(mean_squared_error(Y, y_pred))
fig = plt.figure(figsize=(12 ,6))
ax1 = plt.subplot(121)
ax1.plot(range(1, len(X.columns)), r_squared)
ax1.set_ylabel('R_Squared')
ax1.set_xlabel('Number of Features')
ax1.grid()
ax2 = plt.subplot(122)
ax2.plot(range(1,len(mse)+1), mse )
ax2.set_ylabel('MSE')
ax2.set_xlabel('Number of Features')
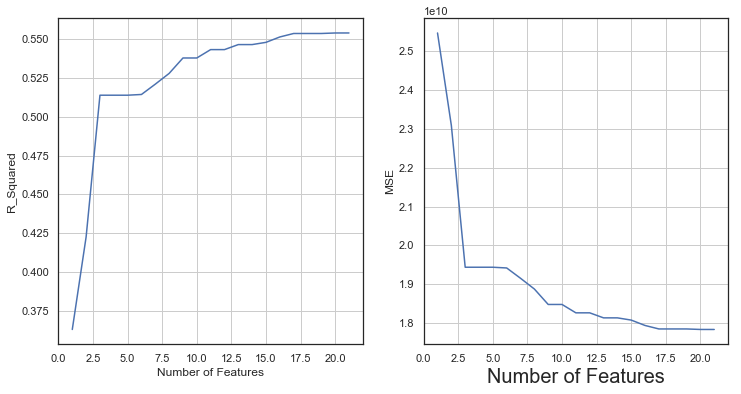
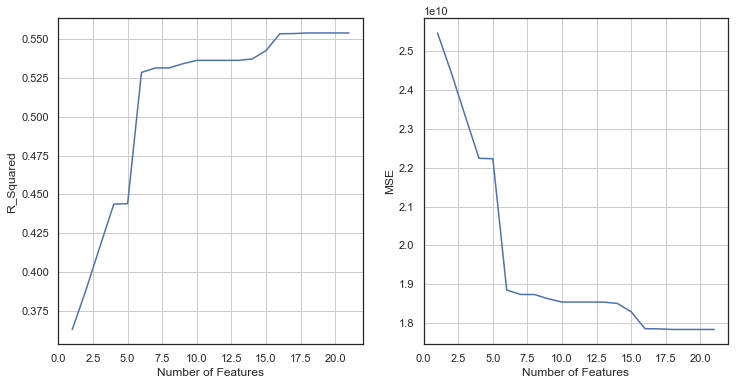
ax2.grid() - The above figure is indicating that right now my best possible R2 with the lowest # of features would be with 6 predictors (judging unscaled data).
- Now examine the sorted best_features dataframe to see which 6 to use
cat_cols = ['bedrooms','bathrooms']

from sklearn.preprocessing import LabelEncoder
encoder = LabelEncoder()
new_df = pd.DataFrame()

for col in cat_cols:
    new_df[col] = encoder.fit_transform(df[col])
new_df.head().dataframe tbody tr th {
vertical-align: top;
}
.dataframe thead th {
text-align: right;
}
| bedrooms | bathrooms | |
|---|---|---|
| 0 | 2 | 2 |
| 1 | 2 | 7 |
| 2 | 1 | 2 |
| 3 | 3 | 10 |
| 4 | 2 | 6 |
best_features.sort_values('scaled_rank').dataframe tbody tr th {
vertical-align: top;
}
.dataframe thead th {
text-align: right;
}
| scaled_rank | unscaled_rank | |
|---|---|---|
| columns | ||
| grade | 1 | 1 |
| sqft_living | 2 | 15 |
| codebins_yrbuilt | 3 | 6 |
| sca_sqft_living | 4 | 20 |
| sca_sqft_lot | 5 | 22 |
| sca_sqft_lot15 | 6 | 21 |
| sqft_living15 | 7 | 16 |
| code_view | 8 | 2 |
| floors | 9 | 5 |
| sqft_lot | 10 | 18 |
| codebins_sqftbasement | 11 | 3 |
| sca_sqft_living15 | 12 | 19 |
| condition | 13 | 9 |
| sqft_lot15 | 14 | 17 |
| sca_bathrooms | 15 | 7 |
| sca_bedrooms | 16 | 10 |
| codezipcode | 17 | 14 |
| bathrooms | 18 | 11 |
| bedrooms | 19 | 12 |
| is_reno | 20 | 8 |
| codebins_sqftabove | 21 | 4 |
| code_waterfront | 22 | 13 |
# Pull out the 6 best features via ranking
best_num_feat = 6
selected_features = best_features.sort_values('unscaled_rank')[0:best_num_feat]
selected_features.dataframe tbody tr th {
vertical-align: top;
}
.dataframe thead th {
text-align: right;
}
| scaled_rank | unscaled_rank | |
|---|---|---|
| columns | ||
| grade | 1 | 1 |
| code_view | 8 | 2 |
| codebins_sqftbasement | 11 | 3 |
| codebins_sqftabove | 21 | 4 |
| floors | 9 | 5 |
| codebins_yrbuilt | 3 | 6 |
# USING UNSCALED
selected_features.index
Index(['grade', 'code_view', 'codebins_sqftbasement', 'codebins_sqftabove',
'floors', 'codebins_yrbuilt'],
dtype='object', name='columns')
# Check the columns of X
X[selected_features.index].head().dataframe tbody tr th {
vertical-align: top;
}
.dataframe thead th {
text-align: right;
}
| grade | code_view | codebins_sqftbasement | codebins_sqftabove | floors | codebins_yrbuilt | |
|---|---|---|---|---|---|---|
| 0 | 7 | 0 | 0 | 2 | 1.0 | 5 |
| 1 | 7 | 0 | 1 | 4 | 2.0 | 5 |
| 2 | 6 | 0 | 0 | 1 | 1.0 | 3 |
| 3 | 7 | 0 | 2 | 2 | 1.0 | 6 |
| 4 | 8 | 0 | 0 | 3 | 1.0 | 8 |
df_run.info()<class 'pandas.core.frame.DataFrame'>
Int64Index: 19053 entries, 0 to 21596
Data columns (total 27 columns):
price 19053 non-null float64
bedrooms 19053 non-null float64
bathrooms 19053 non-null float64
sqft_living 19053 non-null float64
sqft_lot 19053 non-null int64
floors 19053 non-null float64
condition 19053 non-null int64
grade 19053 non-null int64
zipcode 19053 non-null category
sqft_living15 19053 non-null float64
sqft_lot15 19053 non-null int64
code_view 19053 non-null int8
code_waterfront 19053 non-null int8
is_reno 19053 non-null int64
bins_yrbuilt 19053 non-null category
bins_sqftbasement 19053 non-null category
bins_sqftabove 19053 non-null category
sca_sqft_living 19053 non-null float64
sca_sqft_lot 19053 non-null float64
sca_sqft_living15 19053 non-null float64
sca_sqft_lot15 19053 non-null float64
sca_bedrooms 19053 non-null float64
sca_bathrooms 19053 non-null float64
codebins_yrbuilt 19053 non-null int8
codebins_sqftbasement 19053 non-null int8
codebins_sqftabove 19053 non-null int8
codezipcode 19053 non-null int8
dtypes: category(4), float64(12), int64(5), int8(6)
memory usage: 2.8 MB
# Running simple linear regression for each predictor on its own
import statsmodels.api as sm
import statsmodels.formula.api as smf
import scipy.stats as stats
import statsmodels.stats.api as sms


# log_price = np.log(df['price'])
# df['log_price'] = log_price

target_var = 'price'
col_names = df_run.drop(['price'],axis=1).columns

# Create results list for saving the output statstics for each predictor
results = [['ind_var', 'r_squared', 'intercept', 'slope', 'p-value' ]]

for idx, val in enumerate(col_names):

    # Use the names of the columns to determine format of forumla
    if val.startswith('code'):

        df_run[val] = df_run[val].astype('category').cat.as_ordered()
        f =f'{str(target_var)}~C({val})'

    elif val.startswith('bin'):

        df_run[val] = df_run[val].cat.as_ordered()
        f =f'{str(target_var)}~C({val})'

    else:

        f =f'{str(target_var)}~{val}'

    # Run the ols models
    model = smf.ols(formula=f, data=df_run).fit()
    model.summary()

    # Append results
    results.append([val, model.rsquared, model.params[0], model.params[1], model.pvalues[1] ])

# Turn results into dataframe with correct index and columns
res_df = pd.DataFrame(results)
res_df.columns = res_df.iloc[0]
res_df=res_df[1:]
res_df.set_index('ind_var',inplace=True)
res_df.sort_values('r_squared',ascending=False).dataframe tbody tr th {
vertical-align: top;
}
.dataframe thead th {
text-align: right;
}
| r_squared | intercept | slope | p-value | |
|---|---|---|---|---|
| ind_var | ||||
| codezipcode | 0.498102 | 280365 | -47520.3 | 0.0002275 |
| zipcode | 0.498102 | 280365 | -47520.3 | 0.0002275 |
| grade | 0.362959 | -454845 | 123114 | 0 |
| sqft_living | 0.347657 | 142997 | 168.572 | 0 |
| sca_sqft_living | 0.347657 | 451484 | 165200 | 0 |
| sca_sqft_living15 | 0.27516 | 449258 | 145953 | 0 |
| sqft_living15 | 0.27516 | 118553 | 184.751 | 0 |
| codebins_sqftabove | 0.225333 | 210050 | 141861 | 0.107357 |
| bins_sqftabove | 0.225333 | 210050 | 141861 | 0.107357 |
| bathrooms | 0.169802 | 215907 | 125027 | 0 |
| sca_bathrooms | 0.169802 | 465961 | 125027 | 0 |
| sca_bedrooms | 0.0717169 | 447998 | 68611.9 | 0 |
| bedrooms | 0.0717169 | 242163 | 68611.9 | 0 |
| floors | 0.0629911 | 330868 | 93475.5 | 1.61001e-271 |
| code_view | 0.0563913 | 455177 | 168640 | 1.60061e-43 |
| bins_sqftbasement | 0.0492165 | 442306 | 19843.1 | 3.81601e-06 |
| codebins_sqftbasement | 0.0492165 | 442306 | 19843.1 | 3.81601e-06 |
| codebins_yrbuilt | 0.0482952 | 543106 | -35754.2 | 0.000899441 |
| bins_yrbuilt | 0.0482952 | 543106 | -35754.2 | 0.000899441 |
| is_reno | 0.00765121 | 465065 | 103741 | 1.10517e-33 |
| sca_sqft_lot | 0.00581721 | 465533 | 2035.97 | 5.50156e-26 |
| sqft_lot | 0.00581721 | 462590 | 0.392892 | 5.50156e-26 |
| sqft_lot15 | 0.00411256 | 461884 | 0.518291 | 7.96816e-19 |
| sca_sqft_lot15 | 0.00411256 | 465777 | 2461.37 | 7.96816e-19 |
| code_waterfront | 0.00239512 | 467280 | 203173 | 1.64907e-11 |
| condition | 0.00235454 | 416978 | 14985.1 | 2.065e-11 |
# Initial variables for modeling
try_modeling = ['codezipcode', 'grade','sca_sqft_living', 'sca_sqft_living15']
# Hmm...realized there are redundant versions of variables and am just selecting the correct versions to use.- Variables that had high R_square with logz_price:
- New results = ['codezipcode', 'grade','sca_sqft_living', 'sca_sqft_living15']
try_modeling = try_modeling = ['codezipcode', 'grade','sca_sqft_living', 'sca_sqft_living16']
import statsmodels.api as sm
import statsmodels.formula.api as smf
import scipy.stats as stats
import statsmodels.stats.api as sms
from sklearn.preprocessing import MinMaxScaler

# # PUTTING TOGETHER THE PREDICTORS TO RUN IN THE REGRESSION
# ## Last min dummy vars []'cat_grade','cat_zipcode','cat_view','cat_bins_sqft_above','cat_bins_sqft_basement']
# dum_grades = pd.get_dummies(df_run['cat_grade'],prefix='gr').iloc[:,:-1]
# dum_view = pd.get_dummies(df_run['cat_view'], prefix='view').iloc[:,:-1]
# dum_sqft_above = pd.get_dummies(df_run['cat_bins_sqftabove'],prefix='sqftAb').iloc[:,:-1]
# dum_sqft_base = pd.get_dummies(df_run['cat_bins_sqftbasement'],prefix='sqftBa').iloc[:,:-1]


# RUNNING K-FOLD VALIDATION WITH STATSMODELS OLS.
# X = df_run.drop(['price','logZ_price'],axis=1)
# list_predictors = ['logZ_sqft_living','logZ_sqft_living15','bedrooms','bathrooms','floors']
# scaler = MinMaxScaler()
# sel_columns = selected_features.index
# Define X, Y
X = df_run[try_modeling]
# X.columns
Y = df_run['price']
# y = df_run['logZ_price']
# Get a list of predictor names string
list_predictors = [str(x) for x in X.columns]
list_predictors.append('intercept')
list_predictors['codezipcode', 'grade', 'sca_sqft_living', 'sca_sqft_living15', 'intercept']
# Comcatenate X,Y for OLS
df_run_ols = pd.concat([Y,X],axis=1)

# Import packages
import statsmodels.api as sm
import statsmodels.stats.api as sms
import statsmodels.formula.api as smf
import scipy.stats as stats

# Enter equation for selected predictors: (use C to run as categorical)
# f1 = 'price~C(codezipcode)+C(grade)+sca_sqft_living+sca_sqft_living15' # 0.8 r1 Adjusted
f1 = 'price~C(codezipcode)+grade+sca_sqft_living+sca_sqft_living15'

# Run model and report sumamry
model = smf.ols(formula=f1, data=df_run_ols).fit()
model.summary()| Dep. Variable: | price | R-squared: | 0.797 |
|---|---|---|---|
| Model: | OLS | Adj. R-squared: | 0.796 |
| Method: | Least Squares | F-statistic: | 1035. |
| Date: | Sat, 26 Oct 2019 | Prob (F-statistic): | 0.00 |
| Time: | 20:53:03 | Log-Likelihood: | -2.4441e+05 |
| No. Observations: | 19053 | AIC: | 4.890e+05 |
| Df Residuals: | 18980 | BIC: | 4.895e+05 |
| Df Model: | 72 | ||
| Covariance Type: | nonrobust |
| coef | std err | t | P>|t| | [0.025 | 0.975] | |
|---|---|---|---|---|---|---|
| Intercept | 5152.6368 | 8731.030 | 0.590 | 0.555 | -1.2e+04 | 2.23e+04 |
| C(codezipcode)[T.1] | 2.361e+04 | 8215.662 | 2.873 | 0.004 | 7503.139 | 3.97e+04 |
| C(codezipcode)[T.2] | 2341.0236 | 7378.061 | 0.317 | 0.751 | -1.21e+04 | 1.68e+04 |
| C(codezipcode)[T.3] | 5.114e+05 | 8885.250 | 57.560 | 0.000 | 4.94e+05 | 5.29e+05 |
| C(codezipcode)[T.4] | 3.405e+05 | 9150.155 | 37.213 | 0.000 | 3.23e+05 | 3.58e+05 |
| C(codezipcode)[T.5] | 2.802e+05 | 6825.525 | 41.045 | 0.000 | 2.67e+05 | 2.94e+05 |
| C(codezipcode)[T.6] | 2.573e+05 | 9464.329 | 27.187 | 0.000 | 2.39e+05 | 2.76e+05 |
| C(codezipcode)[T.7] | 2.557e+05 | 7457.922 | 34.291 | 0.000 | 2.41e+05 | 2.7e+05 |
| C(codezipcode)[T.8] | 1.054e+05 | 1.05e+04 | 10.074 | 0.000 | 8.49e+04 | 1.26e+05 |
| C(codezipcode)[T.9] | 1.348e+05 | 8258.863 | 16.319 | 0.000 | 1.19e+05 | 1.51e+05 |
| C(codezipcode)[T.10] | 1.282e+05 | 9852.210 | 13.014 | 0.000 | 1.09e+05 | 1.48e+05 |
| C(codezipcode)[T.11] | 8.965e+04 | 8371.036 | 10.710 | 0.000 | 7.32e+04 | 1.06e+05 |
| C(codezipcode)[T.12] | 4.869e+04 | 7811.281 | 6.234 | 0.000 | 3.34e+04 | 6.4e+04 |
| C(codezipcode)[T.13] | -2.103e+04 | 6398.367 | -3.287 | 0.001 | -3.36e+04 | -8487.932 |
| C(codezipcode)[T.14] | 1.723e+05 | 1.21e+04 | 14.294 | 0.000 | 1.49e+05 | 1.96e+05 |
| C(codezipcode)[T.15] | 1.893e+05 | 6900.034 | 27.438 | 0.000 | 1.76e+05 | 2.03e+05 |
| C(codezipcode)[T.16] | 1.282e+05 | 7366.804 | 17.401 | 0.000 | 1.14e+05 | 1.43e+05 |
| C(codezipcode)[T.17] | 2.198e+05 | 7223.982 | 30.430 | 0.000 | 2.06e+05 | 2.34e+05 |
| C(codezipcode)[T.18] | 907.7456 | 7534.878 | 0.120 | 0.904 | -1.39e+04 | 1.57e+04 |
| C(codezipcode)[T.19] | 1.147e+04 | 7391.085 | 1.552 | 0.121 | -3015.547 | 2.6e+04 |
| C(codezipcode)[T.20] | 3234.7083 | 9600.539 | 0.337 | 0.736 | -1.56e+04 | 2.21e+04 |
| C(codezipcode)[T.21] | 3.27e+05 | 6873.901 | 47.578 | 0.000 | 3.14e+05 | 3.41e+05 |
| C(codezipcode)[T.22] | 1.858e+05 | 6322.193 | 29.392 | 0.000 | 1.73e+05 | 1.98e+05 |
| C(codezipcode)[T.23] | 3.341e+04 | 6189.647 | 5.398 | 0.000 | 2.13e+04 | 4.55e+04 |
| C(codezipcode)[T.24] | 6.446e+05 | 3.72e+04 | 17.333 | 0.000 | 5.72e+05 | 7.17e+05 |
| C(codezipcode)[T.25] | 4.396e+05 | 8998.802 | 48.846 | 0.000 | 4.22e+05 | 4.57e+05 |
| C(codezipcode)[T.26] | 1.342e+04 | 6249.489 | 2.147 | 0.032 | 1166.174 | 2.57e+04 |
| C(codezipcode)[T.27] | 1.194e+05 | 7939.547 | 15.036 | 0.000 | 1.04e+05 | 1.35e+05 |
| C(codezipcode)[T.28] | 2.492e+05 | 6292.625 | 39.602 | 0.000 | 2.37e+05 | 2.62e+05 |
| C(codezipcode)[T.29] | 2.347e+05 | 6937.430 | 33.827 | 0.000 | 2.21e+05 | 2.48e+05 |
| C(codezipcode)[T.30] | 4.06e+04 | 7516.748 | 5.402 | 0.000 | 2.59e+04 | 5.53e+04 |
| C(codezipcode)[T.31] | 1.093e+05 | 6693.020 | 16.330 | 0.000 | 9.62e+04 | 1.22e+05 |
| C(codezipcode)[T.32] | 3.932e+04 | 6534.860 | 6.018 | 0.000 | 2.65e+04 | 5.21e+04 |
| C(codezipcode)[T.33] | 9.51e+04 | 6589.751 | 14.431 | 0.000 | 8.22e+04 | 1.08e+05 |
| C(codezipcode)[T.34] | 1.201e+05 | 7412.001 | 16.199 | 0.000 | 1.06e+05 | 1.35e+05 |
| C(codezipcode)[T.35] | 1.975e+05 | 9885.649 | 19.982 | 0.000 | 1.78e+05 | 2.17e+05 |
| C(codezipcode)[T.36] | 1.742e+05 | 7612.251 | 22.880 | 0.000 | 1.59e+05 | 1.89e+05 |
| C(codezipcode)[T.37] | 2.137e+05 | 6770.358 | 31.559 | 0.000 | 2e+05 | 2.27e+05 |
| C(codezipcode)[T.38] | 2.286e+05 | 7438.126 | 30.732 | 0.000 | 2.14e+05 | 2.43e+05 |
| C(codezipcode)[T.39] | 1.781e+05 | 8684.281 | 20.503 | 0.000 | 1.61e+05 | 1.95e+05 |
| C(codezipcode)[T.40] | -1.148e+04 | 6965.141 | -1.648 | 0.099 | -2.51e+04 | 2173.340 |
| C(codezipcode)[T.41] | 4.05e+05 | 1.11e+04 | 36.408 | 0.000 | 3.83e+05 | 4.27e+05 |
| C(codezipcode)[T.42] | 3.297e+05 | 6239.985 | 52.830 | 0.000 | 3.17e+05 | 3.42e+05 |
| C(codezipcode)[T.43] | 3.908e+05 | 8585.748 | 45.522 | 0.000 | 3.74e+05 | 4.08e+05 |
| C(codezipcode)[T.44] | 1.203e+05 | 7095.802 | 16.956 | 0.000 | 1.06e+05 | 1.34e+05 |
| C(codezipcode)[T.45] | 3.252e+05 | 7546.464 | 43.096 | 0.000 | 3.1e+05 | 3.4e+05 |
| C(codezipcode)[T.46] | 1.193e+05 | 8417.753 | 14.169 | 0.000 | 1.03e+05 | 1.36e+05 |
| C(codezipcode)[T.47] | 4.236e+05 | 1.13e+04 | 37.566 | 0.000 | 4.01e+05 | 4.46e+05 |
| C(codezipcode)[T.48] | 4.364e+05 | 8724.465 | 50.019 | 0.000 | 4.19e+05 | 4.53e+05 |
| C(codezipcode)[T.49] | 3.271e+05 | 6266.348 | 52.207 | 0.000 | 3.15e+05 | 3.39e+05 |
| C(codezipcode)[T.50] | 3.16e+05 | 7192.406 | 43.936 | 0.000 | 3.02e+05 | 3.3e+05 |
| C(codezipcode)[T.51] | 3.237e+05 | 6318.347 | 51.230 | 0.000 | 3.11e+05 | 3.36e+05 |
| C(codezipcode)[T.52] | 1.744e+05 | 6436.099 | 27.102 | 0.000 | 1.62e+05 | 1.87e+05 |
| C(codezipcode)[T.53] | 4.177e+05 | 9094.361 | 45.931 | 0.000 | 4e+05 | 4.36e+05 |
| C(codezipcode)[T.54] | 3.163e+05 | 7509.896 | 42.116 | 0.000 | 3.02e+05 | 3.31e+05 |
| C(codezipcode)[T.55] | 2.019e+05 | 6737.030 | 29.975 | 0.000 | 1.89e+05 | 2.15e+05 |
| C(codezipcode)[T.56] | 2.127e+05 | 6999.314 | 30.390 | 0.000 | 1.99e+05 | 2.26e+05 |
| C(codezipcode)[T.57] | 1.563e+05 | 6413.853 | 24.371 | 0.000 | 1.44e+05 | 1.69e+05 |
| C(codezipcode)[T.58] | 2.722e+05 | 7617.985 | 35.728 | 0.000 | 2.57e+05 | 2.87e+05 |
| C(codezipcode)[T.59] | 2.5e+05 | 7152.431 | 34.956 | 0.000 | 2.36e+05 | 2.64e+05 |
| C(codezipcode)[T.60] | 1.264e+05 | 7419.402 | 17.037 | 0.000 | 1.12e+05 | 1.41e+05 |
| C(codezipcode)[T.61] | 5.933e+04 | 1.32e+04 | 4.489 | 0.000 | 3.34e+04 | 8.52e+04 |
| C(codezipcode)[T.62] | 1.486e+05 | 6562.321 | 22.643 | 0.000 | 1.36e+05 | 1.61e+05 |
| C(codezipcode)[T.63] | 1.299e+05 | 7685.234 | 16.905 | 0.000 | 1.15e+05 | 1.45e+05 |
| C(codezipcode)[T.64] | 5.063e+04 | 7497.228 | 6.753 | 0.000 | 3.59e+04 | 6.53e+04 |
| C(codezipcode)[T.65] | 2.276e+05 | 7840.903 | 29.027 | 0.000 | 2.12e+05 | 2.43e+05 |
| C(codezipcode)[T.66] | 7.063e+04 | 7516.470 | 9.396 | 0.000 | 5.59e+04 | 8.54e+04 |
| C(codezipcode)[T.67] | 3.793e+04 | 9456.808 | 4.011 | 0.000 | 1.94e+04 | 5.65e+04 |
| C(codezipcode)[T.68] | 4.591e+04 | 7416.408 | 6.191 | 0.000 | 3.14e+04 | 6.05e+04 |
| C(codezipcode)[T.69] | 3.666e+05 | 7441.021 | 49.269 | 0.000 | 3.52e+05 | 3.81e+05 |
| grade | 3.645e+04 | 1004.395 | 36.289 | 0.000 | 3.45e+04 | 3.84e+04 |
| sca_sqft_living | 1.058e+05 | 1483.602 | 71.280 | 0.000 | 1.03e+05 | 1.09e+05 |
| sca_sqft_living15 | 3.646e+04 | 1505.741 | 24.213 | 0.000 | 3.35e+04 | 3.94e+04 |
| Omnibus: | 2745.646 | Durbin-Watson: | 2.000 |
|---|---|---|---|
| Prob(Omnibus): | 0.000 | Jarque-Bera (JB): | 8873.079 |
| Skew: | 0.739 | Prob(JB): | 0.00 |
| Kurtosis: | 5.998 | Cond. No. | 491. |
Warnings:
[1] Standard Errors assume that the covariance matrix of the errors is correctly specified.
- f1 = 'price ~ C(codezipcode) + grade + sca_sqft_living + sca_sqft_living15' - price ~ zipcode(category), grade~~(category)~~, sqft_living(scaled to median, RobustScaler) + sqft_living15 (scaled to median, RobustScaler)
# df_run_ols.to_csv(data_filepath+'df_run_ols_model.csv')# Visualize Q-Q Plots
resid1=model.resid
fig = sm.graphics.qqplot(resid1, dist=stats.norm, line='45', fit=True,marker='.')- Interpreting the Q-Q plot:
- The Q-Q plot looks a bit crazy and may indicate... outliers?
- The only thing I did not check for outliers in final model was zipcode.
- Will run cross-validation with test-train-split to help decide
# Visualizing final dataset again.
import matplotlib.pyplot as plt

# Re-inspecting XY
# plot_hist_scat(df_run_ols)# k_fold_val_ols(X,y,k=10):
from sklearn.model_selection import train_test_split
from sklearn.linear_model import LinearRegression
from sklearn import metrics
y = df_run['price']
# Run 10-fold cross validation
results = [['set#','R_square_train','MSE_train','R_square_test','MSE_test']]
num_coeff = X.shape[1]
list_predictors = [str(x) for x in X.columns]
list_predictors.append('intercept')
reg_params = [list_predictors]
i=0
k=10
while i <(k+1):
X_train, X_test, y_train, y_test = train_test_split(X,y) #,stratify=[cat_col_names])
data = pd.concat([X_train,y_train],axis=1)
f1 = 'price~C(codezipcode)+grade+sca_sqft_living+sca_sqft_living15'
model = smf.ols(formula=f1, data=data).fit()
model.summary()
y_hat_train = model.predict(X_train)
y_hat_test = model.predict(X_test)
train_residuals = y_hat_train - y_train
test_residuals = y_hat_test - y_test
train_mse = metrics.mean_squared_error(y_train, y_hat_train)
test_mse = metrics.mean_squared_error(y_test, y_hat_test)
R_sqare_train = metrics.r2_score(y_train,y_hat_train)
R_square_test = metrics.r2_score(y_test,y_hat_test)
results.append([i,R_sqare_train,train_mse,R_square_test,test_mse])
i+=1
results = pd.DataFrame(results[1:],columns=results[0])
results
model.summary()| Dep. Variable: | price | R-squared: | 0.797 |
|---|---|---|---|
| Model: | OLS | Adj. R-squared: | 0.796 |
| Method: | Least Squares | F-statistic: | 777.3 |
| Date: | Sat, 26 Oct 2019 | Prob (F-statistic): | 0.00 |
| Time: | 20:53:05 | Log-Likelihood: | -1.8327e+05 |
| No. Observations: | 14289 | AIC: | 3.667e+05 |
| Df Residuals: | 14216 | BIC: | 3.672e+05 |
| Df Model: | 72 | ||
| Covariance Type: | nonrobust |
| coef | std err | t | P>|t| | [0.025 | 0.975] | |
|---|---|---|---|---|---|---|
| Intercept | 1.335e+04 | 1e+04 | 1.332 | 0.183 | -6299.539 | 3.3e+04 |
| C(codezipcode)[T.1] | 1.987e+04 | 9592.174 | 2.071 | 0.038 | 1064.021 | 3.87e+04 |
| C(codezipcode)[T.2] | -63.1415 | 8455.546 | -0.007 | 0.994 | -1.66e+04 | 1.65e+04 |
| C(codezipcode)[T.3] | 5.148e+05 | 1.02e+04 | 50.375 | 0.000 | 4.95e+05 | 5.35e+05 |
| C(codezipcode)[T.4] | 3.408e+05 | 1.06e+04 | 32.259 | 0.000 | 3.2e+05 | 3.62e+05 |
| C(codezipcode)[T.5] | 2.775e+05 | 7826.332 | 35.454 | 0.000 | 2.62e+05 | 2.93e+05 |
| C(codezipcode)[T.6] | 2.624e+05 | 1.09e+04 | 24.078 | 0.000 | 2.41e+05 | 2.84e+05 |
| C(codezipcode)[T.7] | 2.517e+05 | 8442.654 | 29.818 | 0.000 | 2.35e+05 | 2.68e+05 |
| C(codezipcode)[T.8] | 1.013e+05 | 1.15e+04 | 8.835 | 0.000 | 7.88e+04 | 1.24e+05 |
| C(codezipcode)[T.9] | 1.335e+05 | 9530.979 | 14.007 | 0.000 | 1.15e+05 | 1.52e+05 |
| C(codezipcode)[T.10] | 1.242e+05 | 1.14e+04 | 10.938 | 0.000 | 1.02e+05 | 1.46e+05 |
| C(codezipcode)[T.11] | 8.817e+04 | 9492.392 | 9.288 | 0.000 | 6.96e+04 | 1.07e+05 |
| C(codezipcode)[T.12] | 5.173e+04 | 9098.797 | 5.685 | 0.000 | 3.39e+04 | 6.96e+04 |
| C(codezipcode)[T.13] | -2.24e+04 | 7313.708 | -3.063 | 0.002 | -3.67e+04 | -8062.868 |
| C(codezipcode)[T.14] | 1.73e+05 | 1.4e+04 | 12.328 | 0.000 | 1.46e+05 | 2.01e+05 |
| C(codezipcode)[T.15] | 1.859e+05 | 7937.395 | 23.417 | 0.000 | 1.7e+05 | 2.01e+05 |
| C(codezipcode)[T.16] | 1.267e+05 | 8378.602 | 15.125 | 0.000 | 1.1e+05 | 1.43e+05 |
| C(codezipcode)[T.17] | 2.178e+05 | 8326.775 | 26.160 | 0.000 | 2.02e+05 | 2.34e+05 |
| C(codezipcode)[T.18] | -249.4411 | 8757.410 | -0.028 | 0.977 | -1.74e+04 | 1.69e+04 |
| C(codezipcode)[T.19] | 8651.0139 | 8538.847 | 1.013 | 0.311 | -8086.244 | 2.54e+04 |
| C(codezipcode)[T.20] | 5118.0937 | 1.08e+04 | 0.472 | 0.637 | -1.61e+04 | 2.64e+04 |
| C(codezipcode)[T.21] | 3.285e+05 | 7910.146 | 41.525 | 0.000 | 3.13e+05 | 3.44e+05 |
| C(codezipcode)[T.22] | 1.811e+05 | 7233.153 | 25.031 | 0.000 | 1.67e+05 | 1.95e+05 |
| C(codezipcode)[T.23] | 3.053e+04 | 7088.513 | 4.307 | 0.000 | 1.66e+04 | 4.44e+04 |
| C(codezipcode)[T.24] | 6.532e+05 | 4.07e+04 | 16.035 | 0.000 | 5.73e+05 | 7.33e+05 |
| C(codezipcode)[T.25] | 4.461e+05 | 1.06e+04 | 42.253 | 0.000 | 4.25e+05 | 4.67e+05 |
| C(codezipcode)[T.26] | 1.361e+04 | 7178.523 | 1.897 | 0.058 | -456.173 | 2.77e+04 |
| C(codezipcode)[T.27] | 1.115e+05 | 9231.085 | 12.077 | 0.000 | 9.34e+04 | 1.3e+05 |
| C(codezipcode)[T.28] | 2.457e+05 | 7277.677 | 33.757 | 0.000 | 2.31e+05 | 2.6e+05 |
| C(codezipcode)[T.29] | 2.308e+05 | 8008.266 | 28.825 | 0.000 | 2.15e+05 | 2.47e+05 |
| C(codezipcode)[T.30] | 4.328e+04 | 8550.840 | 5.062 | 0.000 | 2.65e+04 | 6e+04 |
| C(codezipcode)[T.31] | 1.08e+05 | 7674.700 | 14.067 | 0.000 | 9.29e+04 | 1.23e+05 |
| C(codezipcode)[T.32] | 3.627e+04 | 7549.579 | 4.804 | 0.000 | 2.15e+04 | 5.11e+04 |
| C(codezipcode)[T.33] | 9.348e+04 | 7609.749 | 12.284 | 0.000 | 7.86e+04 | 1.08e+05 |
| C(codezipcode)[T.34] | 1.181e+05 | 8367.718 | 14.112 | 0.000 | 1.02e+05 | 1.34e+05 |
| C(codezipcode)[T.35] | 2.061e+05 | 1.15e+04 | 17.898 | 0.000 | 1.84e+05 | 2.29e+05 |
| C(codezipcode)[T.36] | 1.686e+05 | 8844.479 | 19.068 | 0.000 | 1.51e+05 | 1.86e+05 |
| C(codezipcode)[T.37] | 2.147e+05 | 7847.667 | 27.357 | 0.000 | 1.99e+05 | 2.3e+05 |
| C(codezipcode)[T.38] | 2.273e+05 | 8579.895 | 26.487 | 0.000 | 2.1e+05 | 2.44e+05 |
| C(codezipcode)[T.39] | 1.782e+05 | 9930.805 | 17.946 | 0.000 | 1.59e+05 | 1.98e+05 |
| C(codezipcode)[T.40] | -1.318e+04 | 8051.617 | -1.637 | 0.102 | -2.9e+04 | 2603.935 |
| C(codezipcode)[T.41] | 4.051e+05 | 1.26e+04 | 32.131 | 0.000 | 3.8e+05 | 4.3e+05 |
| C(codezipcode)[T.42] | 3.313e+05 | 7139.097 | 46.400 | 0.000 | 3.17e+05 | 3.45e+05 |
| C(codezipcode)[T.43] | 3.892e+05 | 1e+04 | 38.916 | 0.000 | 3.7e+05 | 4.09e+05 |
| C(codezipcode)[T.44] | 1.131e+05 | 8205.214 | 13.786 | 0.000 | 9.7e+04 | 1.29e+05 |
| C(codezipcode)[T.45] | 3.282e+05 | 8609.280 | 38.122 | 0.000 | 3.11e+05 | 3.45e+05 |
| C(codezipcode)[T.46] | 1.146e+05 | 9650.985 | 11.872 | 0.000 | 9.57e+04 | 1.33e+05 |
| C(codezipcode)[T.47] | 4.354e+05 | 1.31e+04 | 33.220 | 0.000 | 4.1e+05 | 4.61e+05 |
| C(codezipcode)[T.48] | 4.36e+05 | 9737.926 | 44.778 | 0.000 | 4.17e+05 | 4.55e+05 |
| C(codezipcode)[T.49] | 3.28e+05 | 7141.058 | 45.933 | 0.000 | 3.14e+05 | 3.42e+05 |
| C(codezipcode)[T.50] | 3.131e+05 | 8298.811 | 37.725 | 0.000 | 2.97e+05 | 3.29e+05 |
| C(codezipcode)[T.51] | 3.231e+05 | 7309.340 | 44.208 | 0.000 | 3.09e+05 | 3.37e+05 |
| C(codezipcode)[T.52] | 1.738e+05 | 7347.356 | 23.652 | 0.000 | 1.59e+05 | 1.88e+05 |
| C(codezipcode)[T.53] | 4.138e+05 | 1.04e+04 | 39.782 | 0.000 | 3.93e+05 | 4.34e+05 |
| C(codezipcode)[T.54] | 3.085e+05 | 8659.088 | 35.623 | 0.000 | 2.91e+05 | 3.25e+05 |
| C(codezipcode)[T.55] | 1.987e+05 | 7701.688 | 25.794 | 0.000 | 1.84e+05 | 2.14e+05 |
| C(codezipcode)[T.56] | 2.14e+05 | 8105.982 | 26.399 | 0.000 | 1.98e+05 | 2.3e+05 |
| C(codezipcode)[T.57] | 1.538e+05 | 7378.452 | 20.846 | 0.000 | 1.39e+05 | 1.68e+05 |
| C(codezipcode)[T.58] | 2.776e+05 | 8779.423 | 31.614 | 0.000 | 2.6e+05 | 2.95e+05 |
| C(codezipcode)[T.59] | 2.474e+05 | 8226.732 | 30.078 | 0.000 | 2.31e+05 | 2.64e+05 |
| C(codezipcode)[T.60] | 1.283e+05 | 8549.192 | 15.004 | 0.000 | 1.12e+05 | 1.45e+05 |
| C(codezipcode)[T.61] | 5.678e+04 | 1.53e+04 | 3.708 | 0.000 | 2.68e+04 | 8.68e+04 |
| C(codezipcode)[T.62] | 1.449e+05 | 7598.683 | 19.064 | 0.000 | 1.3e+05 | 1.6e+05 |
| C(codezipcode)[T.63] | 1.291e+05 | 8845.429 | 14.596 | 0.000 | 1.12e+05 | 1.46e+05 |
| C(codezipcode)[T.64] | 5.004e+04 | 8588.730 | 5.827 | 0.000 | 3.32e+04 | 6.69e+04 |
| C(codezipcode)[T.65] | 2.213e+05 | 8901.552 | 24.861 | 0.000 | 2.04e+05 | 2.39e+05 |
| C(codezipcode)[T.66] | 6.631e+04 | 8734.035 | 7.592 | 0.000 | 4.92e+04 | 8.34e+04 |
| C(codezipcode)[T.67] | 3.447e+04 | 1.1e+04 | 3.127 | 0.002 | 1.29e+04 | 5.61e+04 |
| C(codezipcode)[T.68] | 4.472e+04 | 8526.630 | 5.245 | 0.000 | 2.8e+04 | 6.14e+04 |
| C(codezipcode)[T.69] | 3.723e+05 | 8523.482 | 43.674 | 0.000 | 3.56e+05 | 3.89e+05 |
| grade | 3.555e+04 | 1156.019 | 30.754 | 0.000 | 3.33e+04 | 3.78e+04 |
| sca_sqft_living | 1.052e+05 | 1718.291 | 61.238 | 0.000 | 1.02e+05 | 1.09e+05 |
| sca_sqft_living15 | 3.777e+04 | 1741.292 | 21.691 | 0.000 | 3.44e+04 | 4.12e+04 |
| Omnibus: | 2119.945 | Durbin-Watson: | 2.022 |
|---|---|---|---|
| Prob(Omnibus): | 0.000 | Jarque-Bera (JB): | 7070.924 |
| Skew: | 0.750 | Prob(JB): | 0.00 |
| Kurtosis: | 6.102 | Cond. No. | 484. |
Warnings:
[1] Standard Errors assume that the covariance matrix of the errors is correctly specified.
display(results.round(3).style.hide_index().set_caption('K FOLD VALIDATION RESULTS:'))
print(results.mean().round(2)) <tr>
<td id="T_75840d1e_f854_11e9_aa79_acde48001122row0_col0" class="data row0 col0" >0</td>
<td id="T_75840d1e_f854_11e9_aa79_acde48001122row0_col1" class="data row0 col1" >0.794</td>
<td id="T_75840d1e_f854_11e9_aa79_acde48001122row0_col2" class="data row0 col2" >8.25284e+09</td>
<td id="T_75840d1e_f854_11e9_aa79_acde48001122row0_col3" class="data row0 col3" >0.805</td>
<td id="T_75840d1e_f854_11e9_aa79_acde48001122row0_col4" class="data row0 col4" >7.75865e+09</td>
</tr>
<tr>
<td id="T_75840d1e_f854_11e9_aa79_acde48001122row1_col0" class="data row1 col0" >1</td>
<td id="T_75840d1e_f854_11e9_aa79_acde48001122row1_col1" class="data row1 col1" >0.798</td>
<td id="T_75840d1e_f854_11e9_aa79_acde48001122row1_col2" class="data row1 col2" >8.02805e+09</td>
<td id="T_75840d1e_f854_11e9_aa79_acde48001122row1_col3" class="data row1 col3" >0.792</td>
<td id="T_75840d1e_f854_11e9_aa79_acde48001122row1_col4" class="data row1 col4" >8.44119e+09</td>
</tr>
<tr>
<td id="T_75840d1e_f854_11e9_aa79_acde48001122row2_col0" class="data row2 col0" >2</td>
<td id="T_75840d1e_f854_11e9_aa79_acde48001122row2_col1" class="data row2 col1" >0.796</td>
<td id="T_75840d1e_f854_11e9_aa79_acde48001122row2_col2" class="data row2 col2" >8.22753e+09</td>
<td id="T_75840d1e_f854_11e9_aa79_acde48001122row2_col3" class="data row2 col3" >0.798</td>
<td id="T_75840d1e_f854_11e9_aa79_acde48001122row2_col4" class="data row2 col4" >7.84085e+09</td>
</tr>
<tr>
<td id="T_75840d1e_f854_11e9_aa79_acde48001122row3_col0" class="data row3 col0" >3</td>
<td id="T_75840d1e_f854_11e9_aa79_acde48001122row3_col1" class="data row3 col1" >0.801</td>
<td id="T_75840d1e_f854_11e9_aa79_acde48001122row3_col2" class="data row3 col2" >7.99554e+09</td>
<td id="T_75840d1e_f854_11e9_aa79_acde48001122row3_col3" class="data row3 col3" >0.784</td>
<td id="T_75840d1e_f854_11e9_aa79_acde48001122row3_col4" class="data row3 col4" >8.53921e+09</td>
</tr>
<tr>
<td id="T_75840d1e_f854_11e9_aa79_acde48001122row4_col0" class="data row4 col0" >4</td>
<td id="T_75840d1e_f854_11e9_aa79_acde48001122row4_col1" class="data row4 col1" >0.798</td>
<td id="T_75840d1e_f854_11e9_aa79_acde48001122row4_col2" class="data row4 col2" >8.04785e+09</td>
<td id="T_75840d1e_f854_11e9_aa79_acde48001122row4_col3" class="data row4 col3" >0.792</td>
<td id="T_75840d1e_f854_11e9_aa79_acde48001122row4_col4" class="data row4 col4" >8.37521e+09</td>
</tr>
<tr>
<td id="T_75840d1e_f854_11e9_aa79_acde48001122row5_col0" class="data row5 col0" >5</td>
<td id="T_75840d1e_f854_11e9_aa79_acde48001122row5_col1" class="data row5 col1" >0.798</td>
<td id="T_75840d1e_f854_11e9_aa79_acde48001122row5_col2" class="data row5 col2" >8.05122e+09</td>
<td id="T_75840d1e_f854_11e9_aa79_acde48001122row5_col3" class="data row5 col3" >0.791</td>
<td id="T_75840d1e_f854_11e9_aa79_acde48001122row5_col4" class="data row5 col4" >8.38799e+09</td>
</tr>
<tr>
<td id="T_75840d1e_f854_11e9_aa79_acde48001122row6_col0" class="data row6 col0" >6</td>
<td id="T_75840d1e_f854_11e9_aa79_acde48001122row6_col1" class="data row6 col1" >0.799</td>
<td id="T_75840d1e_f854_11e9_aa79_acde48001122row6_col2" class="data row6 col2" >8.02395e+09</td>
<td id="T_75840d1e_f854_11e9_aa79_acde48001122row6_col3" class="data row6 col3" >0.789</td>
<td id="T_75840d1e_f854_11e9_aa79_acde48001122row6_col4" class="data row6 col4" >8.46109e+09</td>
</tr>
<tr>
<td id="T_75840d1e_f854_11e9_aa79_acde48001122row7_col0" class="data row7 col0" >7</td>
<td id="T_75840d1e_f854_11e9_aa79_acde48001122row7_col1" class="data row7 col1" >0.796</td>
<td id="T_75840d1e_f854_11e9_aa79_acde48001122row7_col2" class="data row7 col2" >8.16571e+09</td>
<td id="T_75840d1e_f854_11e9_aa79_acde48001122row7_col3" class="data row7 col3" >0.8</td>
<td id="T_75840d1e_f854_11e9_aa79_acde48001122row7_col4" class="data row7 col4" >8.02418e+09</td>
</tr>
<tr>
<td id="T_75840d1e_f854_11e9_aa79_acde48001122row8_col0" class="data row8 col0" >8</td>
<td id="T_75840d1e_f854_11e9_aa79_acde48001122row8_col1" class="data row8 col1" >0.802</td>
<td id="T_75840d1e_f854_11e9_aa79_acde48001122row8_col2" class="data row8 col2" >7.92802e+09</td>
<td id="T_75840d1e_f854_11e9_aa79_acde48001122row8_col3" class="data row8 col3" >0.781</td>
<td id="T_75840d1e_f854_11e9_aa79_acde48001122row8_col4" class="data row8 col4" >8.75334e+09</td>
</tr>
<tr>
<td id="T_75840d1e_f854_11e9_aa79_acde48001122row9_col0" class="data row9 col0" >9</td>
<td id="T_75840d1e_f854_11e9_aa79_acde48001122row9_col1" class="data row9 col1" >0.795</td>
<td id="T_75840d1e_f854_11e9_aa79_acde48001122row9_col2" class="data row9 col2" >8.23515e+09</td>
<td id="T_75840d1e_f854_11e9_aa79_acde48001122row9_col3" class="data row9 col3" >0.801</td>
<td id="T_75840d1e_f854_11e9_aa79_acde48001122row9_col4" class="data row9 col4" >7.79522e+09</td>
</tr>
<tr>
<td id="T_75840d1e_f854_11e9_aa79_acde48001122row10_col0" class="data row10 col0" >10</td>
<td id="T_75840d1e_f854_11e9_aa79_acde48001122row10_col1" class="data row10 col1" >0.797</td>
<td id="T_75840d1e_f854_11e9_aa79_acde48001122row10_col2" class="data row10 col2" >8.09393e+09</td>
<td id="T_75840d1e_f854_11e9_aa79_acde48001122row10_col3" class="data row10 col3" >0.795</td>
<td id="T_75840d1e_f854_11e9_aa79_acde48001122row10_col4" class="data row10 col4" >8.23092e+09</td>
</tr>
</tbody></table>
set# 5.000000e+00
R_square_train 8.000000e-01
MSE_train 8.095434e+09
R_square_test 7.900000e-01
MSE_test 8.237077e+09
dtype: float64
resid1=model.resid
fig = sm.graphics.qqplot(resid1, dist=stats.norm, line='45', fit=True,marker='.')
df_model = pd.concat([df_run[try_modeling],df_run['price']],axis=1)results.describe().round(3).dataframe tbody tr th {
vertical-align: top;
}
.dataframe thead th {
text-align: right;
}
| set# | R_square_train | MSE_train | R_square_test | MSE_test |
|---|
| set# | R_square_train | MSE_train | R_square_test | MSE_test | |
|---|---|---|---|---|---|
| count | 11.000 | 11.000 | 1.100000e+01 | 11.000 | 1.100000e+01 |
| mean | 5.000 | 0.798 | 8.095434e+09 | 0.793 | 8.237077e+09 |
| std | 3.317 | 0.002 | 1.088873e+08 | 0.007 | 3.343640e+08 |
| min | 0.000 | 0.794 | 7.928017e+09 | 0.781 | 7.758653e+09 |
| 25% | 2.500 | 0.796 | 8.026001e+09 | 0.790 | 7.932512e+09 |
| 50% | 5.000 | 0.798 | 8.051215e+09 | 0.792 | 8.375206e+09 |
| 75% | 7.500 | 0.799 | 8.196623e+09 | 0.799 | 8.451143e+09 |
| max | 10.000 | 0.802 | 8.252839e+09 | 0.805 | 8.753335e+09 |
-
For k=10 fold validation, with price as target variable:
- mean r_squared for the test sets was 0.797, with mean MSE = 8.158691e+09
f1 = 'price~C(codezipcode)+C(grade)+sca_sqft_living+sca_sqft_living15'
-
Predictors in final model:
- 'Zipcode'
- 'grade'
- 'sqft_living'
- 'sqfr_living15'
-
My final model indicates that the size, location, and housing geade to be critical components in determining salesprice.
- Grade, sqft_living, and sqft_living15 all have straight-forward relationships with sales price, with positive coefficients.
- sqft_living is a larger component of the price (coefficient: 1.043e+05)
- grade (coeff: 3.679e+04)and sqft_living15 (coeff: 3.767e+04) have a similar magnitude of an effect on sales price
- Zipcode is a bit trickier, as each zipcode has its own coefficient.
- Overall, zipcode has a positive coefficient/effect on price (to varying degrees)
- There are, however, a couple zipcodes that negatively impact sales price.
- With more time I would have proceeded to perform the following steps:
- Additional changes to the predictors in the model
- Trying to remove outliers from zipcodes
- Explored additional transformations to the data.
- I was trying to be conservative to keep the interpretability of my model intact.
- Log-transforming the data improved the distributions but made it more difficult to interpret.
- I would further tweak the quality of the visuals, particularly changing the x-tick labels and rotation.
- Additional changes to the predictors in the model
df_dropped.indexRangeIndex(start=0, stop=21597, step=1)
df_run.describe().dataframe tbody tr th {
vertical-align: top;
}
.dataframe thead th {
text-align: right;
}
| price | bedrooms | bathrooms | sqft_living | sqft_lot | floors | condition | grade | sqft_living15 | sqft_lot15 | is_reno | sca_sqft_living | sca_sqft_lot | sca_sqft_living15 | sca_sqft_lot15 | sca_bedrooms | sca_bathrooms | |
|---|---|---|---|---|---|---|---|---|---|---|---|---|---|---|---|---|---|
| count | 1.905300e+04 | 19053.000000 | 19053.000000 | 19053.000000 | 1.905300e+04 | 19053.000000 | 19053.000000 | 19053.000000 | 19053.000000 | 19053.000000 | 19053.000000 | 19053.000000 | 19053.000000 | 19053.000000 | 19053.000000 | 19053.000000 | 19053.000000 |
| mean | 4.681033e+05 | 3.293025 | 2.017136 | 1928.589513 | 1.403172e+04 | 1.468142 | 3.411746 | 7.496720 | 1892.003464 | 12000.351703 | 0.029287 | 0.100602 | 1.262394 | 0.129118 | 0.945326 | 0.293025 | 0.017136 |
| std | 1.999766e+05 | 0.780532 | 0.659094 | 699.470303 | 3.882067e+04 | 0.536934 | 0.647548 | 0.978593 | 567.785762 | 24743.514984 | 0.168613 | 0.713745 | 7.491446 | 0.718716 | 5.210258 | 0.780532 | 0.659094 |
| min | 7.800000e+04 | 2.000000 | 0.750000 | 440.000000 | 5.200000e+02 | 1.000000 | 1.000000 | 4.000000 | 399.000000 | 651.000000 | 0.000000 | -1.418367 | -1.345041 | -1.760759 | -1.444515 | -1.000000 | -1.250000 |
| 25% | 3.135000e+05 | 3.000000 | 1.500000 | 1400.000000 | 5.000000e+03 | 1.000000 | 3.000000 | 7.000000 | 1460.000000 | 5026.000000 | 0.000000 | -0.438776 | -0.480509 | -0.417722 | -0.523268 | 0.000000 | -0.500000 |
| 50% | 4.310000e+05 | 3.000000 | 2.000000 | 1830.000000 | 7.490000e+03 | 1.000000 | 3.000000 | 7.000000 | 1790.000000 | 7511.000000 | 0.000000 | 0.000000 | 0.000000 | 0.000000 | 0.000000 | 0.000000 | 0.000000 |
| 75% | 5.890000e+05 | 4.000000 | 2.500000 | 2380.000000 | 1.018200e+04 | 2.000000 | 4.000000 | 8.000000 | 2250.000000 | 9775.000000 | 0.000000 | 0.561224 | 0.519491 | 0.582278 | 0.476732 | 1.000000 | 0.500000 |
| max | 1.120000e+06 | 5.000000 | 3.500000 | 4230.000000 | 1.651359e+06 | 3.500000 | 5.000000 | 11.000000 | 3660.000000 | 560617.000000 | 1.000000 | 2.448980 | 317.226746 | 2.367089 | 116.467888 | 2.000000 | 1.500000 |
import pandas as pd

df_final_data=pd.concat([df_run, df_dropped[['lat','long','id']]],axis=1)
df_final_data.info()
<class 'pandas.core.frame.DataFrame'>
Int64Index: 21597 entries, 0 to 21596
Data columns (total 30 columns):
price 19053 non-null float64
bedrooms 19053 non-null float64
bathrooms 19053 non-null float64
sqft_living 19053 non-null float64
sqft_lot 19053 non-null float64
floors 19053 non-null float64
condition 19053 non-null float64
grade 19053 non-null float64
zipcode 19053 non-null category
sqft_living15 19053 non-null float64
sqft_lot15 19053 non-null float64
code_view 19053 non-null category
code_waterfront 19053 non-null category
is_reno 19053 non-null float64
bins_yrbuilt 19053 non-null category
bins_sqftbasement 19053 non-null category
bins_sqftabove 19053 non-null category
sca_sqft_living 19053 non-null float64
sca_sqft_lot 19053 non-null float64
sca_sqft_living15 19053 non-null float64
sca_sqft_lot15 19053 non-null float64
sca_bedrooms 19053 non-null float64
sca_bathrooms 19053 non-null float64
codebins_yrbuilt 19053 non-null category
codebins_sqftbasement 19053 non-null category
codebins_sqftabove 19053 non-null category
codezipcode 19053 non-null category
lat 21597 non-null float64
long 21597 non-null float64
id 21597 non-null int64
dtypes: category(10), float64(19), int64(1)
memory usage: 3.7 MB
# save final output
# df_final_data.to_csv(data_filepath+'kc_housing_model_df_final_data.csv')# Reset the visual style of the notebook
import matplotlib as mpl
import matplotlib.pyplot as plt
mpl.rcParams.update(inline_rc)
# inline_rc = dict(mpl.rcParams)import seaborn as sns
import matplotlib.pyplot as plt
import matplotlib.ticker as mtick
# plt.style.use('dark_background')
# plt.style.use('dark')
# Define the figure and axes and the # of subplots, sharing the y axes
fig, ax = plt.subplots(figsize=(16,12), ncols=2, nrows=2, sharey=True)
## Defining Formatting to be Used
# Formatting dollar sign labels
fmtPrice = '${x:,.0f}'
tickPrice = mtick.StrMethodFormatter(fmtPrice)
# Axis Label fonts
fontTitle = {'fontsize': 20,
'fontweight': 'bold',
'fontfamily':'serif'}
fontAxis = {'fontsize': 16,
'fontweight': 'bold',
'fontfamily':'serif'}
fontTicks = {'fontsize': 12,
'fontweight':'medium',
'fontfamily':'serif'}
# The amount of space above titles
y_title_margin = 1.01
# Major title
# plt.suptitle("Critical Factors for Predicting Sales Price", y = 1.0, fontdict=fontTitle, fontsize=22)
## Subplot 1
i,j=0,0
ax[i,j].set_title("Zipcode",y = y_title_margin,fontdict=fontTitle)#, y = y_title_margin)
sns.stripplot(df_final_data['zipcode'],df_final_data['price'],ax=ax[i,j],marker='o',size=3)
# Remove xticks
ax[i,j].set_xticks([]), ax[i,j].set_xlabel('')
# Change y-tick labels
ax[i,j].set_ylabel('Price',fontdict=fontAxis)
yticklab = ax[i,j].get_yticklabels()
ax[i,j].set_yticklabels(yticklab,fontdict=fontTicks)
ax[i,j].get_yaxis().set_major_formatter(tickPrice)
# Set y-grid
ax[i, j].set_axisbelow(True)
ax[i, j].grid(axis='y',ls='--')
## Subplot 2
i,j = 0,1
ax[i,j].set_title("Housing Grade",y = y_title_margin,fontdict=fontTitle)
ax[i,j].title.set_fontsize(20)
sns.stripplot(df_final_data['grade'],df_final_data['price'],ax=ax[i,j],marker='o',size=2)
#Set x axis
xticklab=ax[i,j].get_xticklabels()
ax[i,j].set_xticklabels(xticklab,fontdict=fontTicks)
ax[i,j].set_xlabel('Grade')
# Change y-tick labels
ax[i,j].set_ylabel('')# 'Price',fontdict=fontAxis)
# Set y-grid
ax[i, j].set_axisbelow(True)
ax[i, j].grid(axis='y',ls='--')
yticklab = ax[i,j].get_yticklabels()
ax[i,j].set_yticklabels(yticklab,fontdict=fontTicks)
ax[i,j].get_yaxis().set_major_formatter(tickPrice)
## Subplot 3
i,j = 1,0
# Title
ax[i,j].set_title("Living Space (sqft)",y = y_title_margin,fontdict=fontTitle)
ax[i,j].title.set_fontsize(20)
# Define the scatter plot and line graph aesthetics
line_kws={"color":"orange","alpha":0.5,"lw":8,"ls":":"}
scatter_kws={'s': 5, 'alpha': 0.5,'marker':'.','color':'red'}
# Plot seaborn plot
sns.regplot(df_final_data['sqft_living'], df_final_data['price'],ax=ax[i,j], scatter_kws=scatter_kws, line_kws=line_kws) #,marker='o',size=2)
# sns.stripplot(df_final_data['sqft_living'], df_final_data['price'],ax=ax[i,j],marker='.') #,marker='o',size=2)
## Change the x-axis
ax[i,j].set_xlabel('Area (sqft)',fontdict=fontAxis)
# Get ticks, rotate labels, and return
# xticks = ax[i,j].get_xticks()
xticklab=ax[i,j].get_xticklabels()
ax[i,j].set_xticklabels(xticklab,fontdict=fontTicks, rotation=45)
# Change the major units of x-axis
ax[i,j].xaxis.set_major_locator(mtick.MultipleLocator(500))
ax[i,j].xaxis.set_major_formatter(mtick.ScalarFormatter())
## Change y-axis
# Change y-tick labels
ax[i,j].set_ylabel('Price',fontdict=fontAxis)
yticklab = ax[i,j].get_yticklabels()
ax[i,j].set_yticklabels(yticklab,fontdict=fontTicks)
ax[i,j].get_yaxis().set_major_formatter(tickPrice)
# Set y-grid
ax[i, j].set_axisbelow(True)
ax[i, j].grid(axis='y',ls='--')
# ## Subplot 4
i,j = 1,1
ax[i,j].set_title("Neighbor's Living Space (sqft)",y = y_title_margin,fontdict=fontTitle)
ax[i,j].title.set_fontsize(20)
# Define the scatter plot and line graph aesthetics
line_kws={"color":"lime","alpha":0.5,"lw":8,"ls":":"}
scatter_kws={'s': 5, 'alpha': 0.5,'marker':'.','color':'blueviolet'}
# Plot seaborn plot
sns.regplot(df_final_data['sqft_living15'], df_final_data['price'],ax=ax[i,j], scatter_kws=scatter_kws, line_kws=line_kws)
# Change the x-axis labels
ax[i,j].set_xlabel('Area (sqft)',fontdict=fontAxis)
# Get ticks, rotate labels, and return
xticklab=ax[i,j].get_xticklabels()
ax[i,j].set_xticklabels(xticklab,fontdict=fontTicks, rotation=45)
# Change the major units of x-axis
ax[i,j].xaxis.set_major_locator(mtick.MultipleLocator(500))
ax[i,j].xaxis.set_major_formatter(mtick.ScalarFormatter())
# Change y-tick labels
ax[i,j].set_ylabel('')#Price',fontdict=fontAxis)
yticklab = ax[i,j].get_yticklabels()
ax[i,j].set_yticklabels(yticklab,fontdict=fontTicks)
ax[i,j].get_yaxis().set_major_formatter(tickPrice)
# Set y-grid
ax[i, j].set_axisbelow(True)
ax[i, j].grid(axis='y',ls='--')
plt.tight_layout()
plt.savefig(fig_filepath+"summary_figure.png") # save as pngfrom IPython.display import Image
Image("Final Figures/map_median_price.png")Image("Final Figures/map_latlong_price.png")