Author: James M. Irving, Ph.D.
✨New Multi-Part Blog Series on Using IBM AI Fairness 360 applied to this prisoner recividism dataset. Blog Link
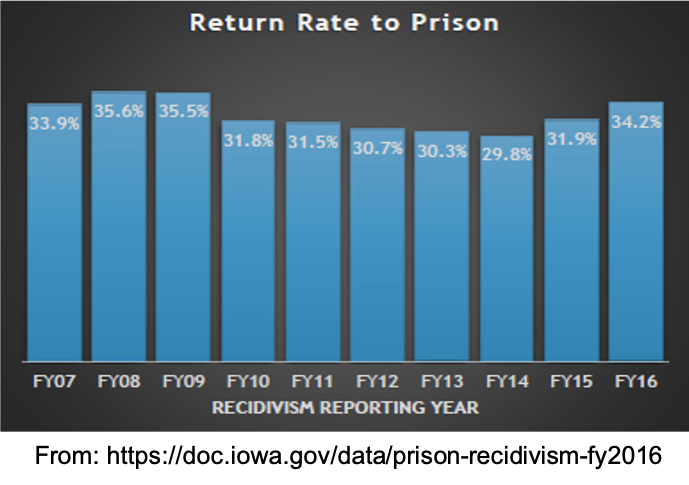
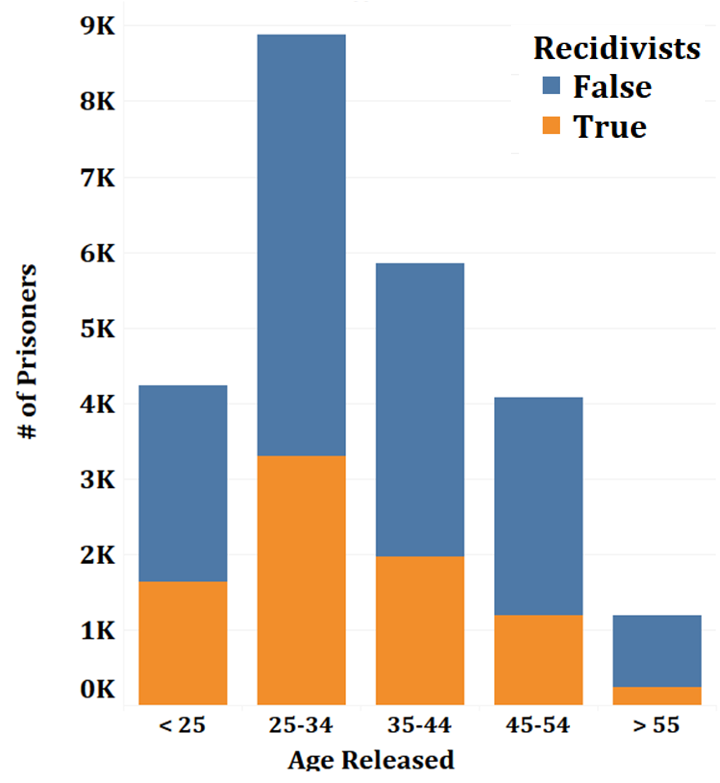
- The state of Iowa has had a prisoner recidivism issue that has become an increasing problem over several decades, with recidivism rates over 35% in 2007-2009. While there was a period of gradual reduction from 2010-2014, there was a major jump in recidivism in 2015-2016.
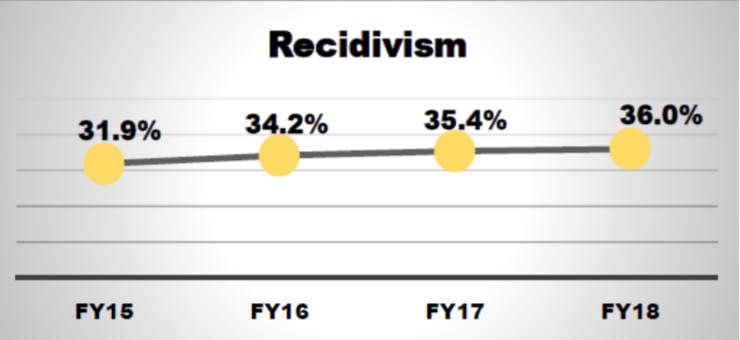
- In 2015, US Dept. of Justice gave Iowa a $3 million Grant to help reduce recividism. At the time, 31.9% of all released prisoners from Iowa were returning to prison within 3 years of being released. Despite this investment, the recidivism rate has continued to clime, reaching 36% by 2018.
-
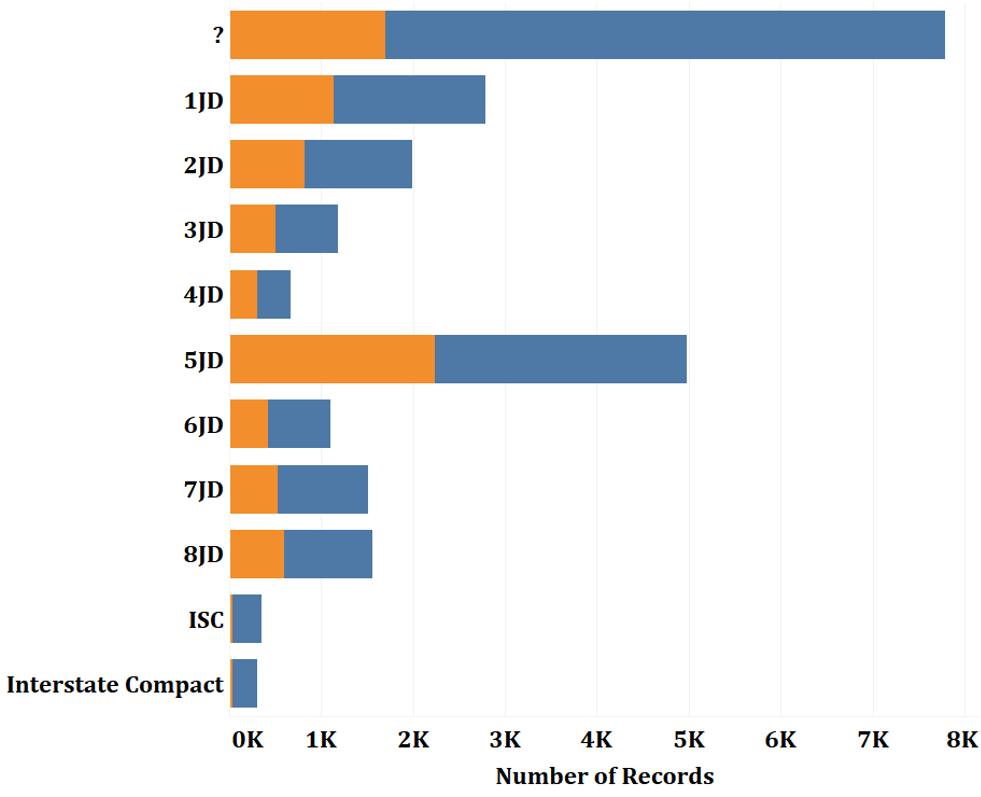
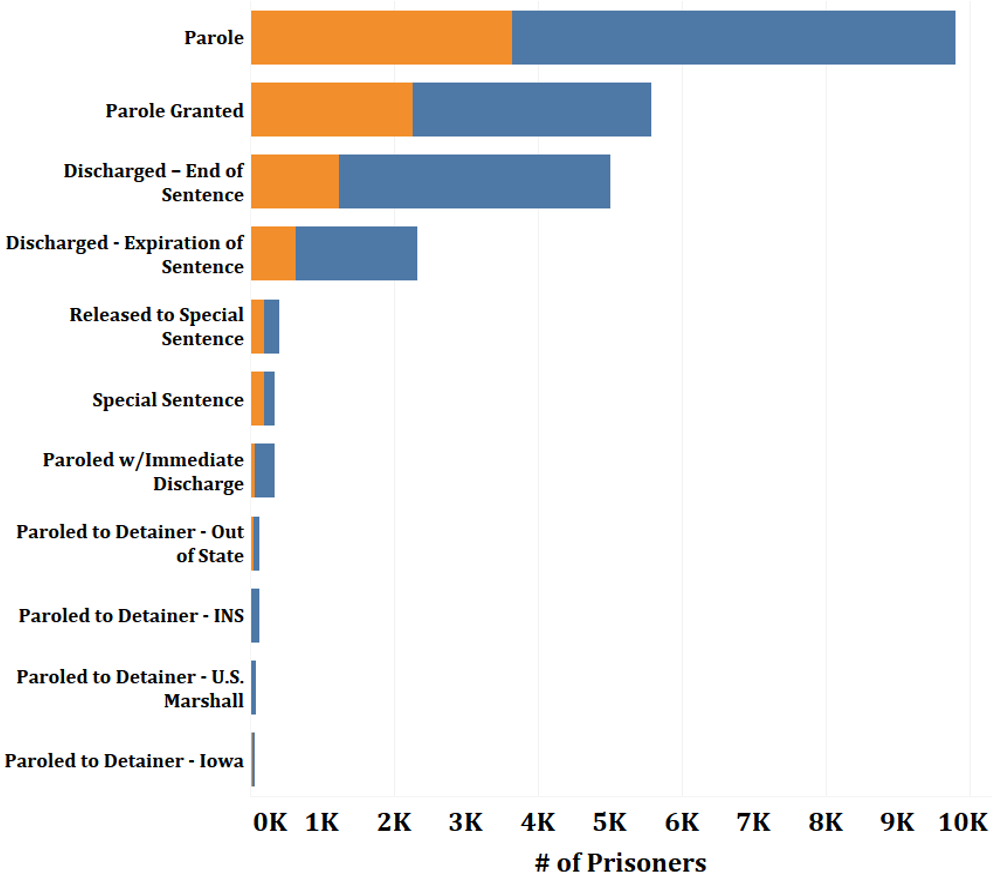
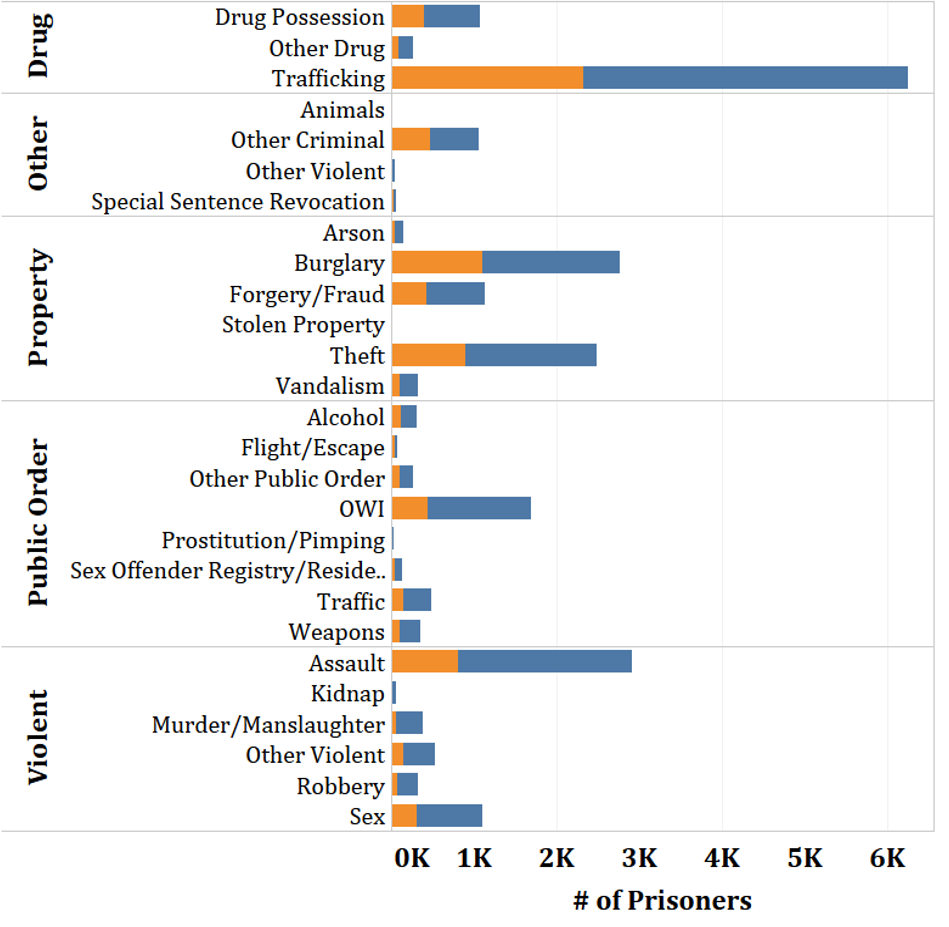
Recidivism statistics and visualizations above are from the Iowa Department of Corrections Annual Report 2018
-
In order the better address the increase in prisoner recidivism, the Iowa State Department of Corrections has released data regarding which prisoners return to jail within 3 years of release, in the hopes of finding insights for areas of possible intervention.
- Our goals for this analysis was two-fold:
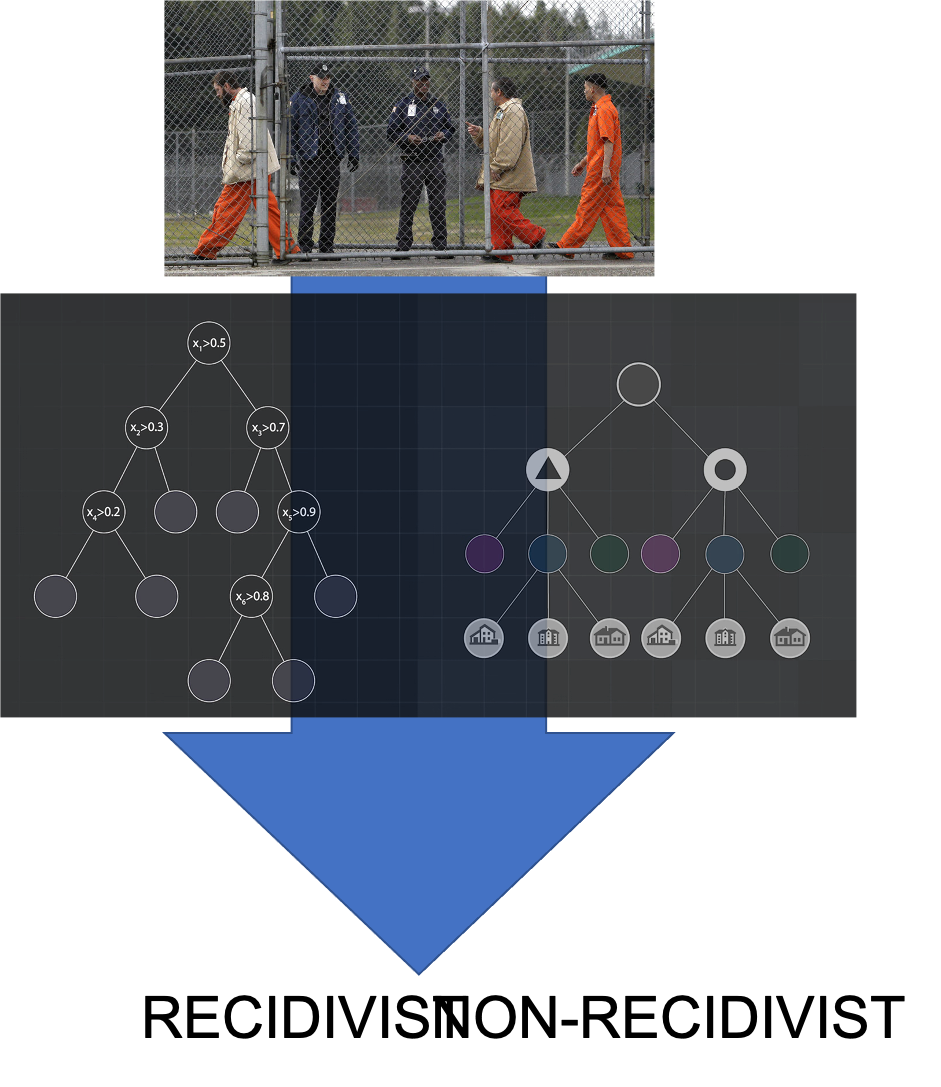
- Build a machine learning model that could predict which released prisoners will become recidivists/return-to-prison within 3 years of release.
- To identify which of the prisoner's demographics/features best predicts/explains which prisoners become recidivists.
- Source:
- Original/Up-to-date Source:
- Statistics about recidivism in prisoners from a 3 year prisoner
- Recidivism - Return to Prison
- No = No Recidivism;
- Yes = Prison admission for any reason within the 3-year tracking period
-
Fiscal Year Released[Not used in model]- Fiscal year (year ending June 30) for which the offender was released from prison.
-
Recidivism Reporting Year[Not used in model]- Fiscal year (year ending June 30) that marks the end of the 3-year tracking period. For example, offenders exited prison in FY 2012 are found in recidivism reporting year FY 2015.
-
Race - Ethnicity
- Offender's Race and Ethnicity
-
Convicting Offense Classification
- Maximum penalties: A Felony = Life; B Felony = 25 or 50 years; C Felony = 10 years; D Felony = 5 years; Aggravated Misdemeanor = 2 years; Serious Misdemeanor = 1 year; Simple Misdemeanor = 30 days
-
Convicting Offense Type
- General category for the most serious offense for which the offender was placed in prison.
-
Convicting Offense Subtype
- Further classification of the most serious offense for which the offender was placed in prison.
-
Release Type
- Reasoning for Offender's release from prison.
-
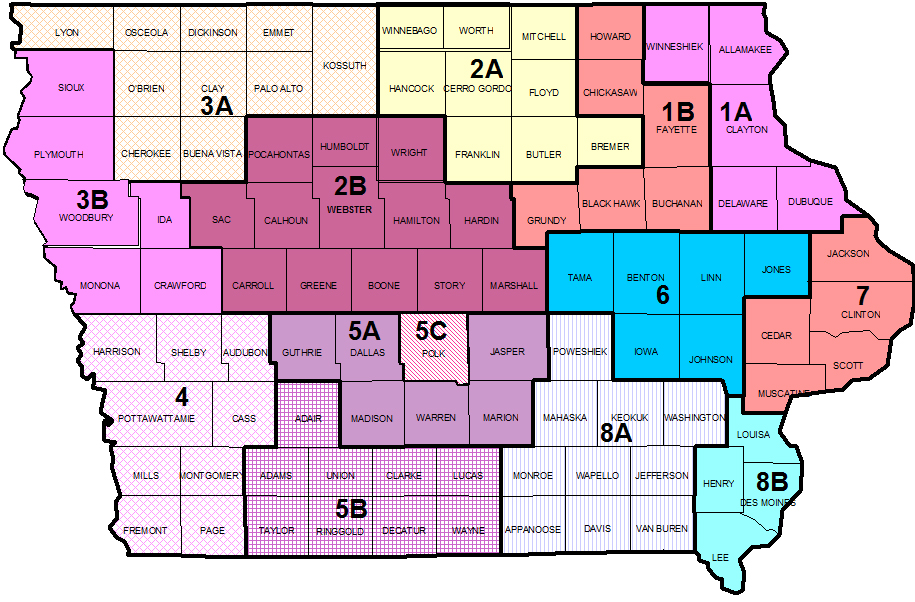
Main Supervising District
- The Judicial District supervising the offender for the longest time during the tracking period.
-
Part of Target Population
- The Department of Corrections has undertaken specific strategies to reduce recidivism rates for prisoners who are on parole and are part of the target population.
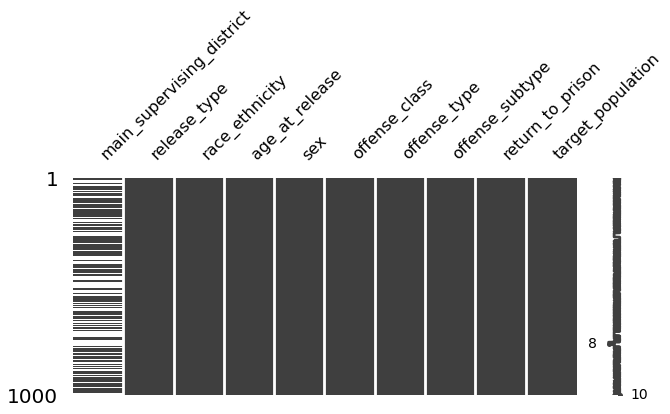
- There were many missing values for the main suprivising judicial district column. Since these values may be missing for a meaningful reason (e.g. prisoners were not assigned a superivising district), I imputed them with a new "MISSING" category.
-
Features related to the crime committed after release and the time until return to jail were removed, since they are not appropriate to use to predict who will be a recidivist.
- All features were categorical, except for age, which was converted to a numeric vallue (e.g. "35 - 45"-> 40).
-
Used multiple machine learning models to find model with the best recall score for correctly identify which prisoners will return to jain.
- Logisitic Regression
- Random Forest
- Catboost
- Support Vector Classifier
- XGBoost Classifier
-
There were several aspects of the dataset that made difficult to produce a model that could break .60 recall for recidivists.
- The large number of categorical features (only 1 final feature was continuous/numeric)
- The classes were imbalanced (66% non-recidivist to 33% recidivist), which we addressed via 2 approaches: using class weights as well as oversampling with SMOTENC.
-
After identifying our best model, we used model explainers, such as the SHAP package to better understand the relationship between the features and the target.
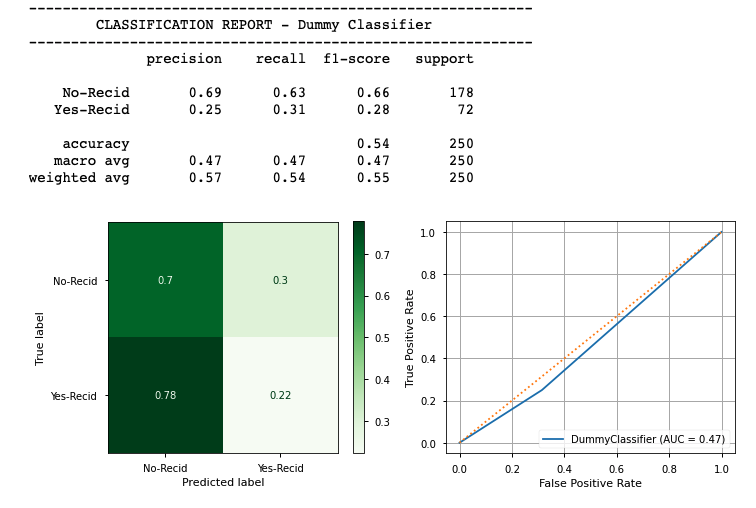
- Since the dataset was fairly imbalanced (66:33 recidivist:non-recidivist), we first created a DummyClassifier set to use the stratified strategy, in which is guesses randomly based on the target's class balance.
-
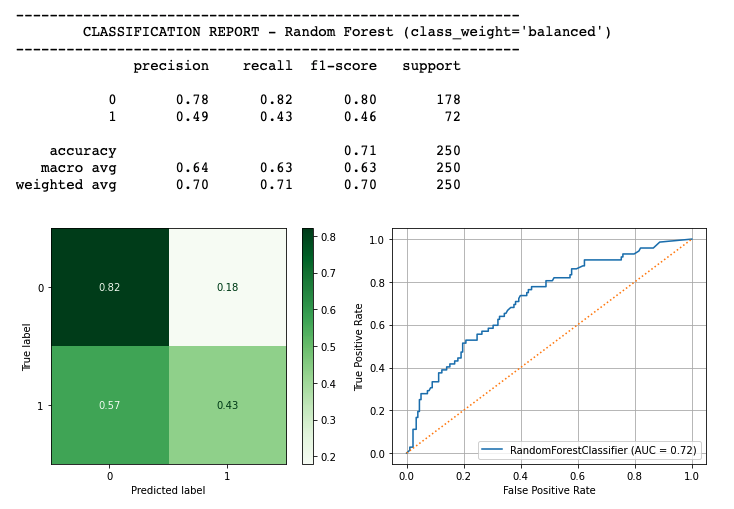
Due to the glass-box nature of the model and the power of ensemble methods, we started with RandomForestClassifiers.
-
RandomForestClassifiers struggled to learn about the target 1 class, recidivist prisoners (Return to Prison==Yes)
-
Even though this model is horribly biased towards predicting non-recidivist, it still is a dramatic improvement over our basement DummyClassifier.
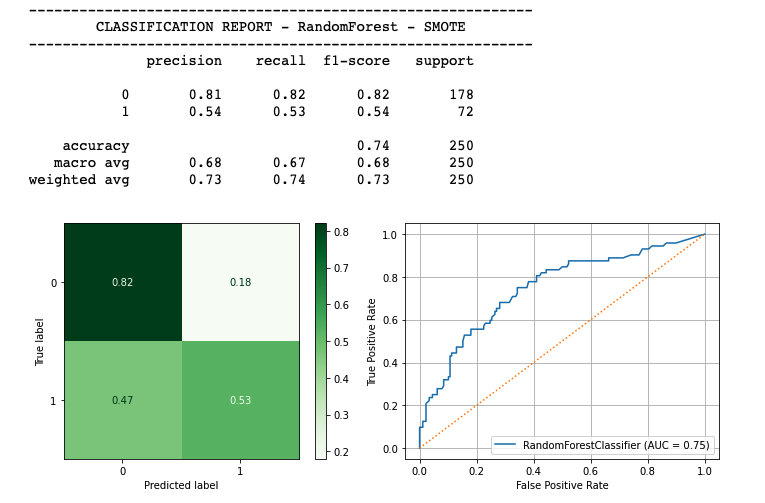
- In order to better address class balance, we oversampled the training data with SMOTENC.
- Oversampling the training data with SMOTENC improved the model's performance
- Recall increased to 0.53 for recidivists
- Accuracy increased to .74
- ROC-AUC increased to 0.75
- We spent time tuning various other model types, but in the end XGBoost's RandomForest Classifier was our best performing model.
- Other models used:
- Logistic Regression
- LinearSVC
- Catboost
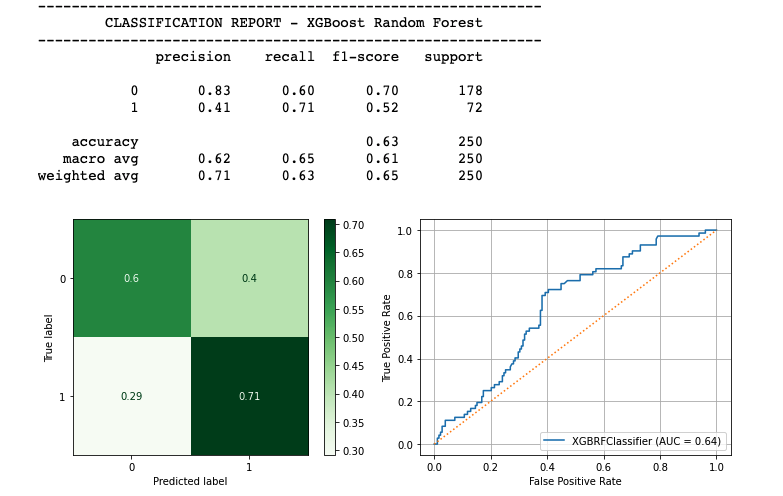
- XGBoost's RandomForest Classifier outperformaned sklearn's RandomForests significantly, in terms of recall, which increased from 0.53 to 0.71 with xgboost.
- However, this came at a tradde off of increased false positives, which lowred our overall accuracy to 0.63 and our ROC-AUC to 0.64.
- Despite the decrease in other metrics, we still selected the xgboost random forest classifier as our best model to use for inferences into what may be contributing towards recidivism.
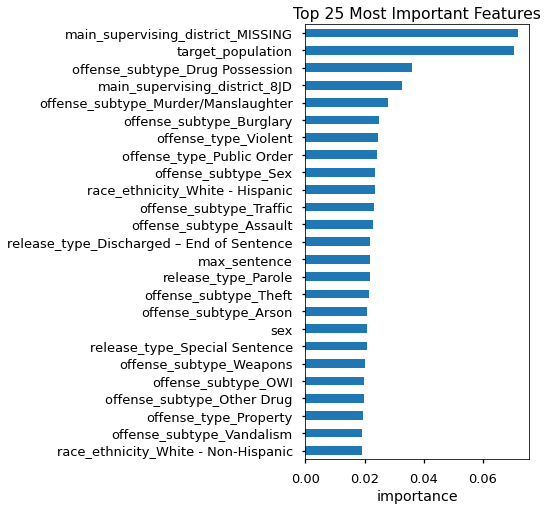
- According to the inherent importances from our best model, the following are the 5 most important features for predicting recidivists:
- main_supervising_district_MISSING
- target_population
- offense_subtype_Drug Possession
- main_supervising_district_8JD
- offense_subtype_Murder/Manslaughter
- The remaining top features are various crime offense subtypes, race/ethnicities, and release types.
- We next used the SHAP package and its game-thoery-based approach to calculating the influence of each feature on the target's predictions.
- This provides a more nuanced view of feature importances, but will also allow us to better understand the directionality of the relationship between our most important features and the likihood of predicting Yes-Recidivist.
- Before examining this nuanced perspective, we will first compare top important features before visualizing the nuanced interactions.
-
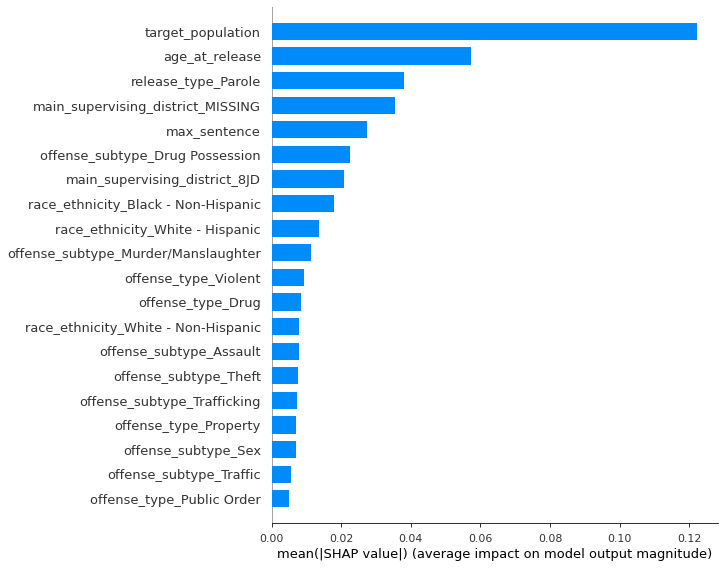
According to the Shapely values calculated by the SHAP package, the following 5 features and
- target_population
- age_at_release
- release_type_Parole
- main_supervising_district_MISSING
- max-sentence
-
The remaining top features are various crime offense subtypes, race/ethnicities.
-
Interestingly, no release types appear in the top features, unlike our xgboost-identified features.
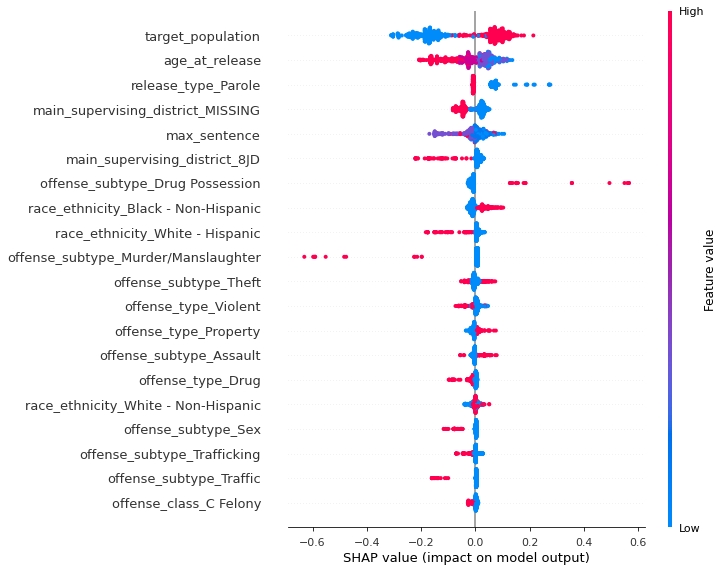
Interpreting shap.summary_plot
- Feature importance: Variables are ranked in descending order.
- Impact: The horizontal location shows whether the effect of that value is associated with a higher or lower prediction.
- Original value: Color shows whether that variable is high (in red) or low (in blue) for that observation.
- According to the Shapely values calculated by the SHAP package, the following 5 features had the following relationships with the target:
target_population:- Being part of the target_population, which was a group of prisoners already receiving additional interventions to prevent recidivism, actually makes the prisoner MORE likely to return to crime.
- While one could interpret this as the state's interventions not being effective, I suggest we instead use this to affirm that the state was correctly targeting at-risk prisoners already, at least partially.
age_at_release:- Unsurprisingly, the younger the prisoner is when released, the more likely they are to return to crime.
- This makes sense in a few ways. For one, the younger they are they less likely they are to be well-established in life and financially stable.
release_type_Parole:- Being released on Parole makes a prisoner less likely to return to crime.
- This makes sense, as parolees are monitored regularly by their parole officers, which would
main_supervising_district_MISSING:- Prisoners who were missing a supervising judicial district were LESS likely to return to crime.
- Future work: investigate which prisoners are assigned supervising judicial districts and which ones are not.
- There could be a logical reason that the prisoner may not need a supervising district, either due to the nature of their crime or release. Further investigation is warranted.
max-sentence:- Max sentence has a more complicated relationship to the target.
- It seems that the criminals in prison for the shortest-sentence crimes and the longest-sentence crimes seem to be more likely to return to crime.
- Crimes that fall in the middle of the range of # of years tend to be less likely to return to crime.
> Some Superivising Judicial districts are more likely to produce recivists.Younger released prisoners are more likely to return to crime.
- Using our model,�Iowa Department of corrections can predict which prisoners may become recidivist.
- Using this information, Iowa can implement pre-release educational programs to target at-risk prisoners, as well as provide post-release support and intervention to at-risk prisoners.
- Additionally, we highly recommend that the Iowa Dept of Corrections investigate the differences between the Supervising Judicial districts to better understand why it is a large factor in the prisoner's outcome.
The lack of numerical features was a major hurdle. The next steps should be to pull in additional information regarding the judical districts and their associated counties (population/crime rate/income, etc). We considered applying neural networks but decided against it due to the black-box nature of artificial neural networks.
Please review the narrative of our analysis in our jupyter notebook project-notebook-iowa-prisoners.ipynb or review our [presentation]("./Predicting Recidivism in Released Prisoner in Iowa_Final_v2.pdf")
For any additional questions, please contact james.irving.phd@gmail.com
