Edit C:/Users/UserName/.phy/phy_config.py(create one if you do not have the directory C:/Users/UserName/.phy), and specify the plugin names to load in the GUI:
fromphyimportIPluginc=get_config()
c.TemplateGUI.plugins= ['SingleWaveformViewPlugin', 'SettingsPlugin', 'PSTHViewPlugin', 'CorrelationViewPlugin', 'SimilarityViewPlugin'] # list of plugin names to load in the TemplateGUIc.Plugins.dirs= [r'C:\Users\jiumao\.phy\plugins'] # the directory where the plugins are located
Open phy. The plugins will be loaded automatically.
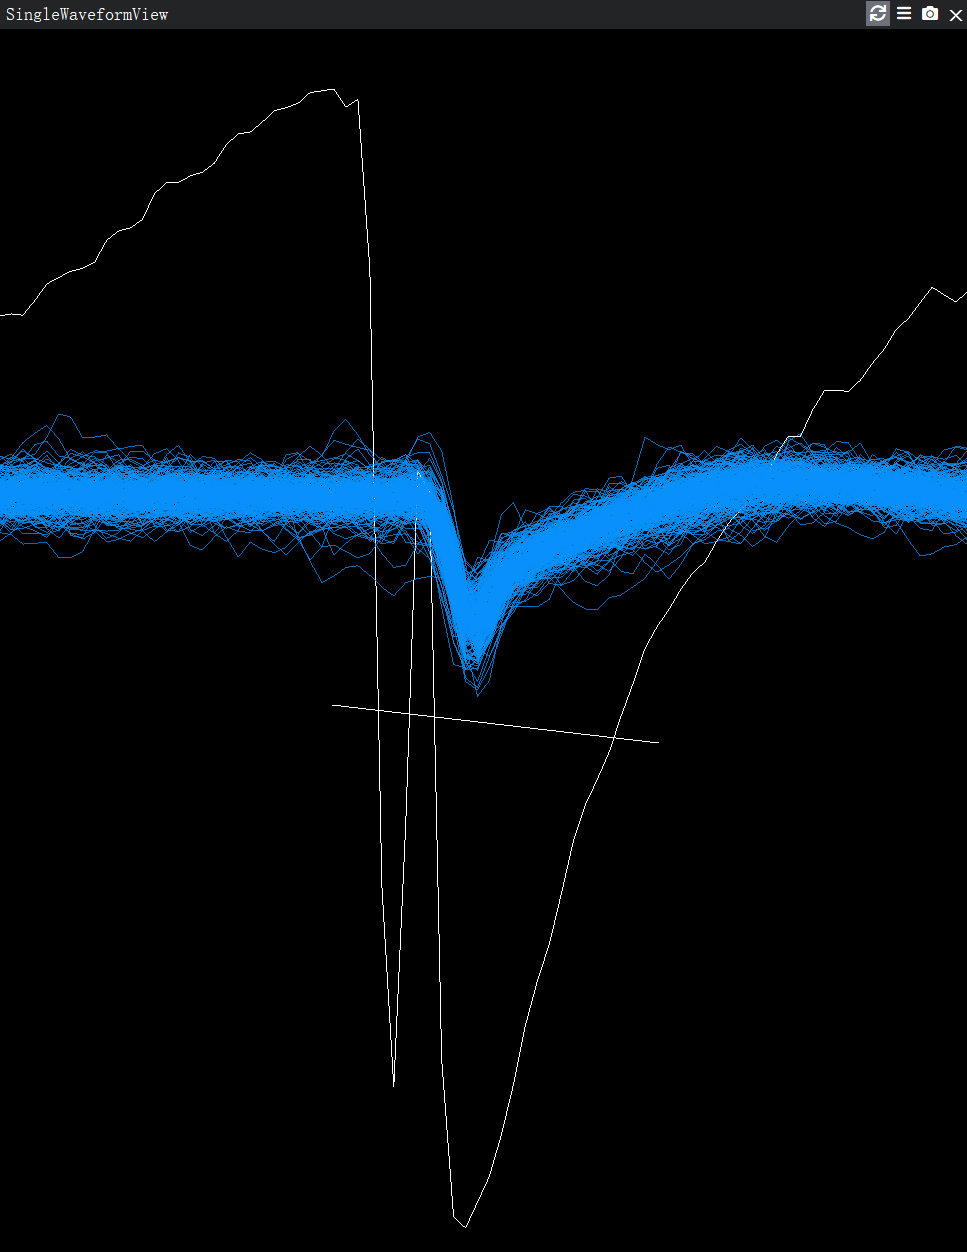
Single Waveform View
Click Menubar -> View -> Add SingleWaveformView
Ctrl + Left Click the waveform in WaveformView to select the channel
Ctrl + Click to select the waveforms that intersect with the line you draw Note: split action will be faster with shorter line.
Press k to split clusters or press s to split clusters and label the minor cluster as noise.
PSTH View
Click Menubar -> View -> Add PSTHView
Click the menu bar to set the events, t_pre, t_post and bin width.
Note: This plugin is only for certain BlackRock recordings.
How to use PSTH View for any recordings?
You should create events.csv and event_labels.csv in the data directory.
The event times should match to spike times.
Filename
Notes
events.csv
Each row is the timings of events
event_labels.csv
Each element is the name of that event
Correlation View
The correlation between clusters. High correlation implys that one of the two clusters is misclassified by Kilosort and should be removed.
Click Menubar -> View -> Add CorrelationView
Click the menu bar to set the events, t_pre, t_post and bin width.
Ctrl + Click to select the point and the corresponding clusters will be selected in ClusterView.
Similarity View
The similarity between clusters. High similarity implys that the two clusters are similar and should be merged.
Click Menubar -> View -> Add SimilarityMatrixView
Click the menu bar to set the point size and types of similarity. Similarity of waveform / autocorrelogram / inter-spike interval is supported.
Click Change dim in the menu would change the dimension of the view. Dimension 2 would generate the scatter plot of the two types of similarity from all pairs of good and mua clusters.
Ctrl + Click to select the point and the corresponding clusters will be selected in ClusterView.
New shortcuts
s: split clusters in SingleWaveformView.py and label the minor output cluster as noise. Undo twice undo this action. Firstly undo the labelling process and secondly undo the splitting process.
-: defined in the SettingsPlugin.py. Apply the filter ContamPct > 150.
Alias ch: defined in the SingleWaveformView.py. Select the channel id in SingleWaveformView. It is useful when the channel of interest is not displayed in WaveformView.
Alias good: defined in the SettingsPlugin.py. Filter good clusters.
Alias mua: defined in the SettingsPlugin.py. Filter mua clusters.
Alias noise: defined in the SettingsPlugin.py. Filter noise clusters.
Alias goodmua or muagood: defined in the SettingsPlugin.py. Filter mua and good clusters.
Alias e: defined in the PSTHView.py. Change to the next event in PSTHView.
About the plugins
WaveformPlugin.py: defines the SingleWaveformView.
SettingsPlugin.py: changes the columns in ClusterView and adds shortcut -.
PSTHPlugin.py: defines the PSTHView.
CorrelationPlugin.py: defines the CorrelationView.
SimilarityPlugin.py: defines the SimilarityMatrixView.