Computer vision 분야의 Feature detection 방식 중 하나인 Local Binary Patterns
Face recognizernition 등에 사용된다.
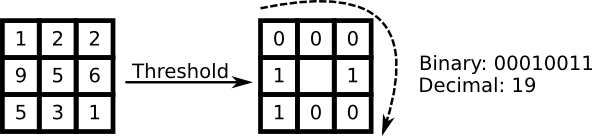
이미지를 3x3 pixel의 블록으로 쪼개어 블록의 중앙값을 기준으로 theresholding 하여 binary로 uint8로 변환하는 방식
-
LBP Code
import matplotlib.pyplot as plt
import numpy as np

org_img = np.transpose(plt.imread('iu3.jpeg'), (2, 0, 1))
r, c = org_img[0].shape
# Image Import Part
# RGB channel
# org_img.shape = (3, r, c)

pd_img = np.pad(org_img, ((0, 0), (1, 1), (1, 1)),\
                'constant', constant_values=(0, 0))
# Padding Part
# pd_img.shape = (3, r+1, c+1)
# for i in range(1, r):
#	for j in range(1, c):
#		pd_img[i][j] = org_img[i][j]

lbp_img = np.zeros_like(org_img)
# result.shape = (3, r, c)

for i in range(3):
    ch_img = pd_img[i]
    # channal choice
    for j in range(r):
        for k in range(c):
            t = ch_img[j:j + 3, k:k + 3]
            # 3*3 array
            tt = t >= t[1, 1]
            # compare with center value
            lbp_img[i][j][k] = \
                np.packbits((tt[1, 0], tt[2, 0], tt[2, 1], tt[2, 2],\
                             tt[1, 2], tt[0, 2], tt[0, 1], tt[0, 0]))[0]
            # Boolean Array 2 Unsigned Int8
            # Into result image

for i in range(3):
    plt.subplot(2, 3, i + 1)
    plt.imshow(org_img[i], cmap=plt.get_cmap('gray'))
    plt.subplot(2, 3, 3 + i + 1)
    plt.imshow(lbp_img[i], cmap=plt.get_cmap('gray'))
plt.show()
# Output Part
-
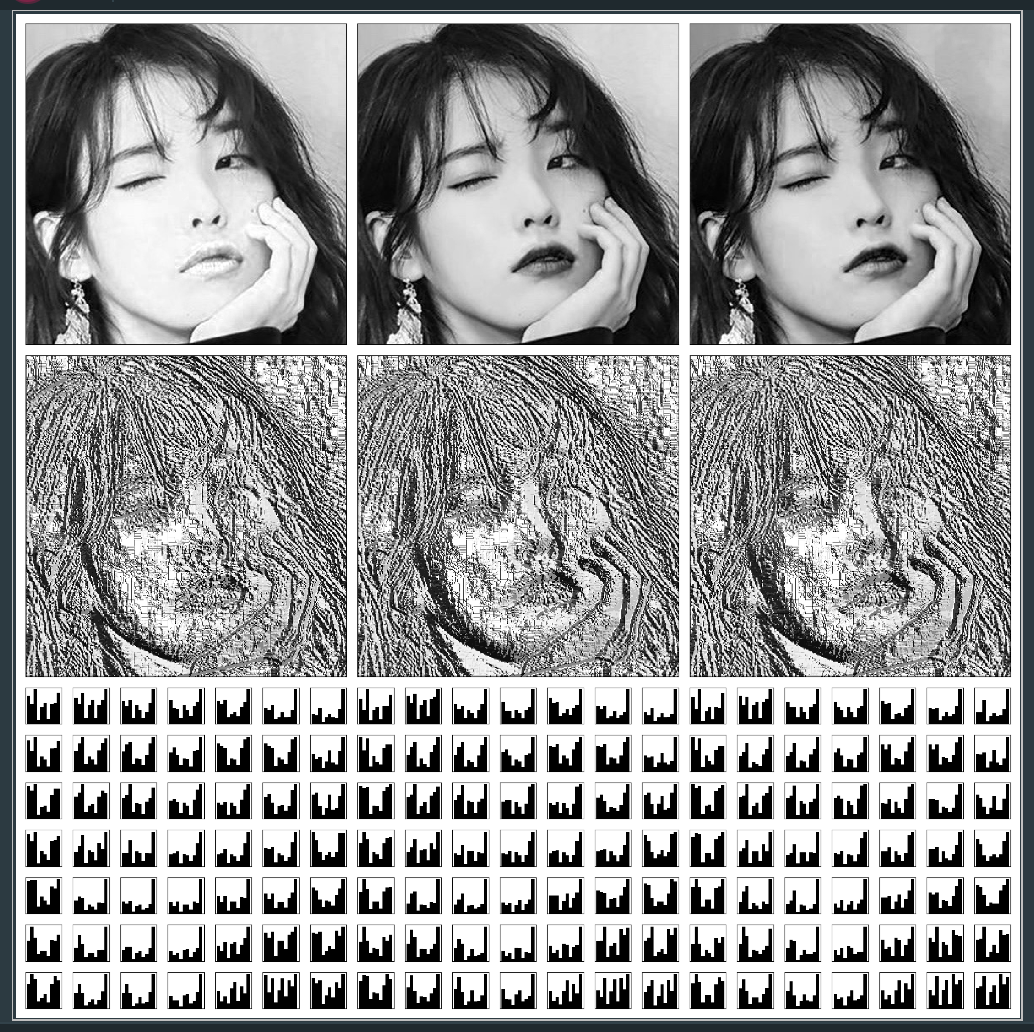
Block histogram
1/4 사이즈를 갖는 블록 구간을 나누어 히스토그램을 출력하였다.
tr, tc = r // 8, c // 8
plt.figure(figsize=(20, 20))
for i in range(3):
    for j in range(7):
        for k in range(7):
            plt.subplot2grid((21, 21), (14 + j, 7 * i + k))
            plt.hist(lbp_img[i, j * tr:(j + 2) * tr, k * tc:(k + 2) * tc],\
                     density=1, histtype='stepfilled', facecolor='k')
            plt.xticks([])
            plt.yticks([])
-
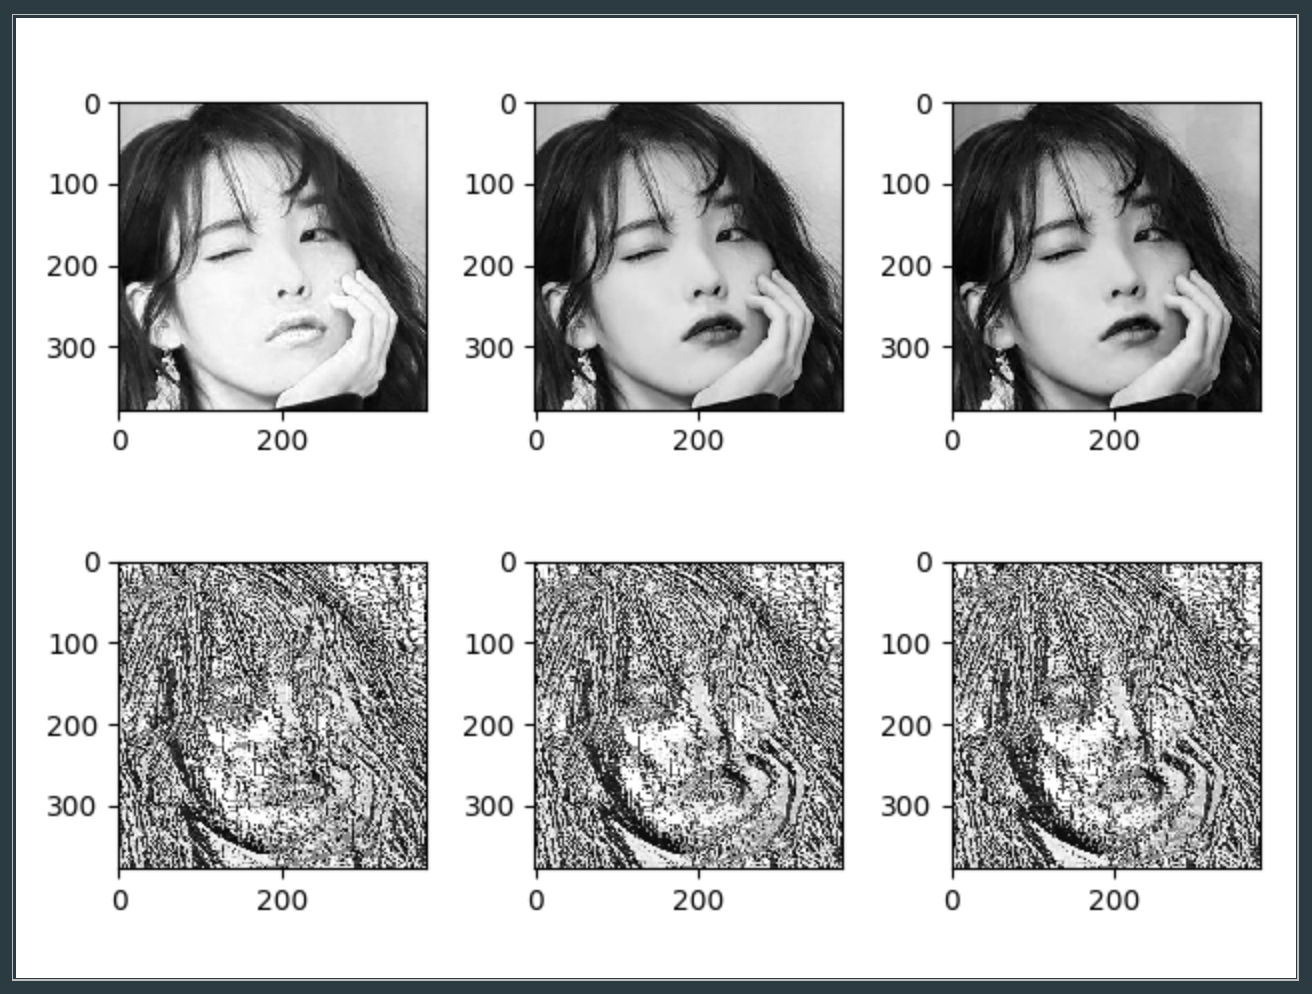
Input Image

-
Output plot
-
Histogram