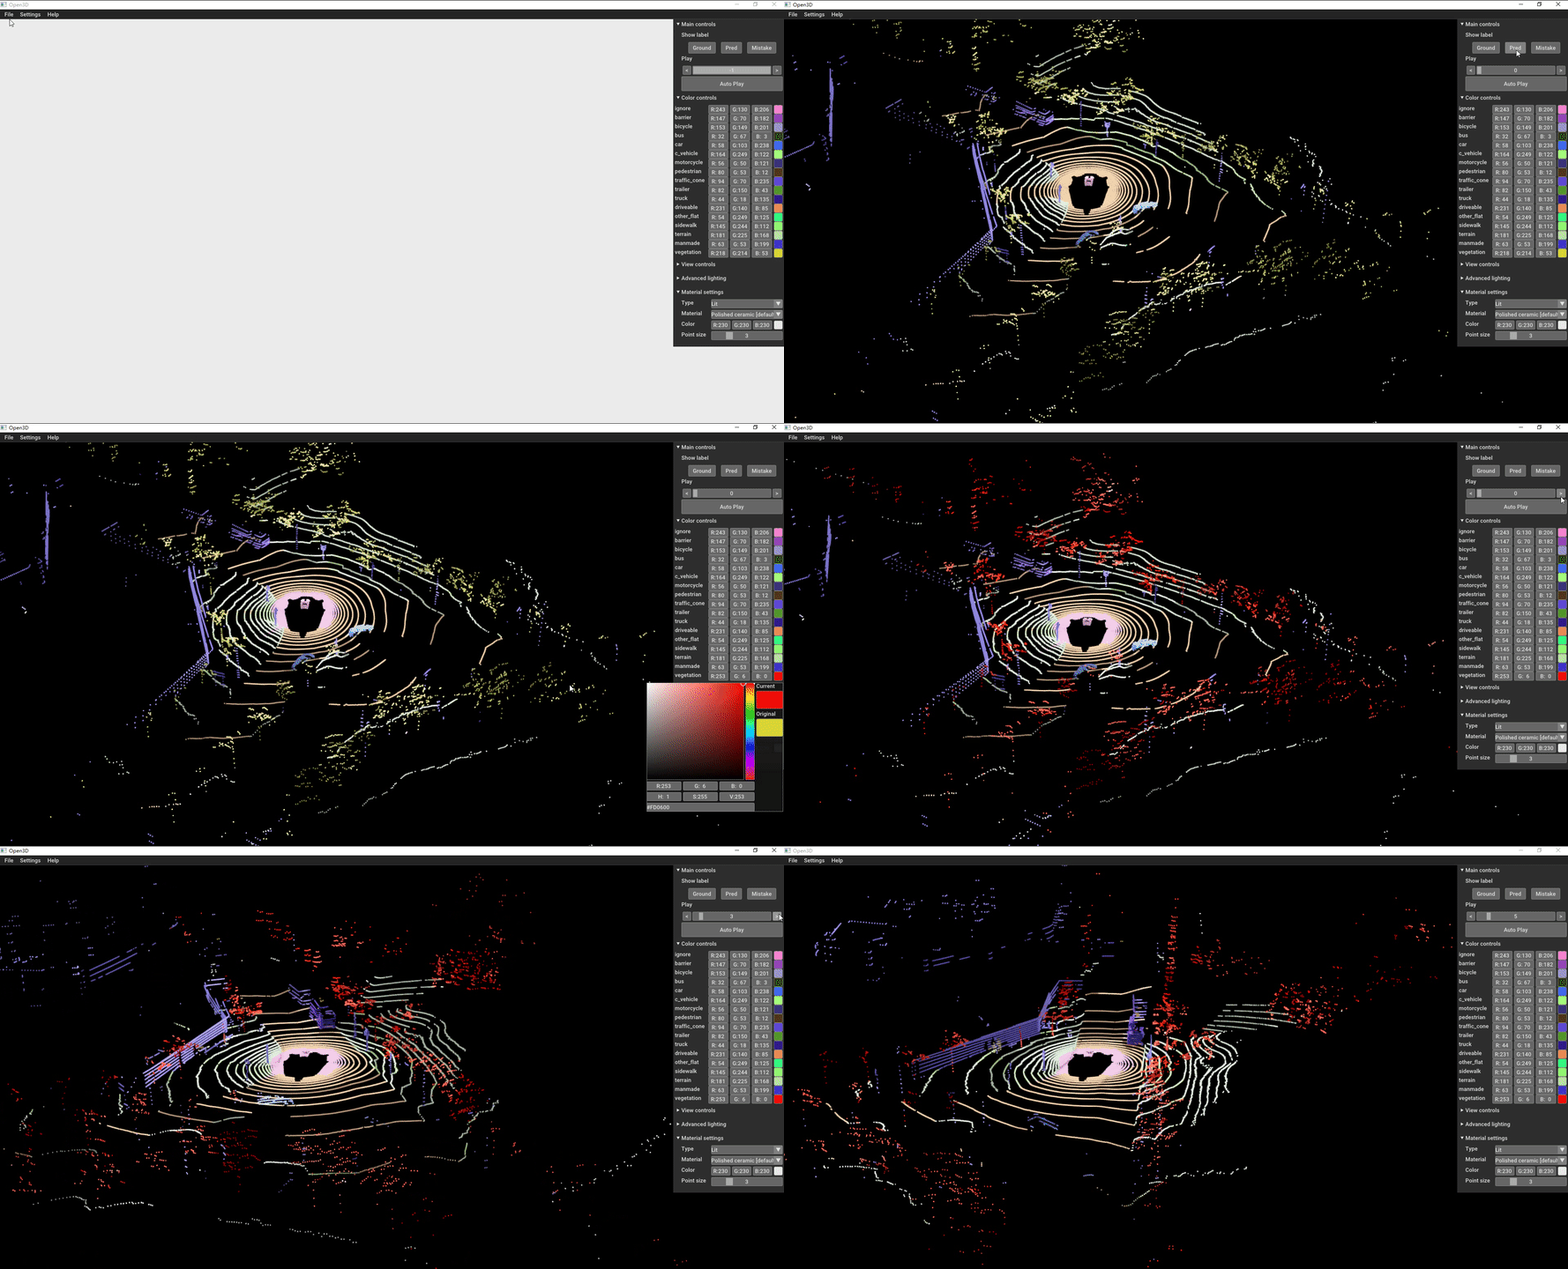
The project is based on vis_gui.py in open3d examples and some new features are added. It visualize the pointclouds and lidarseg from Nuscenes. You can easily customize to fullfill your requirements, such as different semantic label names, different way to organize data and etc. This will be a good starter to learn open3d and Nuscenes Dataset.
- Modify lighting settings, background color, pointcloud (such as material, point size, etc.)
- Hide Control panel
- Export current view as image
- Open the folder of points with UI
- Color the points according to its ground-truth & predicted & false labels
- Play different frames (prev, next and auto-play)
- Change the color of each semantic label and save the setting
- Control with keyboard to move left, right, up, down
