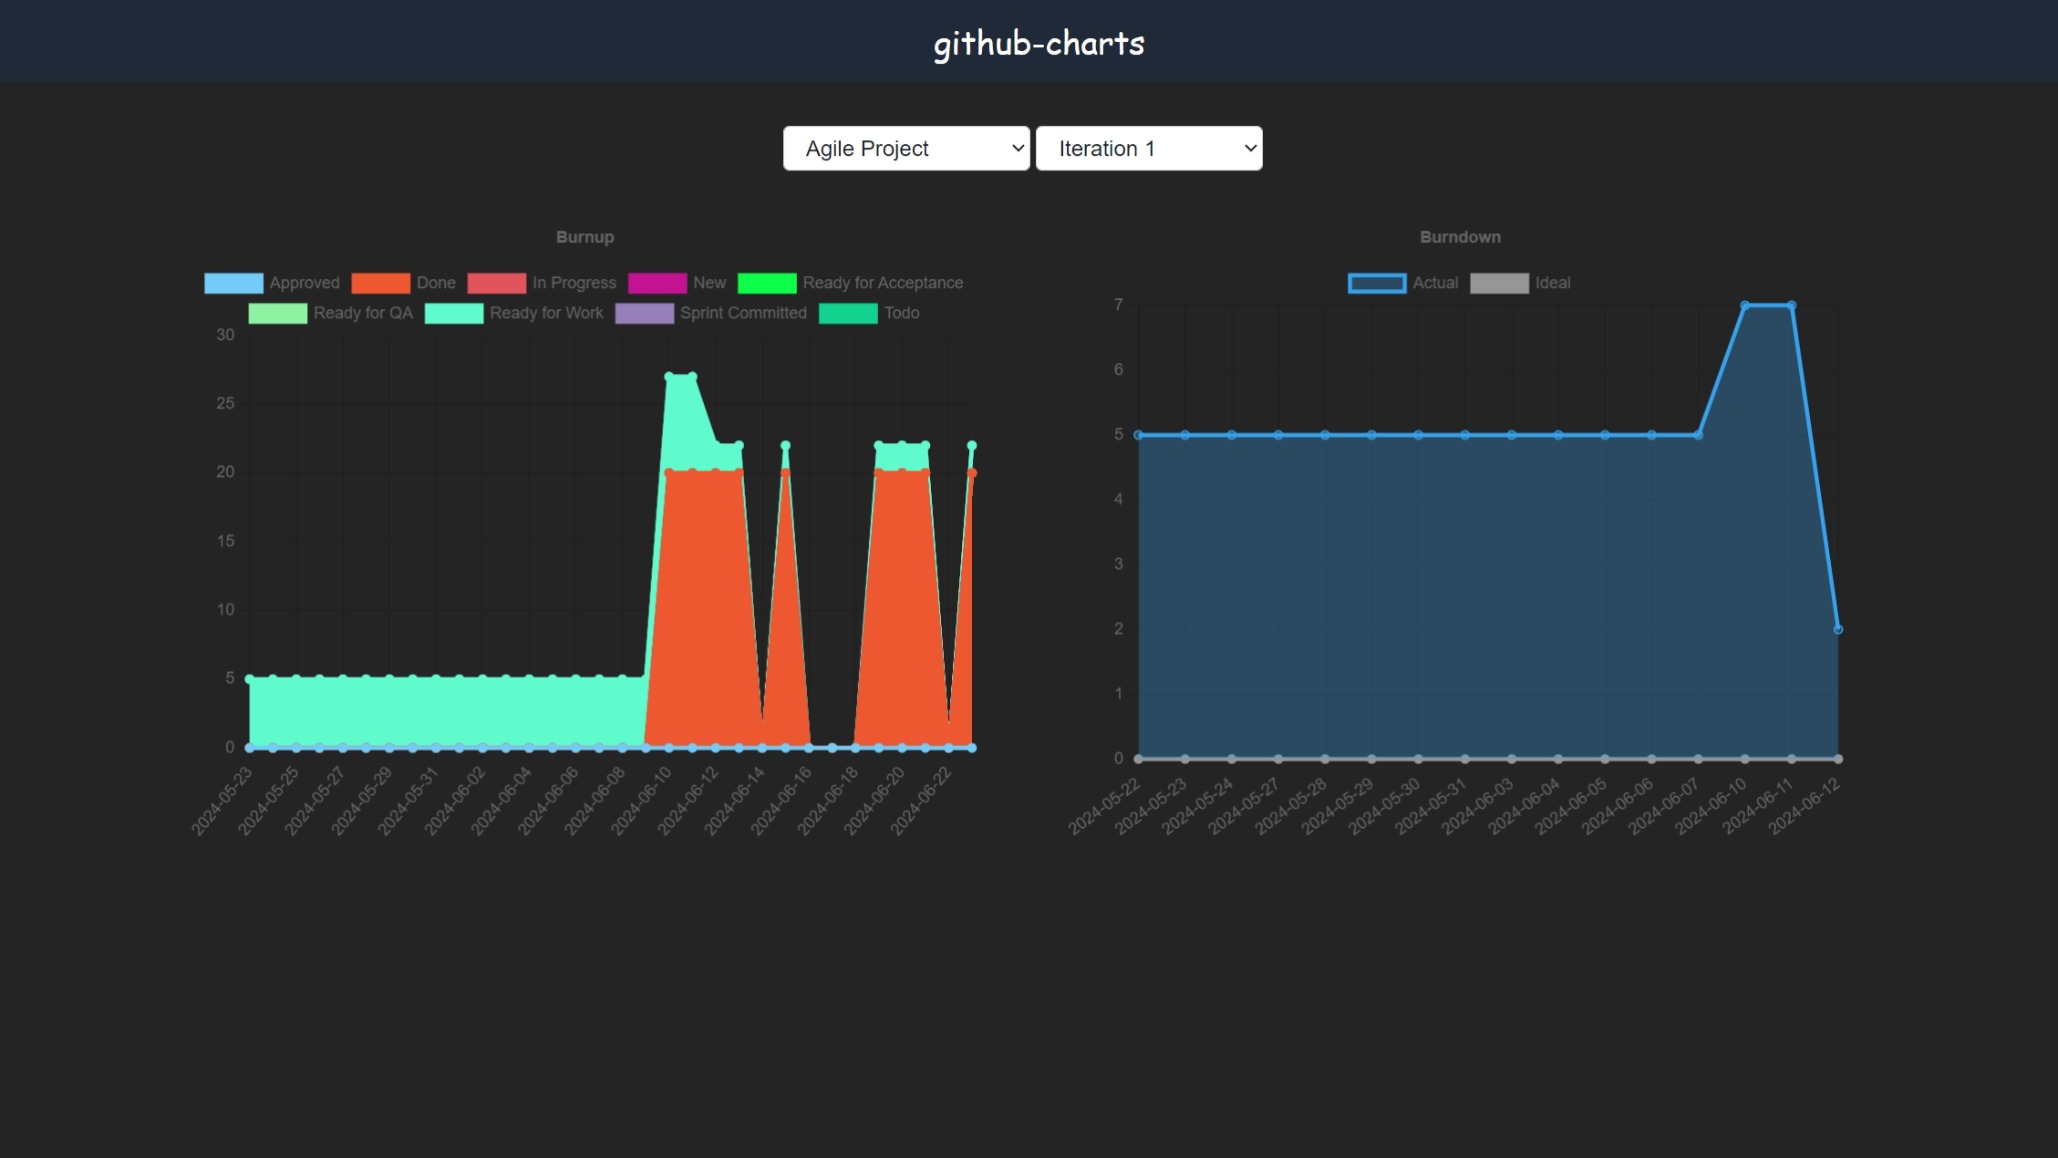
GitHub Projects v2 has greatly evolved in recent years, however, it still lacks good charting support for Agile projects. github-charts is an alternative to expensive paid options to fulfill your Agile charting needs. This project is in its infancy and will very likely die in the future when GitHub decides to provide the capabilities we are adding here.
Because project history is not rich enough yet, we are using the GitHub API to pull project data and store it in a PostgreSQL database. Then, we can chart the data using the Chart.js library and a simple Svelte app. The jobs app, api app, and Svelte app are all bundled in a single container image for easy of use.
You need a PostgresSQL database to store the project data. You can use the following Docker command to start a PostgreSQL container:
docker network create github-charts
docker run --name github-charts-db --network github-charts -e POSTGRES_PASSWORD=mysecretpassword -d postgres
docker exec -it github-charts-db psql -U postgres -c "CREATE DATABASE ghcharts;"
Then, you can start the GitHub Charts container with the following command:
docker run -it -p 8000:8000 `
    --env ENV=DEV `
    --env DATA_PULL_JOB_CRON="*/5 * * * *" `
    --env DB_CONNECTION="postgres://postgres:mysecretpassword@github-charts-db:5432/ghcharts?sslmode=disable" `
    --env GH_PROJECT_1="repo_owner=jlucaspains repo_name=sharp-cooking-web project=7 token=mygithubtoken" `
    --network github-charts `
    jlucaspains/github-charts
Once the first job runs (watch the logs), you should see projects, iterations, and issues in the database. You can then access the Svelte app at http://localhost:8000.
