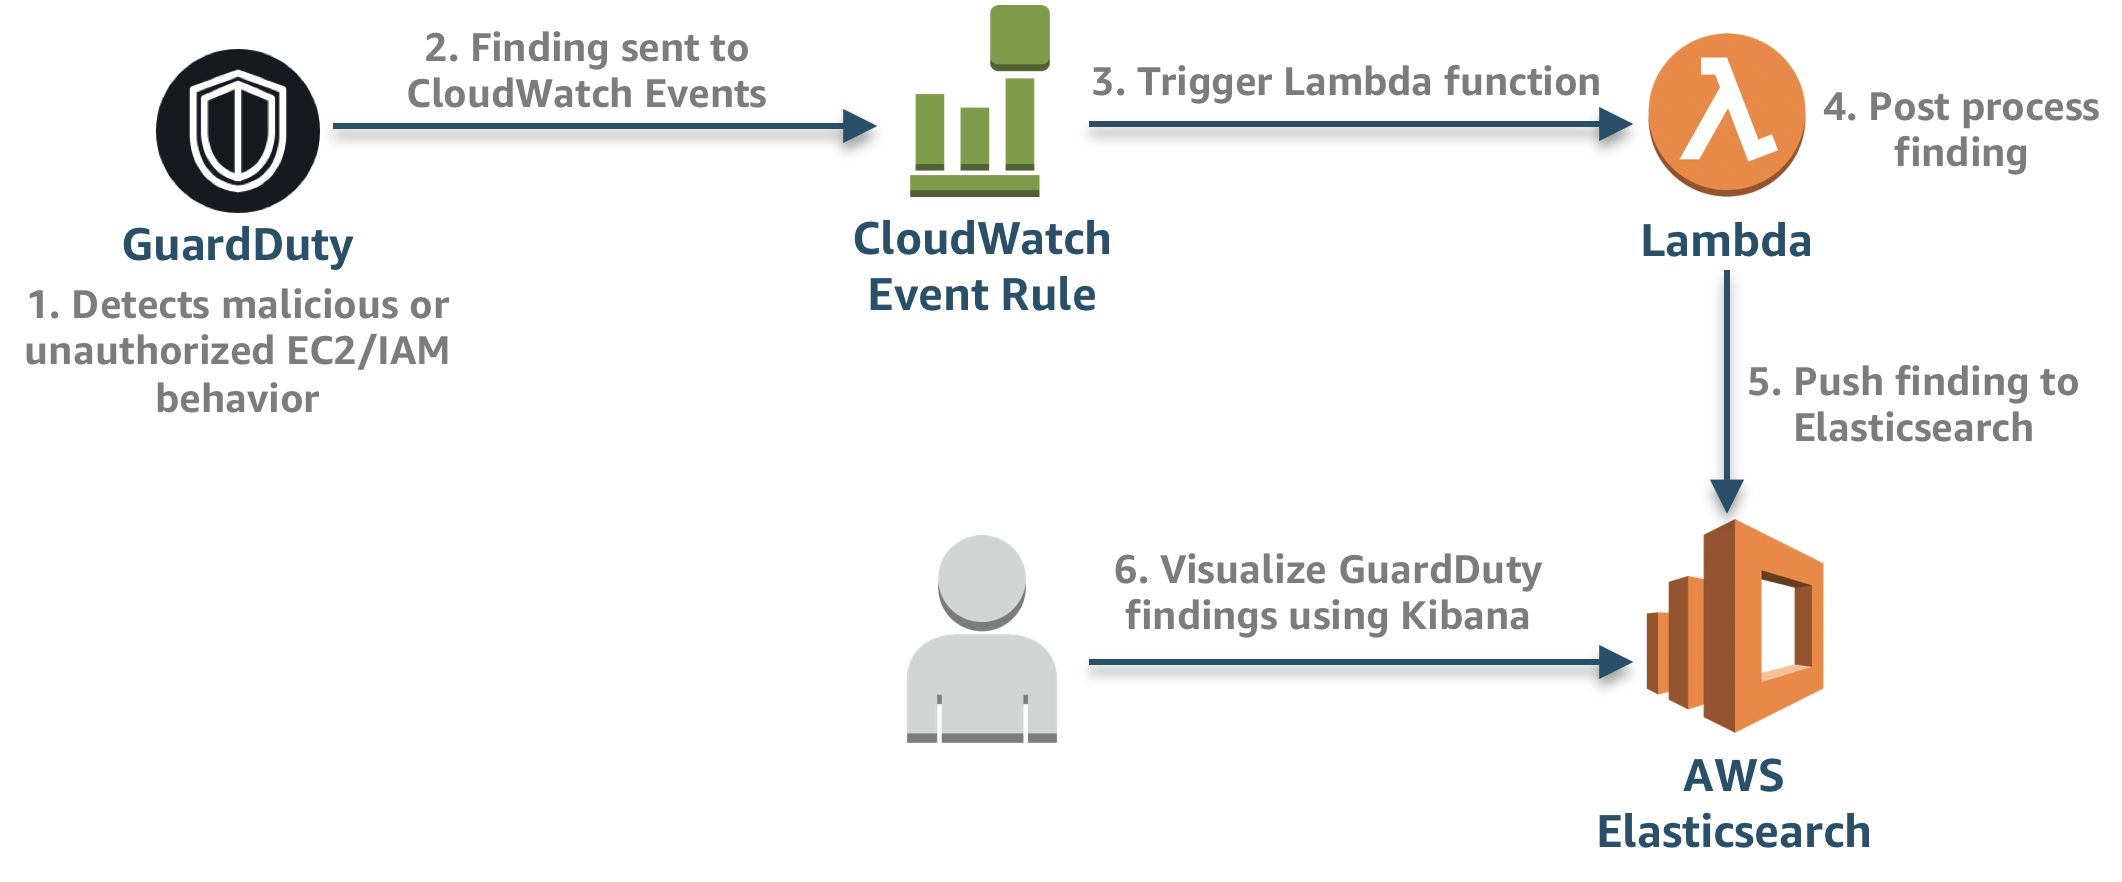
This serverless application creates the necessary resources and integrations for processing Amazon GuardDuty findings. The below architecture showcases how logs are post-processed, and pushed to Elasticsearch.
Below are the necessary prerequisites:
- AWS Account
- Serverless Framework
- An Amazon Elasticsearch cluster. This application builds on aws-cloudtrail-processing in an effort to consolidate more AWS native log sources but can also be run independently.
If you have trouble installing any of the prerequisites or dependencies, you can spin up an AWS Cloud9 environment, which is a cloud-based IDE that comes prepackaged with a number of essential packages. After which you can run the following command to install the Serverless Framework.
npm install -g serverless
Clone the repo and open up environment/dev.yml and add in the appropiate variables.
You can add new files for different environments.
Since the Lambda Function parses through the GuardDuty finding, you can enrich the finding by adding additional information to complement data points and add context. This can either be static data hardcoded in the Lambda function or it can be dynamically pulled from a DynamoDB table or 3rd party threat intelligence feed.
Open guardduty.py, find the section of code below, and add additional metadata as necessary:
############# Add additional metadata to event #############

# Example: Add AWS Account type
i["accountType"] = "Production"

############################################################
Ensure you are in the aws-ct-processing directory and run the following to install the dependencies:
pip install -r requirements.txt -t ./
To deploy the serverless application, run the following command:
sls deploy -s dev -r us-west-2
If you've created different environment files that reference other aws profiles or you want to deploy to different regions, you can replace dev and us-west-2 as necessary.
After to the application has been successfully deployed you can view the logs in Kibana by doing the following:
- Go to the AWS Elasticsearch console.
- Click on the Domain that starts with sls-aws-ct-processing.
- Click the link next to Kibana.
Once you are in Kibana:
- Click Management in the left Navigation.
- Click Index Patterns
- For Step 1 (Define index pattern) type logs-*.
- For Step 2 (Configure Settings) select @timestamp.
- Click Create Index Pattern.
- On the left navigation, click Discover to view your events.
Below are the steps to cleanup this application:
-
Run the below command to delete the serverless application
sls remove -s dev -r us-west-2
