Project to analyze my Spotify listening history, and use the Spotify API to develop a machine learning algorithm that will predict how much I will listen to any inputted song.
This README file is a short description of how the project was undertaken and the steps involved.
The first step to analyzing any Spotify listening history is to request your data from Spotify. This can be done by logging into your Spotify account on the web and going to "Privacy Settings" -> "Download your Data".
This will send a request to Spotify to send your recent listening history. This usually takes a few days to a week, and unfortunately only includes the last 12 months listening history. Luckily I listen to Spotify a lot so this was a lot of tracks (around 9000).
This one is simple, I just used a premade csv file from Kaggle that includes the Rolling Stones Top 500 Albums, Artists, Year of release Genre, and Sub-Genre. [You can find the Kaggle dataset here][rolllingstonesdataset].
Now we have our listening history from Spotify we need to preprocess it and turn it into something useful for analysis.
First thing, the listening history is supplied as several json files, bundled with a log of other information that isn't used through this project, but is pretty interesting and may be the basis of future projects.
The info provided by Spotify is:
- Playlist - A summary of the playlists created or saved, and any songs saved
- Streaming History - A list of items (e.g. songs, videos, and podcasts) listened to or watched in the past year
- Your Library - A summary (at the point of the date of the request) of the content saved in Your Library (songs, podcasts, and videos)
- Search queries - A list of searches made
- Follow - Information regarding who you follow and who follows you
- Payments - This includes details of the payment method
- User Data - Personal User Data including name, address, email address etc
- Inferences - Insights about your interests for ad targeting
More details regarding each json and what is is included can be found [here][spotifysupplieddata].
Obviously some of this information is personal and should not be shared, therefore I've added it all to my .gitignore file and haven't included any of the raw data on my GitHub.
The preprocessing/my_data_preprocessing.py file includes all the code used to turn the data listening history data provided by Spotify into something useful for analysis. In short:
- Combine all listening history jsons into a single dataframe
- Remove unwanted tracks (podcasts, white noise tracks etc)
- Remove tracks with "Unknown Song" and "Unknown Artist". How Spotify doesn't now what was streamed is unknown to me..
- Combine songs with more than one play into a single row and sum their total play time.
- Save dataframe to a pickle file for later.
Not much preprocessing required here as the supplied csv is is a good state.
The file for all the RollingStones500 PReprocessing is included in preprocessing/rollingstones500_preprocessing.py. In short:
- Import csv to pandas dataframe
- drop columns: ["Number", "Genre", "Sub-genre"]
- Save dataframe to pickle
Now we have all the songs we need to do the analysis we need to use the Spotify API to get song features.
Spotify provides the following features for every song in their library:
danceability, energy, key, loudness, mode, speechiness, acousticness, instrumentalness , liveness, valence, tempo, type, id, uri, track_href, analysis_url, duration_ms, time_signature.
Some of these are self-exploratory, information on each of the features can be found [here][spotifyfeaturesinfo].
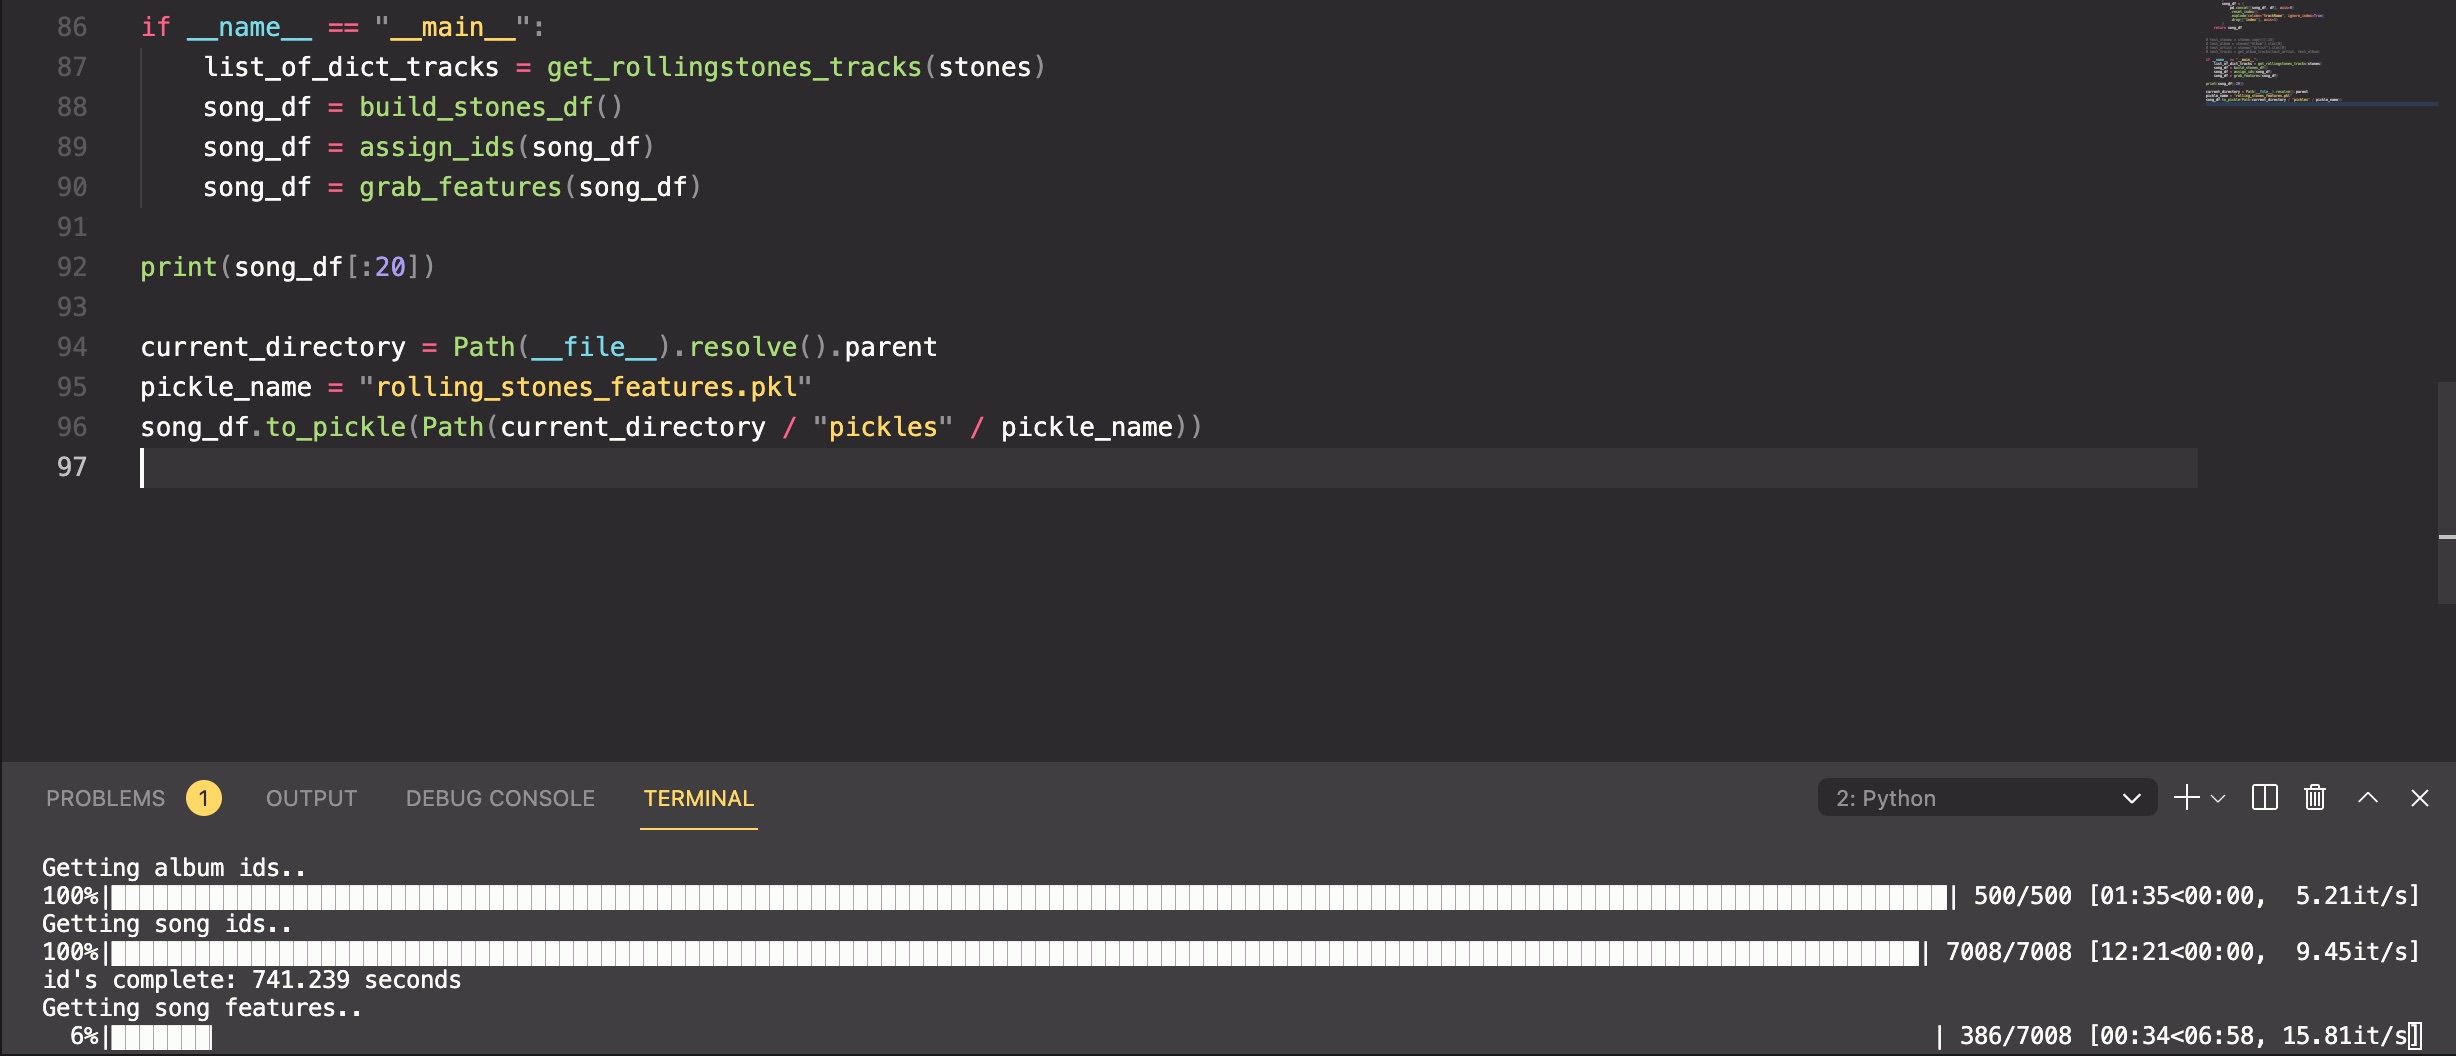
The gathering of track ID and features for each track are relatively slow (around 15 songs/second) and so I wrapped a tqdm progress bar around each function to check on how they are performing.
The code for my my listening history can be found at preprocessing/my_data_spotify_feature_retrieval.py.
The file essentially uses the Spotipy library a a wrapper around the Spotify developers API.
- Uses the artist and track name to return the track ID from Spotify
- Applies this function to all tracks in the dataframe (missing tracks are assigned nan)
- Using the track ID to find all the features for each track and append them to the dataframe.
- Save the completed dataframe to a pickle for later.
The code for the feature retrieval of the rollingstones 500 dataframe can be found at: preprocessing/rollingstones500_feature_retrieval.py
I used a lot of the same functions from the listening history feature retrieval, as is it essentially the same task: Get track ID's based on artist and track -> get features from track ID.
The main difference is the RollingStones 500 CSV only provides the album name and artist name, so we first have to go and pull the track names for that album before getting track ID and features.
Now we have the listening history and rolling stones 500 songs with their unique features we an start doing some machine learning prep.
The plan is to use the listening history song features as our "X" variable, and the total play count for each song as the target "y" variable.
The rolling stones dataframe will then be used to make predictions on.
I first used a jupyter notebook to determine how I wanted to build the neural net (ml_stuff/training/ml_exploration_cap.ipynb). In reality I would start with a simpler algorithm (Random forest or SVM) but I wanted to practice Tensorflow and Keras.
First thing I noticed is that the data us very unbalanced, and very left-skewed. i.e most of the songs I played 0 - 1 times. This is definitely not a great start, and I tried to use log and other power transformers to improve the distribution but this did little to help the performance, and as I am particularly interested in interpretability I decided to just cap the tailing right end. I capped any songs with a play count >10 at 10 plays.
I chose a Mean absolute error metric to determine how close to the actual play count the algorithm got. This seemed to be the easiest to interpret.
A few other notes:
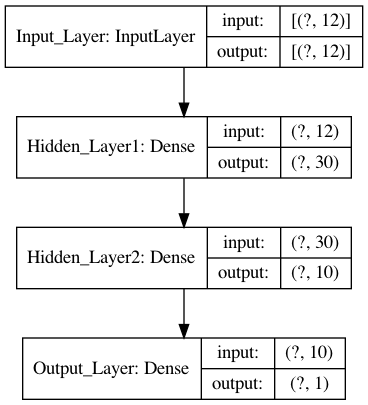
- A simple model with only two layers and (30,10) neurons each performed just as well (even better - less overfitting) than more complicated/deeper models. So I stuck with that.
- I played around with a few hyperparameters - learning rate, batch size, initializers and l1/l2 regularizers, however found that changes to these had negligible effect on the loss when compared with the changes from formatting the input data correctly. (i.e capping plays and scaling features)
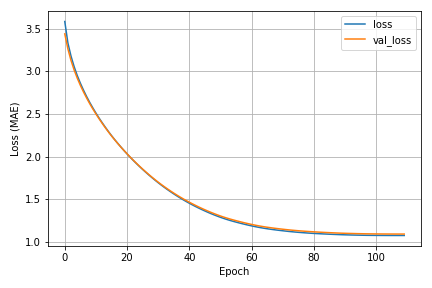
- I used an early stopping callback to prevent overfitting, and allowed me to input an arbitrarily large number of epochs to train on (250)
The other features of the algorithm used can be found [in the notebook][trainingnotebook].
Eventually the MAE loss reduced to around 1 play with a healthy loss/validation loss curve.
After finding an algorithm I was happy with I converted the notebook to a real .py file for actual usage. (ml_stuff/training/ml_training.py) and saved the model for making predictions.
Training the NN is the hardest part, now making predictions in easy!
All the code for predicting is located: ml_stuff/prediction/ml_prediction.py
In short:
- Import Rollingstones500 dataframe from preprocessing step
- drop columns so the df matches that used in training (only audio features left, obviously we have no "play count" column here)
- Scale the features same as in training (Scikit learn standard scalar)
- create a dict with "artist", "track" and "predicted_playcount"
- loop through the features dataframe and append as required to the dict created in step 4
- convert dict to dataframe
done! we now have a dataframe that includes the artist, track, and predicted play count for that particular track.
Once I had made predictions I was intrigued to see what songs it thought I would like and which onesI would hate. It's all captured in the notebook located: ml_stuff/postprocessing/prediction_postprocessing.ipynb.
A few highlights:
-
Overall impression...not good.
1.1. First, I am a pretty huge classic rock fan, and the rolling stone 500 is heavily skewed towards 60s/70s rock albums, so I was expecting a large amount of The Beatles, Led Zeppelin, Pink Floyd etc.
According to my NN the song I would have liked most is a Black Sabbath song. Whilst not completely unreasonable, it definitely wouldn't be my top pick. What's even stranger is a couple of Brian Eno songs coming in at no.3 and no.5. This is very unusal and I would never normally listen to Brian Eno..nothing personal Brian.
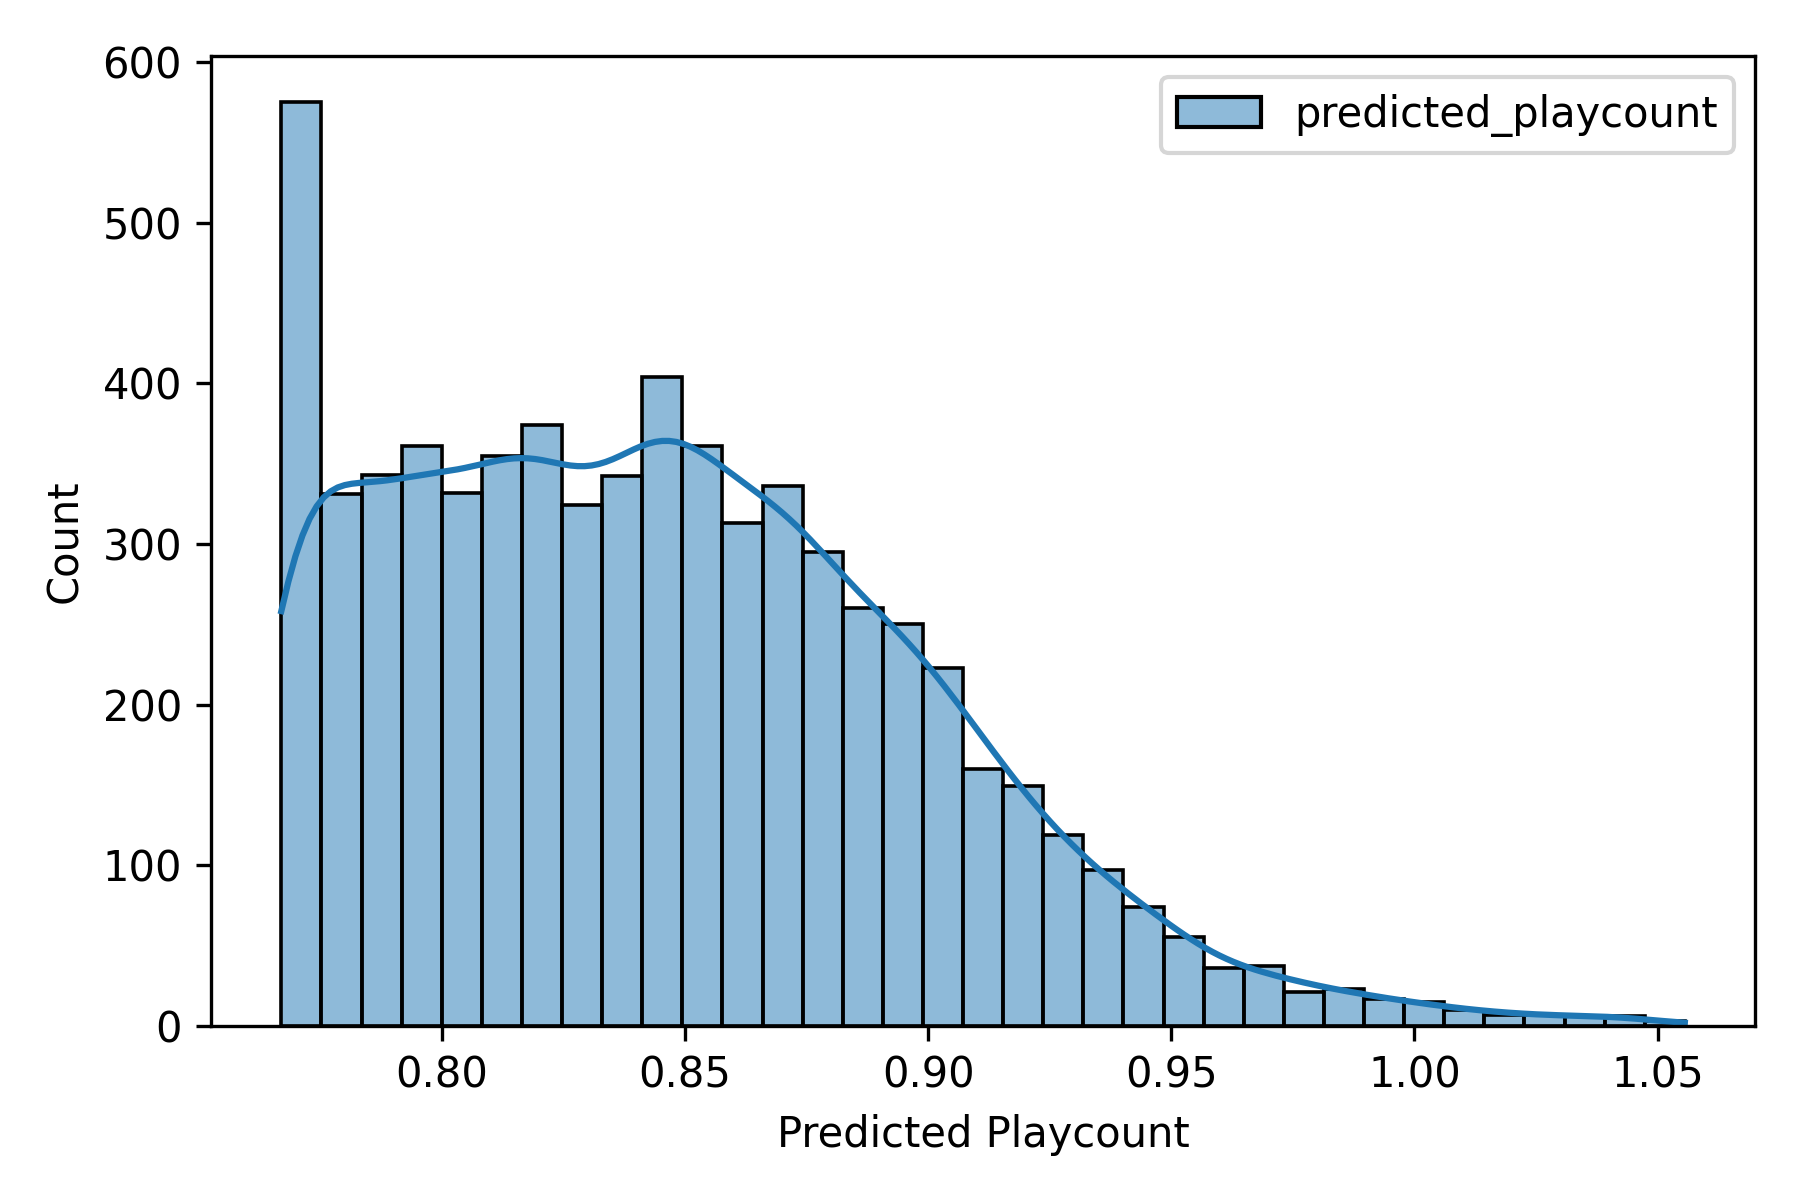
- After digging a little deeper it appears the algorithm is far too conservative. It ranks every song between 0.76 - 1.05 plays, which means there are no songs I would either love or hate.
This was certainly a fun project and I learned a lot about data preparation, tensorflow and choosing model parameters that work well.
I think the best way to improve this would be to just gather more data. My complete listening history was only around 8000 songs which isn't a whole lot to train on.
- Request more data from Spotify (another 12 months worth) and combine to increase the size of my data set.
- Add a "temperature" variable to allow me to control how conservative the algorithm is (gathering more data will also likely help with this).
- I would like to add the Rolling Stones Top 500 songs (perhaps with Spotify features) as a Kaggle Dataset for others to play around with, but first need to confirm which albums are missing, and also any issues/legal implications with publishing Spotify feature data.


