The goal of the HMMiSSA package is to fit Markov-Switching integrated Step-Selection Functions.
You can install the development version of msissf from
GitHub with:
# install.packages("devtools")
devtools::install_github("jmsigner/HMMiSSA")library(amt)
#>
#> Attaching package: 'amt'
#> The following object is masked from 'package:stats':
#>
#> filter
library(HMMiSSA)
set.seed(12)
# Load example data set
data(deer)
forest <- get_sh_forest()Next, prepare the data set using amt.
rs <- deer |>
  filter_min_n_burst(min_n = 4) |>
  steps_by_burst() |>
  random_steps() |> extract_covariates(forest)
Specify the msiSSF:
N <- 2
f <- list(
  habitat.selection = case_ ~ forest + strata(step_id_),
  step.length = ~ log(sl_) + I(sl_ * -1),
  turn.angle = ~ cos(ta_)
)
res1 <- fit_msissf(
  formula = f,
  data = rs,
  start.values = generate_starting_values(f, N = N, rs),
  N = N,
  burst_ = "burst_", decode.states = TRUE, print.level = 0
)
And inspect results
res1$beta
#> [1] -1.1124240  0.7558408
res1$CI
#> $CI_up
#> [1] -0.02095351  1.04049011
#>
#> $CI_low
#> [1] -2.2038946  0.4711915
#>
#> $p.value
#> [1] 4.576108e-02 1.946545e-07

res1$shape
#> [1] 1.5848713 0.9373796
res1$rate
#> [1] 0.020893399 0.001942308
head(res1$decoded.states, 20)
#>  [1] 1 1 2 2 2 2 2 2 2 2 1 2 2 1 1 1 1 1 1 1

library(tidyverse)
#> ── Attaching core tidyverse packages ──────────────────────── tidyverse 2.0.0 ──
#> ✔ dplyr     1.1.4     ✔ readr     2.1.5
#> ✔ forcats   1.0.0     ✔ stringr   1.5.1
#> ✔ ggplot2   3.4.4     ✔ tibble    3.2.1
#> ✔ lubridate 1.9.3     ✔ tidyr     1.3.0
#> ✔ purrr     1.0.2
#> ── Conflicts ────────────────────────────────────────── tidyverse_conflicts() ──
#> ✖ dplyr::filter() masks amt::filter(), stats::filter()
#> ✖ dplyr::lag()    masks stats::lag()
#> ℹ Use the conflicted package (<http://conflicted.r-lib.org/>) to force all conflicts to become errors
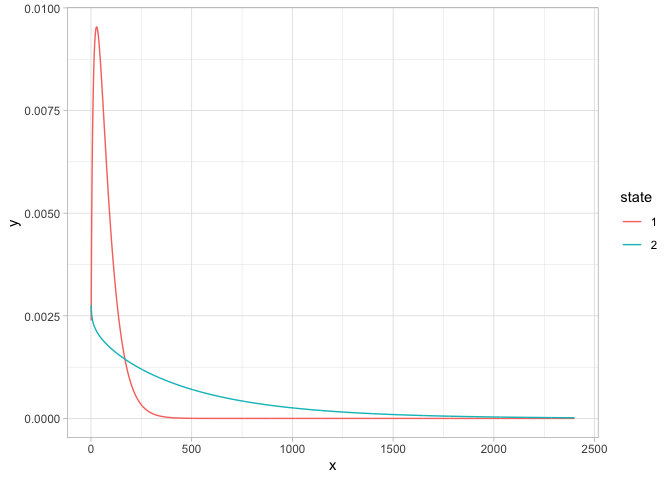
x <- 1:2400
bind_rows(
  tibble(x = x,
         y = dgamma(x, rate = res1$rate[1], shape = res1$shape[1]), state = "1"),
  tibble(x = x,
         y = dgamma(x, rate = res1$rate[2], shape = res1$shape[2]), state = "2")
) |>
  ggplot(aes(x, y, col = state)) + geom_line() + theme_light()