This repository contains files used for analysing passenger data of the RMS Titanic, which unfortunately sank in the North Atlantic Ocean during its maiden voyage on 15 April 1912.
Click here to visit the Wikipedia page on the Titanic.
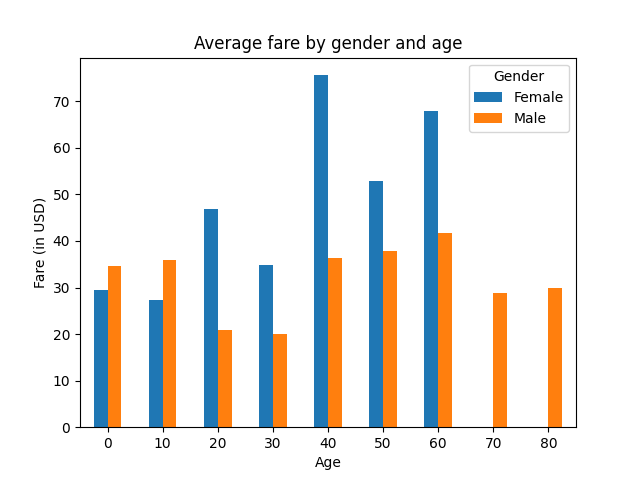
Women between the ages of 20 and 60 (rounded off to the nearest 10) paid more for their tickets on average than men of the same age.
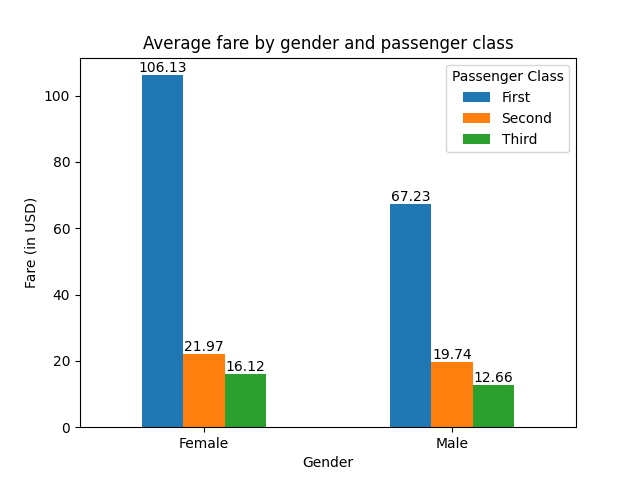
2) Average price of ticket categorised by the gender of the passengers and the classes of seats on the ship.
-
In First Class, the average price of a ticket for women was $38.9 more than men.
-
In Second and Third Class, the average price of a ticket was around the same for both men and women.
-
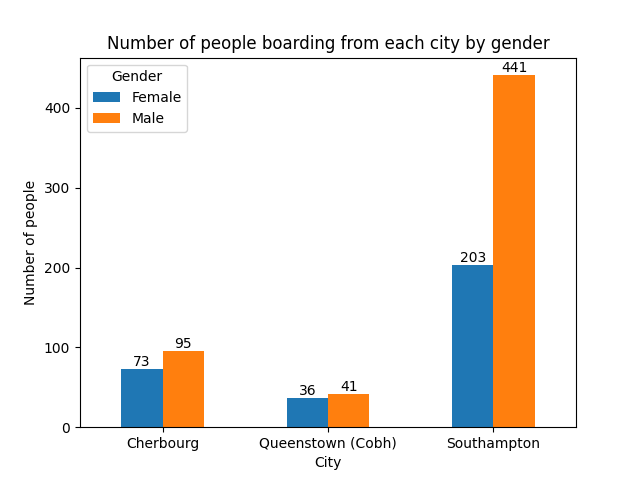
In Cherbourg and Queenstown (Cobh), the number of male and female passengers were almost the same.
-
In Southampton, there were 238 more male passengers than female passengers.
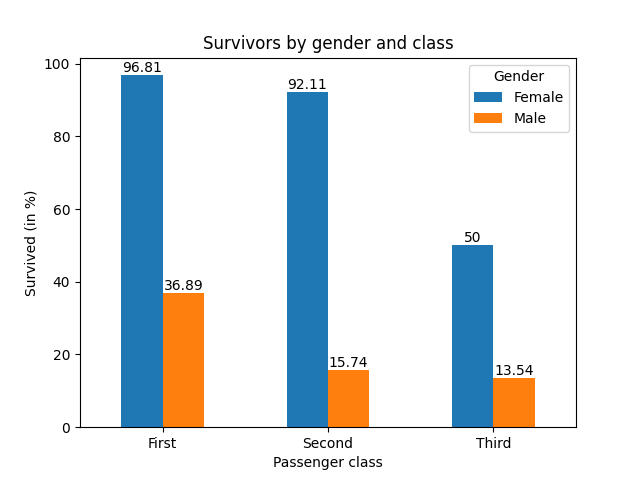
4) Number of survivors categorised by the gender of the passengers and classes of seats on the ship.
-
In First Class, 96.81% of women and 36.89% of men survived the accident.
-
In Second Class, 92.11% of women and 15.74% of men survived the accident.
-
In Third Class, 50% of women and 13.54% of men survived the accident.


