- The data for this analysis comes from Ballotpedia and contains data that classifies states according to the degree of "monopoly" a political party has over the state's government and how long that state's monopoly has been in place.
- I encourage you to check out the analysis here which is where the data is source from.
- For the remainder of this report, I will use the word "Trifecta" instead of "Monopoly".
Ballotpedia classifies states in different types of Trifectas. Below is Ballotpedia's definition for Trifectas:
State government trifecta is a term to describe single-party government, when one political party holds the governorship and majorities in both chambers of the state legislature.
Below I collect the dataset from Ballotpedia's website
from pathlib import Path
import pandas as pd
import geopandas as gpd
from datetime import datetime
import matplotlib.pyplot as plt
from IPython.display import display
import matplotlib.patches as mpatches

df = pd.read_html('https://ballotpedia.org/State_government_trifectas')[4]
df.head()
<style scoped>
.dataframe tbody tr th:only-of-type {
vertical-align: middle;
}
</style>
.dataframe tbody tr th {
    vertical-align: top;
}

.dataframe thead tr th {
    text-align: left;
}
| Trifecta status by state | ||||
|---|---|---|---|---|
| State | Trifecta status | Year of last status change | Unnamed: 3_level_1 | |
| 0 | Alabama | Republican trifecta | 2011 | NaN |
| 1 | Alaska | Divided government | 2015 | NaN |
| 2 | Arizona | Republican trifecta | 2009 | NaN |
| 3 | Arkansas | Republican trifecta | 2015 | NaN |
| 4 | California | Democratic trifecta | 2011 | NaN |
Next I...
- Drop unecessary columns
- Add a column that counts the number years since the status of the state's trifecta has changed
df.columns = df.columns.droplevel().str.lower().str.replace(' ', '_')
df = df[[x for x in df.columns if 'unnamed' not in x]]
df = df.assign(years_with_trifecta=datetime.now().year - df.year_of_last_status_change.astype(int))
display(df.head())
<style scoped>
.dataframe tbody tr th:only-of-type {
vertical-align: middle;
}
</style>
.dataframe tbody tr th {
    vertical-align: top;
}

.dataframe thead th {
    text-align: right;
}
| state | trifecta_status | year_of_last_status_change | years_with_trifecta | |
|---|---|---|---|---|
| 0 | Alabama | Republican trifecta | 2011 | 11 |
| 1 | Alaska | Divided government | 2015 | 7 |
| 2 | Arizona | Republican trifecta | 2009 | 13 |
| 3 | Arkansas | Republican trifecta | 2015 | 7 |
| 4 | California | Democratic trifecta | 2011 | 11 |
Next I filter out states with a "Diveded government" status because they different bodies of the state government are controlled by different political parties
df = df.query('~trifecta_status.str.contains("Divided")')print('States with trifecta:', df.shape[0])States with trifecta: 37
state_abbreviations = pd.read_html('https://www.bu.edu/brand/guidelines/editorial-style/us-state-abbreviations/', header=0)[0]
abbreviations = {}
nones = state_abbreviations.apply(lambda row: {row.iloc[0]: row.iloc[-1]}, axis=1).apply(lambda x: abbreviations.update(x))
df = df.assign(abbreviation=df.state.map(abbreviations))

fig, ax = plt.subplots(figsize=(15,10))
shapefile_path = str(Path('.') / 'shapefiles' /'cb_2018_us_state_20m.shp')
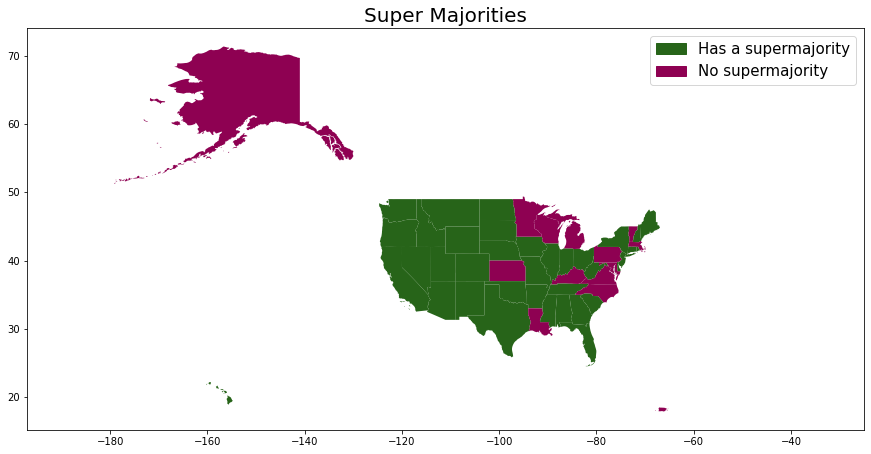
geo_file = gpd.read_file(shapefile_path).assign(supermajority=lambda x: x.STUSPS.isin(df.abbreviation.to_list()).astype(int))
geo_file.plot(column='supermajority', ax=ax, cmap='PiYG')
ax.set_xlim(right=-25)
ax.set_title('Super Majorities', fontsize=20)
green_patch = mpatches.Patch(color='#276419', label='Has a supermajority')
pink_patch = mpatches.Patch(color='#8e0152', label='No supermajority')
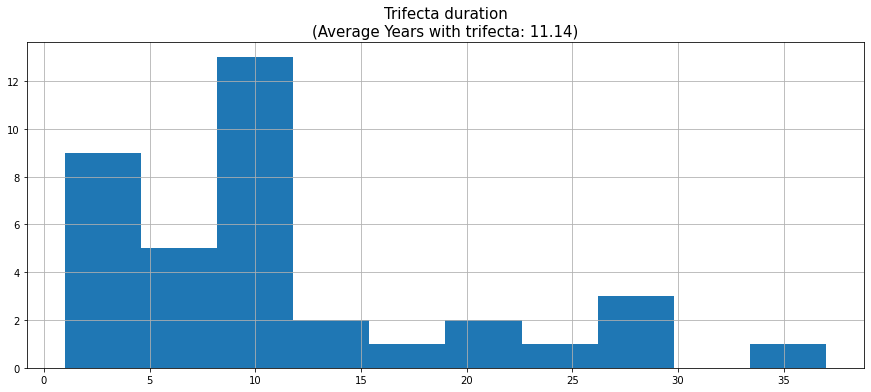
plt.legend(handles=[green_patch, pink_patch], fontsize=15);average_years_trifecta = round(df.years_with_trifecta.mean(), 2)
df.years_with_trifecta.hist(figsize=(15,6))
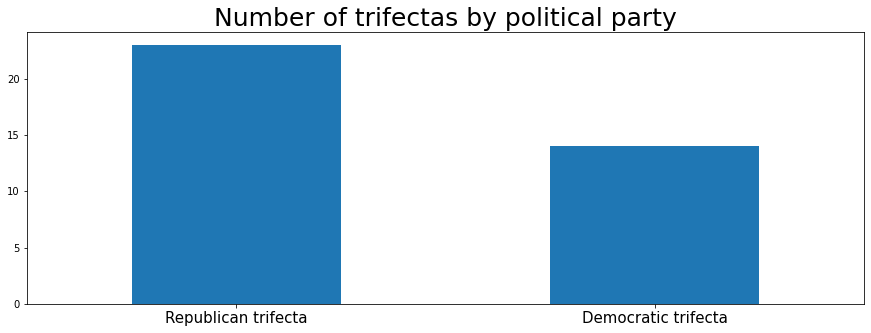
plt.title(f'Trifecta duration\n(Average Years with trifecta: {average_years_trifecta})', fontsize=15);df.trifecta_status.value_counts().plot(kind='bar', figsize=(15,5))
plt.xticks(rotation=0, fontsize=15)
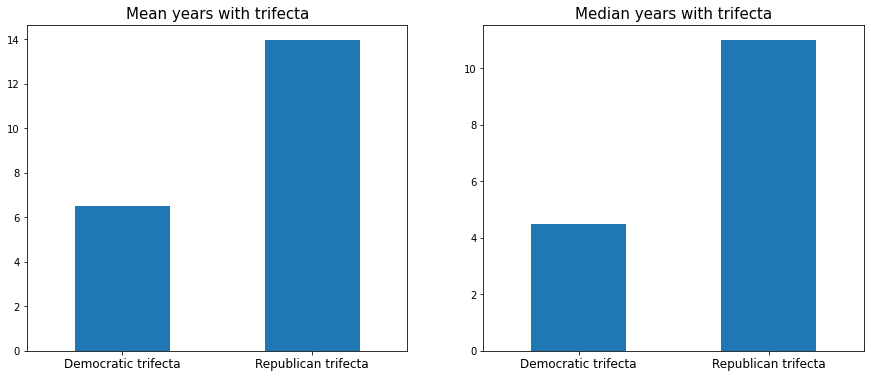
plt.title('Number of trifectas by political party', fontsize=25);fig, ax = plt.subplots(1,2, figsize=(15,6))
df.groupby('trifecta_status').years_with_trifecta.mean().plot(kind='bar', ax=ax[0])
for label in ax[0].get_xticklabels():
label.set_rotation(0)
label.set_fontsize(12)
df.groupby('trifecta_status').years_with_trifecta.median().plot(kind='bar', ax=ax[1])
for label in ax[1].get_xticklabels():
label.set_rotation(0)
label.set_fontsize(12)
ax[0].set_xlabel('')
ax[1].set_xlabel('')
ax[0].set_title('Mean years with trifecta', fontsize=15)
ax[1].set_title('Median years with trifecta', fontsize=15);


