A modified version of the original
dygraph-extra
JavaScript library that adds the ability to export dygraph plots as a
png image, among other things. Intended to be used in
shiny with dygraphs for
R, but dygraph-extra.js does
work as a standalone.
Refer to the shiny-example for the actual files and an example of basic usage.
Dependencies:
- jQuery (loaded by shiny automatically)
- JSZip (only required if downloading multiple dygraphs in a single link)
License:
- The modifications were made by Jimmy Oh for the Ministry of Business, Innovation and Employment. It is released under CC BY. Attribution should be made to MBIE.
This is a modified version of dygraph-extra.js originally released
in 2011 by Juan Manuel Caicedo Carvajal.
The modifications are:
- Fixed y label positioning.
- Automatic detectection of fonts for the labels, rather than relying on predefined or user-supplied fonts. This still isn't perfect, but should be closer to the actual dygraph.
- Fix overflow of legends for too many series (legends now wrap).
- A method for registering dygraphs via a drawcallback, primarily useful for those using the R version of dygraphs.
- A function for downloading one or more registered dygraphs where the dygraphs to download are identified by their id and where multiple plots are zipped together using JSZip.
- Functions to address some bugs/annoyances with dygraphs:
- correct automatic resize on visiblity change.
- correct clearance of selection on mouseleave.
Contains a number of R functions that make it easier to use
dygraph-extra.js in shiny.
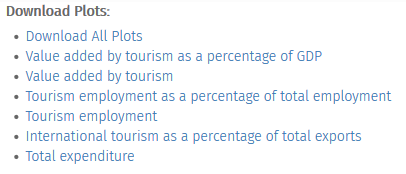
dyDownload("dyout", "Download Plot", asbutton = TRUE)dyDownloadGroup("oecoDyDownloads", "Download Plots:", c(
"Value added by tourism as a percentage of GDP" = "oecogdpperc",
"Value added by tourism" = "oecogdp",
"Tourism employment as a percentage of total employment" = "oecoempperc",
"Tourism employment" = "oecoemp",
"International tourism as a percentage of total exports" = "oecoexpperc",
"Total expenditure" = "oecospend"
))
